Little Bay Airbnb Market Analysis 2026: Short Term Rental Data & Vacation Rental Statistics in Westmoreland, Jamaica
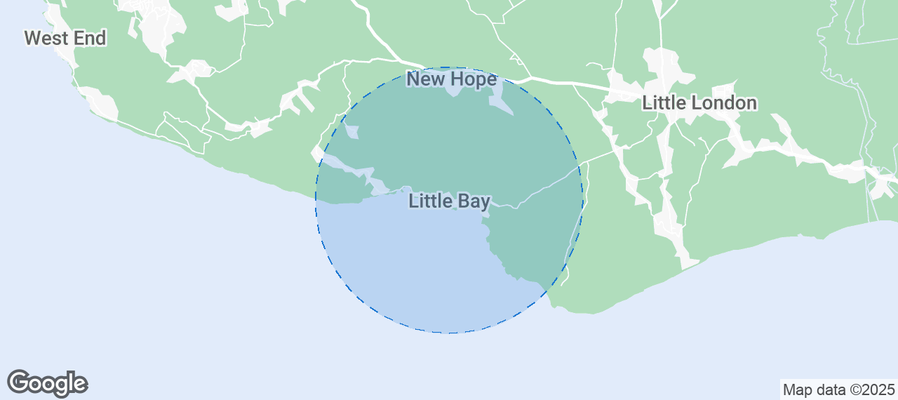
Is Airbnb profitable in Little Bay in 2026? Explore comprehensive Airbnb analytics for Little Bay, Westmoreland, Jamaica to uncover income potential. This 2026 STR market report for Little Bay, based on AirROI data from December 2024 to November 2025, reveals key trends in the niche market of 18 active listings.
Whether you're considering an Airbnb investment in Little Bay, optimizing your existing vacation rental, or exploring rental arbitrage opportunities, understanding the Little Bay Airbnb data is crucial. Leveraging the low regulation environment is key to maximizing your short term rental income potential. Let's dive into the specifics.
Key Little Bay Airbnb Performance Metrics Overview
Monthly Airbnb Revenue Variations & Income Potential in Little Bay (2026)
Understanding the monthly revenue variations for Airbnb listings in Little Bay is key to maximizing your short term rental income potential. Seasonality significantly impacts earnings. Our analysis, based on data from the past 12 months, shows that the peak revenue month for STRs in Little Bay is typically June, while October often presents the lowest earnings, highlighting opportunities for strategic pricing adjustments during shoulder and low seasons. Explore the typical Airbnb income in Little Bay across different performance tiers:
- Best-in-class properties (Top 10%) achieve $2,658+ monthly, often utilizing dynamic pricing and superior guest experiences.
- Strong performing properties (Top 25%) earn $1,619 or more, indicating effective management and desirable locations/amenities.
- Typical properties (Median) generate around $762 per month, representing the average market performance.
- Entry-level properties (Bottom 25%) see earnings around $536, often with potential for optimization.
Average Monthly Airbnb Earnings Trend in Little Bay
Little Bay Airbnb Occupancy Rate Trends (2026)
Maximize your bookings by understanding the Little Bay STR occupancy trends. Seasonal demand shifts significantly influence how often properties are booked. Typically, Junesees the highest demand (peak season occupancy), while October experiences the lowest (low season). Effective strategies, like adjusting minimum stays or offering promotions, can boost occupancy during slower periods. Here's how different property tiers perform in Little Bay:
- Best-in-class properties (Top 10%) achieve 40%+ occupancy, indicating high desirability and potentially optimized availability.
- Strong performing properties (Top 25%) maintain 28% or higher occupancy, suggesting good market fit and guest satisfaction.
- Typical properties (Median) have an occupancy rate around 19%.
- Entry-level properties (Bottom 25%) average 17% occupancy, potentially facing higher vacancy.
Average Monthly Occupancy Rate Trend in Little Bay
Average Daily Rate (ADR) Airbnb Trends in Little Bay (2026)
Effective short term rental pricing strategy in Little Bay involves understanding monthly ADR fluctuations. The Average Daily Rate (ADR) for Airbnb in Little Bay typically peaks in July and dips lowest during January. Leveraging Airbnb dynamic pricing tools or strategies based on this seasonality can significantly boost revenue. Here's a look at the typical nightly rates achieved:
- Best-in-class properties (Top 10%) command rates of $267+ per night, often due to premium features or locations.
- Strong performing properties (Top 25%) achieve nightly rates of $161 or more.
- Typical properties (Median) charge around $107 per night.
- Entry-level properties (Bottom 25%) earn around $66 per night.
Average Daily Rate (ADR) Trend by Month in Little Bay
Get Live Little Bay Market Intelligence 👇
Explore Real-time Analytics
Airbnb Seasonality Analysis & Trends in Little Bay (2025)
Peak Season (June, September, December)
- Revenue averages $1,792 per month
- Occupancy rates average 31.1%
- Daily rates average $136
Shoulder Season
- Revenue averages $1,294 per month
- Occupancy maintains around 24.6%
- Daily rates hold near $136
Low Season (May, October, November)
- Revenue drops to average $360 per month
- Occupancy decreases to average 13.0%
- Daily rates adjust to average $137
Seasonality Insights for Little Bay
- The Airbnb seasonality in Little Bay shows highly seasonal trends requiring careful strategy. While the sections above show seasonal averages, it's also insightful to look at the extremes:
- During the high season, the absolute peak month showcases Little Bay's highest earning potential, with monthly revenues capable of climbing to $2,025, occupancy reaching a high of 36.6%, and ADRs peaking at $139.
- Conversely, the slowest single month of the year, typically falling within the low season, marks the market's lowest point. In this month, revenue might dip to $113, occupancy could drop to 3.2%, and ADRs may adjust down to $134.
- Understanding both the seasonal averages and these monthly peaks and troughs in revenue, occupancy, and ADR is crucial for maximizing your Airbnb profit potential in Little Bay.
Seasonal Strategies for Maximizing Profit
- Peak Season: Maximize revenue through premium pricing and potentially longer minimum stays. Ensure high availability.
- Low Season: Offer competitive pricing, special promotions (e.g., extended stay discounts), and flexible cancellation policies. Target off-season travelers like remote workers or budget-conscious guests.
- Shoulder Seasons: Implement dynamic pricing that balances peak and low rates. Target weekend travelers or specific events. Offer slightly more flexible terms than peak season.
- Regularly analyze your own performance against these Little Bay seasonality benchmarks and adjust your pricing and availability strategy accordingly.
Best Areas for Airbnb Investment in Little Bay (2026)
Exploring the top neighborhoods for short-term rentals in Little Bay? This section highlights key areas, outlining why they are attractive for hosts and guests, along with notable local attractions. Consider these locations based on your target guest profile and investment strategy.
| Neighborhood / Area | Why Host Here? (Target Guests & Appeal) | Key Attractions & Landmarks |
|---|---|---|
| Negril | Famous for its beautiful beaches and stunning sunsets, Negril is a popular destination for vacationers looking to relax in paradise. Its laid-back vibe attracts tourists from all over the world. | Seven Mile Beach, Rick's Café, Negril Lighthouse, Bloody Bay, Mystic Mountain, Nature Preserve |
| Montego Bay | As one of Jamaica's largest cities and a major tourist hub, Montego Bay offers a range of attractions including beaches, resorts, and nightlife. It's perfect for travelers looking for both relaxation and excitement. | Doctor's Cave Beach, Hip Strip, Rose Hall Great House, Martha Brae River, Montego Bay Marine Park, Coral Cliff |
| Ocho Rios | Known for its lush landscapes and fun attractions, Ocho Rios attracts families and adventure seekers. The proximity to famous attractions makes it a prime area for Airbnb hosting. | Dunn's River Falls, Turtle River Falls and Gardens, Mystic Mountain, James Bond Beach, Ocho Rios Market, Reggae Beach |
| Port Antonio | A lesser-known gem, Port Antonio offers a more authentic Jamaican experience, with stunning natural beauty and fewer tourists. Ideal for those looking for tranquility and local culture. | Blue Lagoon, Frenchman's Cove, Winnifred Beach, Portland Parish, Rafter's Rest, Errol Flynn Marina |
| Treasure Beach | This charming fishing village is known for its relaxed atmosphere and stunning coastline. It attracts visitors who prefer a quiet, rural getaway and offers a unique escape from the tourist hotspots. | Treasure Beach, Frenchman's Bay, Billy's Bay, Starve Goat Beach, Jake's Treasure Beach, Black River Safari |
| Runaway Bay | This destination is ideal for tourists looking for beautiful beaches and luxury resorts without the crowds. Its strategic location provides easy access to nearby attractions. | Runaway Bay Beach, Green Grotto Caves, Flavours Beach, Little River, The Jamaica Golf Club, Cardiff Hall Beach |
| Falmouth | With its historic architecture and close proximity to the cruise port, Falmouth is becoming increasingly popular among tourists. Ideal for those interested in history and culture. | Falmouth's Historic District, Water Square, The Glistening Waters, Falmouth's Cruise Port, Good Hope Estate, The Jamaica Swamp Safari |
| Kingston | The capital city offers a vibrant culture with rich history and music. Kingston has a lot to offer for those interested in nightlife, culinary experiences, and local events. | Bob Marley Museum, Devon House, National Gallery of Jamaica, Emancipation Park, Hope Botanical Gardens, Port Royal |
Understanding Airbnb License Requirements & STR Laws in Little Bay (2026)
While Little Bay, Westmoreland, Jamaica currently shows low STR regulations, specific Airbnb license requirements might still exist or change. Always verify the latest short term rental regulations and Airbnb license requirements directly with local government authorities for Little Bay to ensure full compliance before hosting.
(Source: AirROI data, 2026, finding no licensed listings among those analyzed)
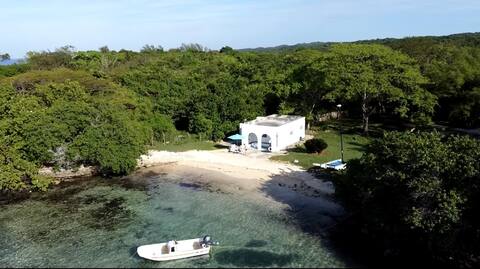
Top Performing Airbnb Properties in Little Bay (2026)
Benchmark your potential! Explore examples of top-performing Airbnb properties in Little Baybased on Trailing Twelve Month (TTM) revenue. Analyze their characteristics, revenue, occupancy rate, and ADR to understand what drives success in this market.

Coral Cottage, Jamaica
Entire Place • 6 bedrooms

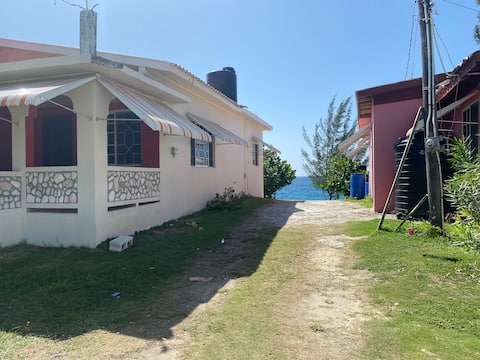
Private Cottage, Vacation Villa on the Sea
Entire Place • 3 bedrooms
Private Beach Cottage
Entire Place • 1 bedroom

Little Bay Beach House
Entire Place • 2 bedrooms
Sea Views, Private Housing! Check out our 2Bd/1Bth
Entire Place • 2 bedrooms
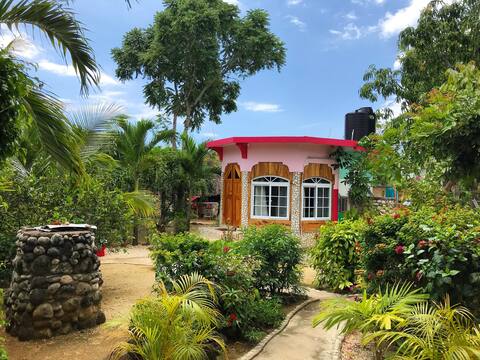
Gazebo Room - Coral Cottage Jamaica
Private Room • 5 bedrooms
Note: Performance varies based on location, size, amenities, seasonality, and management quality. Data reflects the past 12 months.
Top Performing Airbnb Hosts in Little Bay (2026)
Learn from the best! This table showcases top-performing Airbnb hosts in Little Bay based on the number of properties managed and estimated total revenue over the past year. Analyze their scale and performance metrics.
| Host Name | Properties | Grossing Revenue | Stay Reviews | Avg Rating |
|---|---|---|---|---|
| Benjamin | 6 | $66,590 | 87 | 4.94/5.0 |
| Andrew | 1 | $15,665 | 5 | 5.00/5.0 |
| Fanette | 1 | $12,012 | 88 | 4.82/5.0 |
| Witold | 1 | $9,027 | 94 | 4.94/5.0 |
| Francis | 1 | $7,163 | 8 | 4.38/5.0 |
| Wayne | 2 | $7,065 | 12 | 5.00/5.0 |
| Sue | 4 | $3,921 | 30 | 4.93/5.0 |
| Peter | 1 | $2,262 | 25 | 4.80/5.0 |
| Ansley | 1 | $317 | 6 | 4.33/5.0 |
Analyzing the strategies of top hosts, such as their property selection, pricing, and guest communication, can offer valuable lessons for optimizing your own Airbnb operations in Little Bay.
Dive Deeper: Advanced Little Bay STR Market Data (2026)
Ready to unlock more insights? AirROI provides access to advanced metrics and comprehensive Airbnb data for Little Bay. Explore detailed analytics beyond this report to refine your investment strategy, optimize pricing, and maximize your vacation rental profits.
Explore Advanced MetricsLittle Bay Short-Term Rental Market Composition (2026): Property & Room Types
Room Type Distribution
Property Type Distribution
Market Composition Insights for Little Bay
- The Little Bay Airbnb market composition is heavily skewed towards Entire Home/Apt listings, which make up 50% of the 18 active rentals. This indicates strong guest preference for privacy and space.
- However, a notable 44.4% share for Private Rooms suggests opportunities for budget-conscious travelers or hosts renting out spare rooms.
- Looking at the property type distribution in Little Bay, Hotel/Boutique properties are the most common (55.6%), reflecting the local real estate landscape.
- Houses represent a significant 33.3% portion, catering likely to families or larger groups.
- The presence of 55.6% Hotel/Boutique listings indicates integration with traditional hospitality.
Little Bay Airbnb Room Capacity Analysis (2026): Bedroom Distribution
Distribution of Listings by Number of Bedrooms
Room Capacity Insights for Little Bay
- The dominant room capacity in Little Bay is 1 bedroom listings, making up 38.9% of the market. This suggests a strong demand for properties suitable for couples or solo travelers.
- Together, 1 bedroom and 5+ bedrooms properties represent 72.2% of the active Airbnb listings in Little Bay, indicating a high concentration in these sizes.
- A significant 38.9% of listings offer 3+ bedrooms, catering to larger groups and families seeking more space in Little Bay.
Little Bay Vacation Rental Guest Capacity Trends (2026)
Distribution of Listings by Guest Capacity
Guest Capacity Insights for Little Bay
- The most common guest capacity trend in Little Bay vacation rentals is listings accommodating 2 guests (44.4%). This suggests the primary traveler segment is likely couples or solo travelers.
- Properties designed for 2 guests and 4 guests dominate the Little Bay STR market, accounting for 61.1% of listings.
- A significant 44.4% of listings cater specifically to 1-2 guests, highlighting strong demand from couples and solo travelers in Little Bay.
- 11.2% of properties accommodate 6+ guests, serving the market segment for larger families or group travel in Little Bay.
- On average, properties in Little Bay are equipped to host 2.4 guests.
Little Bay Airbnb Booking Patterns (2026): Available vs. Booked Days
Available Days Distribution
Booked Days Distribution
Booking Pattern Insights for Little Bay
- The most common availability pattern in Little Bay falls within the 271-366 days range, representing 100% of listings. This suggests many properties have significant open periods on their calendars.
- Approximately 100.0% of listings show high availability (181+ days open annually), indicating potential for increased bookings or specific owner usage patterns.
- For booked days, the 31-90 days range is most frequent in Little Bay (55.6%), reflecting common guest stay durations or potential owner blocking patterns.
Little Bay Airbnb Minimum Stay Requirements Analysis
Distribution of Listings by Minimum Night Requirement
1 Night
6 listings
33.3% of total
2 Nights
3 listings
16.7% of total
3 Nights
7 listings
38.9% of total
30+ Nights
2 listings
11.1% of total
Key Insights
- The most prevalent minimum stay requirement in Little Bay is 3 Nights, adopted by 38.9% of listings. This highlights the market's preference for longer commitments.
- A significant segment (11.1%) caters to monthly stays (30+ nights) in Little Bay, pointing to opportunities in the extended-stay market.
Recommendations
- Align with the market by considering a 3 Nights minimum stay, as 38.9% of Little Bay hosts use this setting.
- Explore offering discounts for stays of 30+ nights to attract the 11.1% of the market seeking extended stays.
- Adjust minimum nights based on seasonality – potentially shorter during low season and longer during peak demand periods in Little Bay.
Little Bay Airbnb Cancellation Policy Trends Analysis (2026)
Super Strict 30 Days
1 listings
5.6% of total
Flexible
7 listings
38.9% of total
Moderate
2 listings
11.1% of total
Firm
4 listings
22.2% of total
Strict
4 listings
22.2% of total
Cancellation Policy Insights for Little Bay
- The prevailing Airbnb cancellation policy trend in Little Bay is Flexible, used by 38.9% of listings.
- There's a relatively balanced mix between guest-friendly (50.0%) and stricter (44.4%) policies, offering choices for different guest needs.
Recommendations for Hosts
- Consider adopting a Flexible policy to align with the 38.9% market standard in Little Bay.
- Regularly review your cancellation policy against competitors and market demand shifts in Little Bay.
Little Bay STR Booking Lead Time Analysis (2026)
Average Booking Lead Time by Month
Booking Lead Time Insights for Little Bay
- The overall average booking lead time for vacation rentals in Little Bay is 91 days.
- Guests book furthest in advance for stays during March (average 188 days), likely coinciding with peak travel demand or local events.
- The shortest booking windows occur for stays in November (average 1 days), indicating more last-minute travel plans during this time.
- Seasonally, Spring (120 days avg.) sees the longest lead times, while Fall (21 days avg.) has the shortest, reflecting typical travel planning cycles.
Recommendations for Hosts
- Use the overall average lead time (91 days) as a baseline for your pricing and availability strategy in Little Bay.
- For March stays, consider implementing length-of-stay discounts or slightly higher rates for bookings made less than 188 days out to capitalize on advance planning.
- During November, focus on last-minute booking availability and promotions, as guests book with very short notice (1 days avg.).
- Target marketing efforts for the Spring season well in advance (at least 120 days) to capture early planners.
- Monitor your own booking lead times against these Little Bay averages to identify opportunities for dynamic pricing adjustments.
Popular & Essential Airbnb Amenities in Little Bay (2026)
Amenity Prevalence
Amenity Insights for Little Bay
- Essential amenities in Little Bay that guests expect include: Long term stays allowed, Free parking on premises. Lacking these (any) could significantly impact bookings.
- Popular amenities like Dishes and silverware, Coffee maker, Hangers are common but not universal. Offering these can provide a competitive edge.
- Warning: Wifi is not universally provided but is considered essential globally. Ensure reliable Wifi is offered.
Recommendations for Hosts
- Ensure your listing includes all essential amenities for Little Bay: Long term stays allowed, Free parking on premises.
- Consider adding popular differentiators like Dishes and silverware or Coffee maker to increase appeal.
- Highlight unique or less common amenities you offer (e.g., hot tub, dedicated workspace, EV charger) in your listing description and photos.
- Regularly check competitor amenities in Little Bay to stay competitive.
Little Bay Airbnb Guest Demographics & Profile Analysis (2026)
Guest Profile Summary for Little Bay
- The typical guest profile for Airbnb in Little Bay consists of predominantly international visitors (88%), with top international origins including Jamaica, typically belonging to the Post-2000s (Gen Z/Alpha) group (50%), primarily speaking English.
- Domestic travelers account for 11.8% of guests.
- Key international markets include United States (52.9%) and Jamaica (11.8%).
- A significant demographic segment is the Post-2000s (Gen Z/Alpha) group, representing 50% of guests.
Recommendations for Hosts
- Focus marketing internationally, particularly towards travelers from Jamaica.
- Tailor amenities and listing descriptions to appeal to the dominant Post-2000s (Gen Z/Alpha) demographic (e.g., highlight fast WiFi, smart home features, local guides).
- Highlight unique local experiences or amenities relevant to the primary guest profile.
- Consider seasonal promotions aligned with peak travel times for key origin markets.
Nearby Short-Term Rental Market Comparison
How does the Little Bay Airbnb market stack up against its neighbors? Compare key performance metrics like average monthly revenue, ADR, and occupancy rates in surrounding areas to understand the broader regional STR landscape.
| Market | Active Properties | Monthly Revenue | Daily Rate | Avg. Occupancy |
|---|---|---|---|---|
| Barrett Town | 13 | $5,323 | $307.50 | 49% |
| Mount Zion | 31 | $4,042 | $407.83 | 36% |
| West Bay | 32 | $3,485 | $390.16 | 43% |
| Duncans | 26 | $3,008 | $518.85 | 31% |
| Unity Hall | 28 | $2,889 | $346.97 | 29% |
| Davis Cove | 16 | $2,715 | $296.78 | 28% |
| Reading | 53 | $2,352 | $221.15 | 40% |
| Bruces Hill | 16 | $2,201 | $651.69 | 21% |
| Treasure Beach | 142 | $2,157 | $313.99 | 30% |
| Culloden | 15 | $2,123 | $407.97 | 30% |