Bungoma Township ward Airbnb Market Analysis 2025: Short Term Rental Data & Vacation Rental Statistics in Bungoma County, Kenya
Is Airbnb profitable in Bungoma Township ward in 2025? Explore comprehensive Airbnb analytics for Bungoma Township ward, Bungoma County, Kenya to uncover income potential. This 2025 STR market report for Bungoma Township ward, based on AirROI data from May 2024 to April 2025, reveals key trends in the niche market of 21 active listings.
Whether you're considering an Airbnb investment in Bungoma Township ward, optimizing your existing vacation rental, or exploring rental arbitrage opportunities, understanding the Bungoma Township ward Airbnb data is crucial. Leveraging the low regulation environment is key to maximizing your short term rental income potential. Let's dive into the specifics.
Key Bungoma Township ward Airbnb Performance Metrics Overview
Monthly Airbnb Revenue Variations & Income Potential in Bungoma Township ward (2025)
Understanding the monthly revenue variations for Airbnb listings in Bungoma Township ward is key to maximizing your short term rental income potential. Seasonality significantly impacts earnings. Our analysis, based on data from the past 12 months, shows that the peak revenue month for STRs in Bungoma Township ward is typically May, while November often presents the lowest earnings, highlighting opportunities for strategic pricing adjustments during shoulder and low seasons. Explore the typical Airbnb income in Bungoma Township ward across different performance tiers:
- Best-in-class properties (Top 10%) achieve $458+ monthly, often utilizing dynamic pricing and superior guest experiences.
- Strong performing properties (Top 25%) earn $295 or more, indicating effective management and desirable locations/amenities.
- Typical properties (Median) generate around $192 per month, representing the average market performance.
- Entry-level properties (Bottom 25%) see earnings around $145, often with potential for optimization.
Average Monthly Airbnb Earnings Trend in Bungoma Township ward
Bungoma Township ward Airbnb Occupancy Rate Trends (2025)
Maximize your bookings by understanding the Bungoma Township ward STR occupancy trends. Seasonal demand shifts significantly influence how often properties are booked. Typically, Maysees the highest demand (peak season occupancy), while November experiences the lowest (low season). Effective strategies, like adjusting minimum stays or offering promotions, can boost occupancy during slower periods. Here's how different property tiers perform in Bungoma Township ward:
- Best-in-class properties (Top 10%) achieve 51%+ occupancy, indicating high desirability and potentially optimized availability.
- Strong performing properties (Top 25%) maintain 34% or higher occupancy, suggesting good market fit and guest satisfaction.
- Typical properties (Median) have an occupancy rate around 27%.
- Entry-level properties (Bottom 25%) average 21% occupancy, potentially facing higher vacancy.
Average Monthly Occupancy Rate Trend in Bungoma Township ward
Average Daily Rate (ADR) Airbnb Trends in Bungoma Township ward (2025)
Effective short term rental pricing strategy in Bungoma Township ward involves understanding monthly ADR fluctuations. The Average Daily Rate (ADR) for Airbnb in Bungoma Township ward typically peaks in July and dips lowest during December. Leveraging Airbnb dynamic pricing tools or strategies based on this seasonality can significantly boost revenue. Here's a look at the typical nightly rates achieved:
- Best-in-class properties (Top 10%) command rates of $53+ per night, often due to premium features or locations.
- Strong performing properties (Top 25%) achieve nightly rates of $37 or more.
- Typical properties (Median) charge around $22 per night.
- Entry-level properties (Bottom 25%) earn around $18 per night.
Average Daily Rate (ADR) Trend by Month in Bungoma Township ward
Get Live Bungoma Township ward Market Intelligence 👇
Explore Real-time Analytics
Airbnb Seasonality Analysis & Trends in Bungoma Township ward (2025)
Peak Season (May, June, February)
- Revenue averages $528 per month
- Occupancy rates average 61.8%
- Daily rates average $29
Shoulder Season
- Revenue averages $174 per month
- Occupancy maintains around 20.7%
- Daily rates hold near $29
Low Season (April, November, December)
- Revenue drops to average $129 per month
- Occupancy decreases to average 17.6%
- Daily rates adjust to average $28
Seasonality Insights for Bungoma Township ward
- The Airbnb seasonality in Bungoma Township ward shows highly seasonal trends requiring careful strategy. While the sections above show seasonal averages, it's also insightful to look at the extremes:
- During the high season, the absolute peak month showcases Bungoma Township ward's highest earning potential, with monthly revenues capable of climbing to $725, occupancy reaching a high of 88.7%, and ADRs peaking at $31.
- Conversely, the slowest single month of the year, typically falling within the low season, marks the market's lowest point. In this month, revenue might dip to $114, occupancy could drop to 10.0%, and ADRs may adjust down to $26.
- Understanding both the seasonal averages and these monthly peaks and troughs in revenue, occupancy, and ADR is crucial for maximizing your Airbnb profit potential in Bungoma Township ward.
Seasonal Strategies for Maximizing Profit
- Peak Season: Maximize revenue through premium pricing and potentially longer minimum stays. Ensure high availability.
- Low Season: Offer competitive pricing, special promotions (e.g., extended stay discounts), and flexible cancellation policies. Target off-season travelers like remote workers or budget-conscious guests.
- Shoulder Seasons: Implement dynamic pricing that balances peak and low rates. Target weekend travelers or specific events. Offer slightly more flexible terms than peak season.
- Regularly analyze your own performance against these Bungoma Township ward seasonality benchmarks and adjust your pricing and availability strategy accordingly.
Best Areas for Airbnb Investment in Bungoma Township ward (2025)
Exploring the top neighborhoods for short-term rentals in Bungoma Township ward? This section highlights key areas, outlining why they are attractive for hosts and guests, along with notable local attractions. Consider these locations based on your target guest profile and investment strategy.
| Neighborhood / Area | Why Host Here? (Target Guests & Appeal) | Key Attractions & Landmarks |
|---|---|---|
| Bungoma Town Center | The commercial hub of Bungoma with access to shopping, dining, and local culture. Ideal for tourists and business travelers. | Bungoma Market, Bungoma Cultural Centre, Local restaurants and shops |
| Webuye | Nearby town known for its tourist sites and beautiful landscapes. Great for those looking to stay close to nature and enjoy outdoor activities. | Webuye Falls, Riverside parks, Local crafts markets |
| Mudete | A residential area with a growing presence of amenities and attractions. Suitable for longer stays with a more local experience. | Local schools, Parks and recreational areas |
| Kanduyi | A bustling suburb with easy access to Bungoma and its attractions. Good for families and tourists looking for local experiences. | Local markets, Community events |
| Chwele | Known for its rich culture and agricultural activities. Attracts those interested in experiencing local life and traditions. | Chwele Market, Cultural festivals |
| Sirisia | A rural area with access to beautiful landscapes and agricultural tours. Perfect for nature lovers and those seeking tranquility. | Scenic views, Nature walks, Agricultural tours |
| Nabuiywa | An emerging area with potential for development and tourism. Offers a quieter stay away from the busy town center. | Local community events, Nature scenery |
| Kabuchai | A vibrant community known for its friendly locals and cultural heritage. Ideal for visitors wanting to engage with local culture. | Cultural events, Traditional crafts, Local food |
Understanding Airbnb License Requirements & STR Laws in Bungoma Township ward (2025)
While Bungoma Township ward, Bungoma County, Kenya currently shows low STR regulations, specific Airbnb license requirements might still exist or change. Always verify the latest short term rental regulations and Airbnb license requirements directly with local government authorities for Bungoma Township ward to ensure full compliance before hosting.
(Source: AirROI data, 2025, finding no licensed listings among those analyzed)
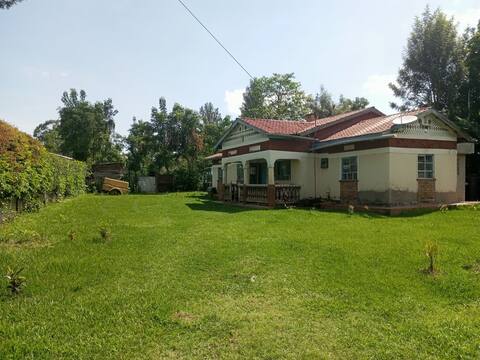
Top Performing Airbnb Properties in Bungoma Township ward (2025)
Benchmark your potential! Explore examples of top-performing Airbnb properties in Bungoma Township wardbased on Trailing Twelve Month (TTM) revenue. Analyze their characteristics, revenue, occupancy rate, and ADR to understand what drives success in this market.

Cozy Central Apartment Style
Entire Place • 2 bedrooms
Mt Elgon Cottage
Entire Place • 3 bedrooms

Wellstaycation A
Entire Place • 2 bedrooms

AriBri Apartment, Bungoma Town.
Entire Place • 2 bedrooms

Cosy Apartment in Bungoma, Pamus
Entire Place • 1 bedroom

Mt. Elgon Cottage
Entire Place • 4 bedrooms
Note: Performance varies based on location, size, amenities, seasonality, and management quality. Data reflects the past 12 months.
Top Performing Airbnb Hosts in Bungoma Township ward (2025)
Learn from the best! This table showcases top-performing Airbnb hosts in Bungoma Township ward based on the number of properties managed and estimated total revenue over the past year. Analyze their scale and performance metrics.
| Host Name | Properties | Grossing Revenue | Stay Reviews | Avg Rating |
|---|---|---|---|---|
| Host #461326852 | 2 | $5,683 | 0 | 0.00/5.0 |
| Joy | 3 | $4,905 | 13 | 1.59/5.0 |
| Host #48908629 | 1 | $3,940 | 0 | 0.00/5.0 |
| Wells | 3 | $3,187 | 16 | 3.17/5.0 |
| Haillies | 1 | $2,188 | 5 | 5.00/5.0 |
| Host #453190702 | 1 | $1,882 | 0 | 0.00/5.0 |
| Host #408850328 | 1 | $1,617 | 0 | 0.00/5.0 |
| Host #382648085 | 1 | $1,526 | 0 | 0.00/5.0 |
| Anangwe | 1 | $1,417 | 10 | 4.70/5.0 |
| Erick | 1 | $1,398 | 12 | 4.83/5.0 |
Analyzing the strategies of top hosts, such as their property selection, pricing, and guest communication, can offer valuable lessons for optimizing your own Airbnb operations in Bungoma Township ward.
Dive Deeper: Advanced Bungoma Township ward STR Market Data (2025)
Ready to unlock more insights? AirROI provides access to advanced metrics and comprehensive Airbnb data for Bungoma Township ward. Explore detailed analytics beyond this report to refine your investment strategy, optimize pricing, and maximize your vacation rental profits.
Explore Advanced MetricsBungoma Township ward Short-Term Rental Market Composition (2025): Property & Room Types
Room Type Distribution
Property Type Distribution
Market Composition Insights for Bungoma Township ward
- The Bungoma Township ward Airbnb market composition is heavily skewed towards Entire Home/Apt listings, which make up 76.2% of the 21 active rentals. This indicates strong guest preference for privacy and space.
- Looking at the property type distribution in Bungoma Township ward, Apartment/Condo properties are the most common (71.4%), reflecting the local real estate landscape.
- Houses represent a significant 19% portion, catering likely to families or larger groups.
- Smaller segments like outdoor/unique, hotel/boutique (combined 9.6%) offer potential for unique stay experiences.
Bungoma Township ward Airbnb Room Capacity Analysis (2025): Bedroom Distribution
Distribution of Listings by Number of Bedrooms
Room Capacity Insights for Bungoma Township ward
- The dominant room capacity in Bungoma Township ward is 1 bedroom listings, making up 52.4% of the market. This suggests a strong demand for properties suitable for couples or solo travelers.
- Together, 1 bedroom and 2 bedrooms properties represent 90.5% of the active Airbnb listings in Bungoma Township ward, indicating a high concentration in these sizes.
- With over half the market (52.4%) consisting of studios or 1-bedroom units, Bungoma Township ward is particularly well-suited for individuals or couples.
- Listings with 3+ bedrooms (9.6%) represent a smaller niche, potentially indicating an underserved market for larger group accommodations in Bungoma Township ward.
Bungoma Township ward Vacation Rental Guest Capacity Trends (2025)
Distribution of Listings by Guest Capacity
Guest Capacity Insights for Bungoma Township ward
- The most common guest capacity trend in Bungoma Township ward vacation rentals is listings accommodating 2 guests (47.6%). This suggests the primary traveler segment is likely couples or solo travelers.
- Properties designed for 2 guests and 4 guests dominate the Bungoma Township ward STR market, accounting for 85.7% of listings.
- A significant 52.4% of listings cater specifically to 1-2 guests, highlighting strong demand from couples and solo travelers in Bungoma Township ward.
- Listings for large groups (6+ guests) are relatively rare (4.8%), potentially indicating an opportunity for hosts targeting this segment in Bungoma Township ward.
- On average, properties in Bungoma Township ward are equipped to host 3.1 guests.
Bungoma Township ward Airbnb Booking Patterns (2025): Available vs. Booked Days
Available Days Distribution
Booked Days Distribution
Booking Pattern Insights for Bungoma Township ward
- The most common availability pattern in Bungoma Township ward falls within the 271-366 days range, representing 85.7% of listings. This suggests many properties have significant open periods on their calendars.
- Approximately 100.0% of listings show high availability (181+ days open annually), indicating potential for increased bookings or specific owner usage patterns.
- For booked days, the 31-90 days range is most frequent in Bungoma Township ward (66.7%), reflecting common guest stay durations or potential owner blocking patterns.
Bungoma Township ward Airbnb Minimum Stay Requirements Analysis
Distribution of Listings by Minimum Night Requirement
1 Night
18 listings
90% of total
2 Nights
2 listings
10% of total
Key Insights
- The most prevalent minimum stay requirement in Bungoma Township ward is 1 Night, adopted by 90% of listings. This highlights the market's preference for shorter, flexible bookings.
- A strong majority (100.0%) of the Bungoma Township ward Airbnb data shows acceptance of very short stays (1-2 nights), indicating a dynamic, high-turnover market.
Recommendations
- Align with the market by considering a 1 Night minimum stay, as 90% of Bungoma Township ward hosts use this setting.
- Adjust minimum nights based on seasonality – potentially shorter during low season and longer during peak demand periods in Bungoma Township ward.
Bungoma Township ward Airbnb Cancellation Policy Trends Analysis (2025)
Flexible
6 listings
75% of total
Moderate
2 listings
25% of total
Cancellation Policy Insights for Bungoma Township ward
- The prevailing Airbnb cancellation policy trend in Bungoma Township ward is Flexible, used by 75% of listings.
- The market strongly favors guest-friendly terms, with 100.0% of listings offering Flexible or Moderate policies. This suggests guests in Bungoma Township ward may expect booking flexibility.
Recommendations for Hosts
- Consider adopting a Flexible policy to align with the 75% market standard in Bungoma Township ward.
- Given the high prevalence of Flexible policies (75%), offering this can enhance booking appeal, especially during shoulder seasons.
- Regularly review your cancellation policy against competitors and market demand shifts in Bungoma Township ward.
Bungoma Township ward STR Booking Lead Time Analysis (2025)
Average Booking Lead Time by Month
Booking Lead Time Insights for Bungoma Township ward
- The overall average booking lead time for vacation rentals in Bungoma Township ward is 7 days.
- Guests book furthest in advance for stays during April (average 12 days), likely coinciding with peak travel demand or local events.
- The shortest booking windows occur for stays in July (average 0 days), indicating more last-minute travel plans during this time.
- Seasonally, Fall (6 days avg.) sees the longest lead times, while Winter (2 days avg.) has the shortest, reflecting typical travel planning cycles.
Recommendations for Hosts
- Use the overall average lead time (7 days) as a baseline for your pricing and availability strategy in Bungoma Township ward.
- Target marketing efforts for the Fall season well in advance (at least 6 days) to capture early planners.
- Monitor your own booking lead times against these Bungoma Township ward averages to identify opportunities for dynamic pricing adjustments.
Popular & Essential Airbnb Amenities in Bungoma Township ward (2025)
Amenity Prevalence
Amenity Insights for Bungoma Township ward
- Essential amenities in Bungoma Township ward that guests expect include: TV, Wifi, Free parking on premises, Kitchen, Essentials. Lacking these (any) could significantly impact bookings.
- Popular amenities like Hot water, Washer, Dedicated workspace are common but not universal. Offering these can provide a competitive edge.
Recommendations for Hosts
- Ensure your listing includes all essential amenities for Bungoma Township ward: TV, Wifi, Free parking on premises, Kitchen, Essentials.
- Prioritize adding missing essentials: Wifi, Free parking on premises, Kitchen, Essentials.
- Consider adding popular differentiators like Hot water or Washer to increase appeal.
- Highlight unique or less common amenities you offer (e.g., hot tub, dedicated workspace, EV charger) in your listing description and photos.
- Regularly check competitor amenities in Bungoma Township ward to stay competitive.
Bungoma Township ward Airbnb Guest Demographics & Profile Analysis (2025)
Guest Profile Summary for Bungoma Township ward
- The typical guest profile for Airbnb in Bungoma Township ward consists of a mix of domestic (58%) and international guests, often arriving from nearby Nairobi, typically belonging to the Post-2000s (Gen Z/Alpha) group (50%), primarily speaking English or Swahili.
- Domestic travelers account for 57.9% of guests.
- Key international markets include Kenya (57.9%) and United Kingdom (21.1%).
- Top languages spoken are English (64.3%) followed by Swahili (21.4%).
- A significant demographic segment is the Post-2000s (Gen Z/Alpha) group, representing 50% of guests.
Recommendations for Hosts
- Balance marketing efforts between domestic and international channels based on the guest mix.
- Tailor amenities and listing descriptions to appeal to the dominant Post-2000s (Gen Z/Alpha) demographic (e.g., highlight fast WiFi, smart home features, local guides).
- Highlight unique local experiences or amenities relevant to the primary guest profile.
- Consider seasonal promotions aligned with peak travel times for key origin markets.
Nearby Short-Term Rental Market Comparison
How does the Bungoma Township ward Airbnb market stack up against its neighbors? Compare key performance metrics like average monthly revenue, ADR, and occupancy rates in surrounding areas to understand the broader regional STR landscape.
| Market | Active Properties | Monthly Revenue | Daily Rate | Avg. Occupancy |
|---|---|---|---|---|
| Jinja | 121 | $415 | $57.19 | 23% |
| Simat/ | 27 | $371 | $69.38 | 20% |
| Kisumu | 313 | $269 | $44.83 | 23% |
| Racecourse ward | 73 | $258 | $43.98 | 21% |
| Cheptiret/Kipchamo ward | 13 | $254 | $43.33 | 22% |
| Langas ward | 14 | $250 | $45.01 | 20% |
| Kipkenyo ward | 45 | $221 | $37.78 | 22% |
| Kapsoya ward | 55 | $213 | $39.45 | 22% |
| Kitale | 33 | $212 | $35.64 | 23% |
| Kisii Central ward | 28 | $195 | $35.52 | 20% |