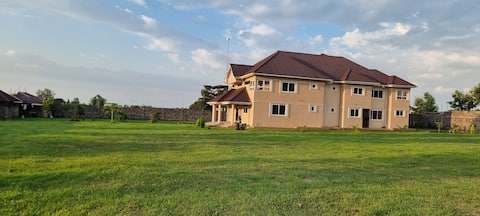
Menengai West ward Airbnb Market Analysis 2025: Short Term Rental Data & Vacation Rental Statistics in Nakuru, Kenya
Is Airbnb profitable in Menengai West ward in 2025? Explore comprehensive Airbnb analytics for Menengai West ward, Nakuru, Kenya to uncover income potential. This 2025 STR market report for Menengai West ward, based on AirROI data from May 2024 to April 2025, reveals key trends in the niche market of 25 active listings.
Whether you're considering an Airbnb investment in Menengai West ward, optimizing your existing vacation rental, or exploring rental arbitrage opportunities, understanding the Menengai West ward Airbnb data is crucial. Leveraging the low regulation environment is key to maximizing your short term rental income potential. Let's dive into the specifics.
Key Menengai West ward Airbnb Performance Metrics Overview
Monthly Airbnb Revenue Variations & Income Potential in Menengai West ward (2025)
Understanding the monthly revenue variations for Airbnb listings in Menengai West ward is key to maximizing your short term rental income potential. Seasonality significantly impacts earnings. Our analysis, based on data from the past 12 months, shows that the peak revenue month for STRs in Menengai West ward is typically June, while April often presents the lowest earnings, highlighting opportunities for strategic pricing adjustments during shoulder and low seasons. Explore the typical Airbnb income in Menengai West ward across different performance tiers:
- Best-in-class properties (Top 10%) achieve $1,862+ monthly, often utilizing dynamic pricing and superior guest experiences.
- Strong performing properties (Top 25%) earn $1,209 or more, indicating effective management and desirable locations/amenities.
- Typical properties (Median) generate around $730 per month, representing the average market performance.
- Entry-level properties (Bottom 25%) see earnings around $345, often with potential for optimization.
Average Monthly Airbnb Earnings Trend in Menengai West ward
Menengai West ward Airbnb Occupancy Rate Trends (2025)
Maximize your bookings by understanding the Menengai West ward STR occupancy trends. Seasonal demand shifts significantly influence how often properties are booked. Typically, Maysees the highest demand (peak season occupancy), while September experiences the lowest (low season). Effective strategies, like adjusting minimum stays or offering promotions, can boost occupancy during slower periods. Here's how different property tiers perform in Menengai West ward:
- Best-in-class properties (Top 10%) achieve 47%+ occupancy, indicating high desirability and potentially optimized availability.
- Strong performing properties (Top 25%) maintain 36% or higher occupancy, suggesting good market fit and guest satisfaction.
- Typical properties (Median) have an occupancy rate around 16%.
- Entry-level properties (Bottom 25%) average 8% occupancy, potentially facing higher vacancy.
Average Monthly Occupancy Rate Trend in Menengai West ward
Average Daily Rate (ADR) Airbnb Trends in Menengai West ward (2025)
Effective short term rental pricing strategy in Menengai West ward involves understanding monthly ADR fluctuations. The Average Daily Rate (ADR) for Airbnb in Menengai West ward typically peaks in December and dips lowest during November. Leveraging Airbnb dynamic pricing tools or strategies based on this seasonality can significantly boost revenue. Here's a look at the typical nightly rates achieved:
- Best-in-class properties (Top 10%) command rates of $98+ per night, often due to premium features or locations.
- Strong performing properties (Top 25%) achieve nightly rates of $54 or more.
- Typical properties (Median) charge around $36 per night.
- Entry-level properties (Bottom 25%) earn around $23 per night.
Average Daily Rate (ADR) Trend by Month in Menengai West ward
Get Live Menengai West ward Market Intelligence 👇

Explore Real-time Analytics
Airbnb Seasonality Analysis & Trends in Menengai West ward (2025)
Peak Season (June, May, November)
- Revenue averages $1,317 per month
- Occupancy rates average 30.4%
- Daily rates average $46
Shoulder Season
- Revenue averages $858 per month
- Occupancy maintains around 21.6%
- Daily rates hold near $48
Low Season (January, February, April)
- Revenue drops to average $409 per month
- Occupancy decreases to average 20.6%
- Daily rates adjust to average $49
Seasonality Insights for Menengai West ward
- The Airbnb seasonality in Menengai West ward shows highly seasonal trends requiring careful strategy. While the sections above show seasonal averages, it's also insightful to look at the extremes:
- During the high season, the absolute peak month showcases Menengai West ward's highest earning potential, with monthly revenues capable of climbing to $1,377, occupancy reaching a high of 48.9%, and ADRs peaking at $50.
- Conversely, the slowest single month of the year, typically falling within the low season, marks the market's lowest point. In this month, revenue might dip to $369, occupancy could drop to 9.3%, and ADRs may adjust down to $46.
- Understanding both the seasonal averages and these monthly peaks and troughs in revenue, occupancy, and ADR is crucial for maximizing your Airbnb profit potential in Menengai West ward.
Seasonal Strategies for Maximizing Profit
- Peak Season: Maximize revenue through premium pricing and potentially longer minimum stays. Ensure high availability.
- Low Season: Offer competitive pricing, special promotions (e.g., extended stay discounts), and flexible cancellation policies. Target off-season travelers like remote workers or budget-conscious guests.
- Shoulder Seasons: Implement dynamic pricing that balances peak and low rates. Target weekend travelers or specific events. Offer slightly more flexible terms than peak season.
- Regularly analyze your own performance against these Menengai West ward seasonality benchmarks and adjust your pricing and availability strategy accordingly.
Best Areas for Airbnb Investment in Menengai West ward (2025)
Exploring the top neighborhoods for short-term rentals in Menengai West ward? This section highlights key areas, outlining why they are attractive for hosts and guests, along with notable local attractions. Consider these locations based on your target guest profile and investment strategy.
| Neighborhood / Area | Why Host Here? (Target Guests & Appeal) | Key Attractions & Landmarks |
|---|---|---|
| Nakuru National Park | A stunning wildlife reserve home to diverse flora and fauna, ideal for eco-tourism. It attracts visitors who want to experience nature and view the wildlife up close. | Lake Nakuru, Flamingo nesting sites, Baboon cliff, Nakuru Eco Park, Wildlife safaris |
| Menengai Crater | An iconic geological feature that offers breathtaking views and hiking opportunities. Popular among nature lovers and adventure tourists seeking unique experiences. | Menengai Crater viewpoints, Hiking trails, Local cultural tours, Photography spots, Nature walks |
| Lake Nakuru | Part of the National Park, known for its beautiful scenery and bird watching, particularly flamingos. Great for travelers looking for serene natural escapes. | Bird watching, Scenic viewpoints, Boat tours, Picnic sites, Nature photography |
| Nakuru Town | The bustling town center offers diverse amenities and nightlife, attracting both business travelers and tourists exploring the region. Convenient access to services and attractions. | Kenya Industrial Estate, Nakuru Farmers' Market, Local restaurants, Cultural heritage sites, Shopping centers |
| Olenguruone | A serene rural area known for its beautiful landscapes and cultural experiences. Attracts visitors looking for peace and authenticity away from the urban hustle. | Cultural village tours, Scenic walks, Nature exploration, Local crafts markets, Community events |
| Bahati | An emerging suburban area that is attracting investment. It's becoming popular for those looking for a quiet location close to Nakuru with a growing local economy. | Local farms, Craft markets, Family-friendly parks, Community activities, Outdoor recreation |
| Mau Narok | Located near the famous Mau Forest, offering eco-tourism opportunities and majestic nature views. Ideal for nature enthusiasts and conservationists. | Mau Forest trails, Bird watching, Cultural experiences with the indigenous communities, Eco-lodges, Nature photography |
| Kapsowar | A rural area that serves as a gateway to various tourist attractions in the region. Popular for visitors looking for adventure and authentic local experiences. | Hiking trails, Village experiences, Cultural interactions, Nature walks, Scenic landscapes |
Understanding Airbnb License Requirements & STR Laws in Menengai West ward (2025)
While Menengai West ward, Nakuru, Kenya currently shows low STR regulations, specific Airbnb license requirements might still exist or change. Always verify the latest short term rental regulations and Airbnb license requirements directly with local government authorities for Menengai West ward to ensure full compliance before hosting.
(Source: AirROI data, 2025, finding no licensed listings among those analyzed)
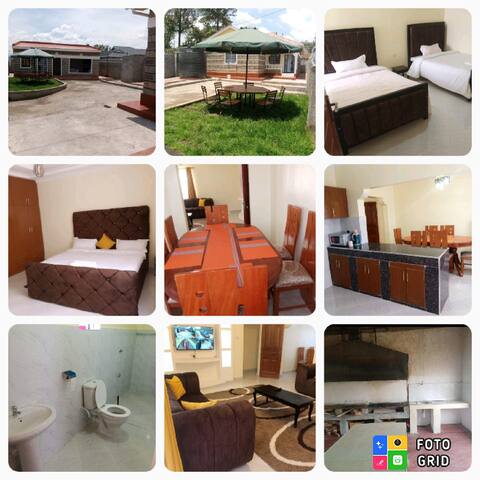
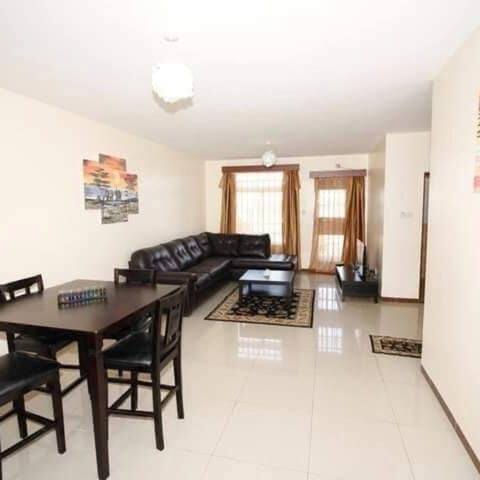
Top Performing Airbnb Properties in Menengai West ward (2025)
Benchmark your potential! Explore examples of top-performing Airbnb properties in Menengai West wardbased on Trailing Twelve Month (TTM) revenue. Analyze their characteristics, revenue, occupancy rate, and ADR to understand what drives success in this market.

Sheerdrop : Idyllic country home in Nakuru
Entire Place • 4 bedrooms
Casa Nadreya Nakuru: 4 bedroom
Entire Place • 4 bedrooms

Luxurious 3 Bedroom Home Nakuru
Entire Place • 3 bedrooms
modern cosy home for families gateaway
Entire Place • 3 bedrooms
Apartment L12 Haute Suites
Entire Place • 3 bedrooms

Modern 3 bedroom country villa in Nakuru
Entire Place • 3 bedrooms
Note: Performance varies based on location, size, amenities, seasonality, and management quality. Data reflects the past 12 months.
Top Performing Airbnb Hosts in Menengai West ward (2025)
Learn from the best! This table showcases top-performing Airbnb hosts in Menengai West ward based on the number of properties managed and estimated total revenue over the past year. Analyze their scale and performance metrics.
| Host Name | Properties | Grossing Revenue | Stay Reviews | Avg Rating |
|---|---|---|---|---|
| Beatrice | 2 | $13,567 | 5 | 2.50/5.0 |
| Grace Kinya | 1 | $11,184 | 69 | 4.97/5.0 |
| Host #226279768 | 1 | $7,032 | 0 | 0.00/5.0 |
| Host #485806579 | 1 | $4,537 | 0 | 0.00/5.0 |
| Host #488241474 | 1 | $4,469 | 0 | 0.00/5.0 |
| Host #480686622 | 1 | $3,834 | 0 | 0.00/5.0 |
| Host #208693418 | 1 | $3,653 | 0 | 0.00/5.0 |
| Host #209009323 | 2 | $3,651 | 0 | 0.00/5.0 |
| Host #97123835 | 1 | $3,581 | 0 | 0.00/5.0 |
| Host #456436321 | 1 | $2,904 | 0 | 0.00/5.0 |
Analyzing the strategies of top hosts, such as their property selection, pricing, and guest communication, can offer valuable lessons for optimizing your own Airbnb operations in Menengai West ward.
Dive Deeper: Advanced Menengai West ward STR Market Data (2025)
Ready to unlock more insights? AirROI provides access to advanced metrics and comprehensive Airbnb data for Menengai West ward. Explore detailed analytics beyond this report to refine your investment strategy, optimize pricing, and maximize your vacation rental profits.
Explore Advanced MetricsMenengai West ward Short-Term Rental Market Composition (2025): Property & Room Types
Room Type Distribution
Property Type Distribution
Market Composition Insights for Menengai West ward
- The Menengai West ward Airbnb market composition is heavily skewed towards Entire Home/Apt listings, which make up 92% of the 25 active rentals. This indicates strong guest preference for privacy and space.
- Looking at the property type distribution in Menengai West ward, Apartment/Condo properties are the most common (60%), reflecting the local real estate landscape.
- Houses represent a significant 32% portion, catering likely to families or larger groups.
- The presence of 8% Hotel/Boutique listings indicates integration with traditional hospitality.
Menengai West ward Airbnb Room Capacity Analysis (2025): Bedroom Distribution
Distribution of Listings by Number of Bedrooms
Room Capacity Insights for Menengai West ward
- The dominant room capacity in Menengai West ward is 1 bedroom listings, making up 32% of the market. This suggests a strong demand for properties suitable for couples or solo travelers.
- Together, 1 bedroom and 3 bedrooms properties represent 64.0% of the active Airbnb listings in Menengai West ward, indicating a high concentration in these sizes.
- A significant 40.0% of listings offer 3+ bedrooms, catering to larger groups and families seeking more space in Menengai West ward.
Menengai West ward Vacation Rental Guest Capacity Trends (2025)
Distribution of Listings by Guest Capacity
Guest Capacity Insights for Menengai West ward
- The most common guest capacity trend in Menengai West ward vacation rentals is listings accommodating 4 guests (36%). This suggests the primary traveler segment is likely small families or groups.
- Properties designed for 4 guests and 6 guests dominate the Menengai West ward STR market, accounting for 56.0% of listings.
- 28.0% of properties accommodate 6+ guests, serving the market segment for larger families or group travel in Menengai West ward.
- On average, properties in Menengai West ward are equipped to host 4.4 guests.
Menengai West ward Airbnb Booking Patterns (2025): Available vs. Booked Days
Available Days Distribution
Booked Days Distribution
Booking Pattern Insights for Menengai West ward
- The most common availability pattern in Menengai West ward falls within the 271-366 days range, representing 96% of listings. This suggests many properties have significant open periods on their calendars.
- Approximately 100.0% of listings show high availability (181+ days open annually), indicating potential for increased bookings or specific owner usage patterns.
- For booked days, the 31-90 days range is most frequent in Menengai West ward (76%), reflecting common guest stay durations or potential owner blocking patterns.
Menengai West ward Airbnb Minimum Stay Requirements Analysis
Distribution of Listings by Minimum Night Requirement
1 Night
22 listings
95.7% of total
30+ Nights
1 listings
4.3% of total
Key Insights
- The most prevalent minimum stay requirement in Menengai West ward is 1 Night, adopted by 95.7% of listings. This highlights the market's preference for shorter, flexible bookings.
- A strong majority (95.7%) of the Menengai West ward Airbnb data shows acceptance of very short stays (1-2 nights), indicating a dynamic, high-turnover market.
Recommendations
- Align with the market by considering a 1 Night minimum stay, as 95.7% of Menengai West ward hosts use this setting.
- Adjust minimum nights based on seasonality – potentially shorter during low season and longer during peak demand periods in Menengai West ward.
Menengai West ward Airbnb Cancellation Policy Trends Analysis (2025)
Flexible
6 listings
66.7% of total
Moderate
1 listings
11.1% of total
Strict
2 listings
22.2% of total
Cancellation Policy Insights for Menengai West ward
- The prevailing Airbnb cancellation policy trend in Menengai West ward is Flexible, used by 66.7% of listings.
- The market strongly favors guest-friendly terms, with 77.8% of listings offering Flexible or Moderate policies. This suggests guests in Menengai West ward may expect booking flexibility.
Recommendations for Hosts
- Consider adopting a Flexible policy to align with the 66.7% market standard in Menengai West ward.
- Given the high prevalence of Flexible policies (66.7%), offering this can enhance booking appeal, especially during shoulder seasons.
- Regularly review your cancellation policy against competitors and market demand shifts in Menengai West ward.
Menengai West ward STR Booking Lead Time Analysis (2025)
Average Booking Lead Time by Month
Booking Lead Time Insights for Menengai West ward
- The overall average booking lead time for vacation rentals in Menengai West ward is 23 days.
- Guests book furthest in advance for stays during May (average 122 days), likely coinciding with peak travel demand or local events.
- The shortest booking windows occur for stays in March (average 4 days), indicating more last-minute travel plans during this time.
- Seasonally, Spring (45 days avg.) sees the longest lead times, while Winter (18 days avg.) has the shortest, reflecting typical travel planning cycles.
Recommendations for Hosts
- Use the overall average lead time (23 days) as a baseline for your pricing and availability strategy in Menengai West ward.
- For May stays, consider implementing length-of-stay discounts or slightly higher rates for bookings made less than 122 days out to capitalize on advance planning.
- During March, focus on last-minute booking availability and promotions, as guests book with very short notice (4 days avg.).
- Target marketing efforts for the Spring season well in advance (at least 45 days) to capture early planners.
- Monitor your own booking lead times against these Menengai West ward averages to identify opportunities for dynamic pricing adjustments.
Popular & Essential Airbnb Amenities in Menengai West ward (2025)
Amenity Prevalence
Amenity Insights for Menengai West ward
- Essential amenities in Menengai West ward that guests expect include: Wifi, Kitchen, Hot water, TV, Essentials, Free parking on premises. Lacking these (any) could significantly impact bookings.
- Popular amenities like Dryer, Air conditioning, Dedicated workspace are common but not universal. Offering these can provide a competitive edge.
Recommendations for Hosts
- Ensure your listing includes all essential amenities for Menengai West ward: Wifi, Kitchen, Hot water, TV, Essentials, Free parking on premises.
- Prioritize adding missing essentials: Essentials, Free parking on premises.
- Consider adding popular differentiators like Dryer or Air conditioning to increase appeal.
- Highlight unique or less common amenities you offer (e.g., hot tub, dedicated workspace, EV charger) in your listing description and photos.
- Regularly check competitor amenities in Menengai West ward to stay competitive.
Menengai West ward Airbnb Guest Demographics & Profile Analysis (2025)
Guest Profile Summary for Menengai West ward
- The typical guest profile for Airbnb in Menengai West ward consists of a mix of domestic (58%) and international guests, often arriving from nearby Nairobi, typically belonging to the Post-2000s (Gen Z/Alpha) group (50%), primarily speaking English or Swahili.
- Domestic travelers account for 57.9% of guests.
- Key international markets include Kenya (57.9%) and United States (10.5%).
- Top languages spoken are English (60%) followed by Swahili (26.7%).
- A significant demographic segment is the Post-2000s (Gen Z/Alpha) group, representing 50% of guests.
Recommendations for Hosts
- Balance marketing efforts between domestic and international channels based on the guest mix.
- Tailor amenities and listing descriptions to appeal to the dominant Post-2000s (Gen Z/Alpha) demographic (e.g., highlight fast WiFi, smart home features, local guides).
- Highlight unique local experiences or amenities relevant to the primary guest profile.
- Consider seasonal promotions aligned with peak travel times for key origin markets.
Nearby Short-Term Rental Market Comparison
How does the Menengai West ward Airbnb market stack up against its neighbors? Compare key performance metrics like average monthly revenue, ADR, and occupancy rates in surrounding areas to understand the broader regional STR landscape.
| Market | Active Properties | Monthly Revenue | Daily Rate | Avg. Occupancy |
|---|---|---|---|---|
| Naro Moru | 19 | $2,009 | $326.90 | 25% |
| Ewuaso Oonkidong'i ward | 14 | $1,897 | $177.50 | 28% |
| Olkaria ward | 42 | $1,592 | $162.67 | 31% |
| Malewa West ward | 45 | $1,416 | $195.51 | 24% |
| Keekonyokie ward | 23 | $1,369 | $152.03 | 29% |
| Ngecha Tigoni ward | 10 | $1,188 | $134.89 | 28% |
| Kapkures ward | 11 | $1,038 | $111.18 | 28% |
| Hells Gate ward | 44 | $949 | $130.73 | 23% |
| Maiella ward | 13 | $927 | $144.80 | 23% |
| Siana ward | 22 | $862 | $182.06 | 20% |