Luang Prabang Airbnb Market Analysis 2025: Short Term Rental Data & Vacation Rental Statistics in Luang Prabang, Laos
Is Airbnb profitable in Luang Prabang in 2025? Explore comprehensive Airbnb analytics for Luang Prabang, Luang Prabang, Laos to uncover income potential. This 2025 STR market report for Luang Prabang, based on AirROI data from May 2024 to April 2025, reveals key trends in the niche market of 72 active listings.
Whether you're considering an Airbnb investment in Luang Prabang, optimizing your existing vacation rental, or exploring rental arbitrage opportunities, understanding the Luang Prabang Airbnb data is crucial. Leveraging the low regulation environment is key to maximizing your short term rental income potential. Let's dive into the specifics.
Key Luang Prabang Airbnb Performance Metrics Overview
Monthly Airbnb Revenue Variations & Income Potential in Luang Prabang (2025)
Understanding the monthly revenue variations for Airbnb listings in Luang Prabang is key to maximizing your short term rental income potential. Seasonality significantly impacts earnings. Our analysis, based on data from the past 12 months, shows that the peak revenue month for STRs in Luang Prabang is typically December, while April often presents the lowest earnings, highlighting opportunities for strategic pricing adjustments during shoulder and low seasons. Explore the typical Airbnb income in Luang Prabang across different performance tiers:
- Best-in-class properties (Top 10%) achieve $1,497+ monthly, often utilizing dynamic pricing and superior guest experiences.
- Strong performing properties (Top 25%) earn $976 or more, indicating effective management and desirable locations/amenities.
- Typical properties (Median) generate around $415 per month, representing the average market performance.
- Entry-level properties (Bottom 25%) see earnings around $201, often with potential for optimization.
Average Monthly Airbnb Earnings Trend in Luang Prabang
Luang Prabang Airbnb Occupancy Rate Trends (2025)
Maximize your bookings by understanding the Luang Prabang STR occupancy trends. Seasonal demand shifts significantly influence how often properties are booked. Typically, Decembersees the highest demand (peak season occupancy), while June experiences the lowest (low season). Effective strategies, like adjusting minimum stays or offering promotions, can boost occupancy during slower periods. Here's how different property tiers perform in Luang Prabang:
- Best-in-class properties (Top 10%) achieve 66%+ occupancy, indicating high desirability and potentially optimized availability.
- Strong performing properties (Top 25%) maintain 50% or higher occupancy, suggesting good market fit and guest satisfaction.
- Typical properties (Median) have an occupancy rate around 29%.
- Entry-level properties (Bottom 25%) average 15% occupancy, potentially facing higher vacancy.
Average Monthly Occupancy Rate Trend in Luang Prabang
Average Daily Rate (ADR) Airbnb Trends in Luang Prabang (2025)
Effective short term rental pricing strategy in Luang Prabang involves understanding monthly ADR fluctuations. The Average Daily Rate (ADR) for Airbnb in Luang Prabang typically peaks in December and dips lowest during April. Leveraging Airbnb dynamic pricing tools or strategies based on this seasonality can significantly boost revenue. Here's a look at the typical nightly rates achieved:
- Best-in-class properties (Top 10%) command rates of $108+ per night, often due to premium features or locations.
- Strong performing properties (Top 25%) achieve nightly rates of $67 or more.
- Typical properties (Median) charge around $41 per night.
- Entry-level properties (Bottom 25%) earn around $28 per night.
Average Daily Rate (ADR) Trend by Month in Luang Prabang
Get Live Luang Prabang Market Intelligence 👇

Explore Real-time Analytics
Airbnb Seasonality Analysis & Trends in Luang Prabang (2025)
Peak Season (December, November, January)
- Revenue averages $950 per month
- Occupancy rates average 46.5%
- Daily rates average $73
Shoulder Season
- Revenue averages $661 per month
- Occupancy maintains around 31.0%
- Daily rates hold near $68
Low Season (March, April, August)
- Revenue drops to average $429 per month
- Occupancy decreases to average 24.8%
- Daily rates adjust to average $60
Seasonality Insights for Luang Prabang
- The Airbnb seasonality in Luang Prabang shows highly seasonal trends requiring careful strategy. While the sections above show seasonal averages, it's also insightful to look at the extremes:
- During the high season, the absolute peak month showcases Luang Prabang's highest earning potential, with monthly revenues capable of climbing to $1,058, occupancy reaching a high of 47.4%, and ADRs peaking at $83.
- Conversely, the slowest single month of the year, typically falling within the low season, marks the market's lowest point. In this month, revenue might dip to $386, occupancy could drop to 21.0%, and ADRs may adjust down to $56.
- Understanding both the seasonal averages and these monthly peaks and troughs in revenue, occupancy, and ADR is crucial for maximizing your Airbnb profit potential in Luang Prabang.
Seasonal Strategies for Maximizing Profit
- Peak Season: Maximize revenue through premium pricing and potentially longer minimum stays. Ensure high availability.
- Low Season: Offer competitive pricing, special promotions (e.g., extended stay discounts), and flexible cancellation policies. Target off-season travelers like remote workers or budget-conscious guests.
- Shoulder Seasons: Implement dynamic pricing that balances peak and low rates. Target weekend travelers or specific events. Offer slightly more flexible terms than peak season.
- Regularly analyze your own performance against these Luang Prabang seasonality benchmarks and adjust your pricing and availability strategy accordingly.
Best Areas for Airbnb Investment in Luang Prabang (2025)
Exploring the top neighborhoods for short-term rentals in Luang Prabang? This section highlights key areas, outlining why they are attractive for hosts and guests, along with notable local attractions. Consider these locations based on your target guest profile and investment strategy.
| Neighborhood / Area | Why Host Here? (Target Guests & Appeal) | Key Attractions & Landmarks |
|---|---|---|
| Old Quarter | The historic heart of Luang Prabang, known for its well-preserved architecture and culture. This area attracts tourists seeking authentic experiences and easy access to important temples. | Wat Xieng Thong, Night Market, Royal Palace Museum, Mount Phousi, Mekong River, Traditional Arts and Ethnology Centre |
| Ban Phonsavan | A beautiful riverside village that offers stunning views and a tranquil atmosphere. It's ideal for travelers looking to escape the city and enjoy nature and local culture. | Khouangsi Waterfall, Pak Ou Caves, Ban Phonsavan market, Local villages, Mekong boat tours |
| Mount Phousi | Located in the center of Luang Prabang, it is a popular spot for tourists looking to hike and enjoy panoramic views of the city. Investors can benefit from the high foot traffic from tourists. | Stupa on Mount Phousi, Sunset views, Nearby cafes, Souvenir shops |
| Talat Sao (Morning Market) | Known for its vibrant market life, this area is key for food lovers and locals alike. Suitable for hosting tourists who want to explore local foods and crafts. | Local food stalls, Handicrafts, Cultural experiences |
| Wat Mai | Famous for its stunning architecture and proximity to the Mekong River, this area has historical significance and attracts many visitors interested in spirituality and local culture. | Wat Mai Suwannaphumaham, Nearby cafes, Mekong River activities |
| Ban Chan | A traditional pottery village just across the river from Luang Prabang, offering tourists a chance to participate in local crafts and activities, enhancing the cultural experience. | Pottery workshops, River views, Cultural exchanges |
| Phu Si Hill | A sacred hill with a significant historical background, it's a must-visit for tourists looking for adventure and reflection. | Temples along the way, Buddha statues, Viewpoints, Cultural significance |
| Khouangsi Waterfall area | A stunning natural attraction located a short drive from Luang Prabang, perfect for travelers seeking adventure in nature and outdoor activities. | Khouangsi Waterfall, Swimming areas, Nature trails, Eco-tourism opportunities |
Understanding Airbnb License Requirements & STR Laws in Luang Prabang (2025)
While Luang Prabang, Luang Prabang, Laos currently shows low STR regulations, specific Airbnb license requirements might still exist or change. Always verify the latest short term rental regulations and Airbnb license requirements directly with local government authorities for Luang Prabang to ensure full compliance before hosting.
(Source: AirROI data, 2025, finding no licensed listings among those analyzed)
Top Performing Airbnb Properties in Luang Prabang (2025)
Benchmark your potential! Explore examples of top-performing Airbnb properties in Luang Prabangbased on Trailing Twelve Month (TTM) revenue. Analyze their characteristics, revenue, occupancy rate, and ADR to understand what drives success in this market.

Peninsula Private House
Entire Place • 2 bedrooms

The Namkhan, Sunset Luang Prabang Villa
Entire Place • 2 bedrooms

Villa Visoun -Namkhan Riverview Private Pool Villa
Entire Place • 2 bedrooms

The peninsula Verandah suite
Entire Place • 1 bedroom
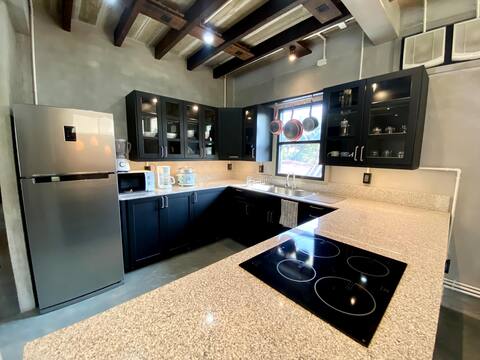
Modern Comfort, Huge Kitchen, Laundry, Kids Toys!
Entire Place • 2 bedrooms
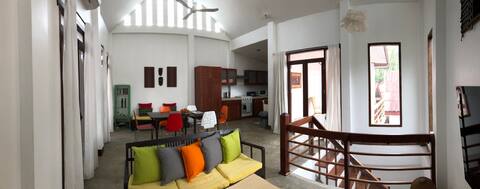
Spacious, central, family-friendly home
Entire Place • 2 bedrooms
Note: Performance varies based on location, size, amenities, seasonality, and management quality. Data reflects the past 12 months.
Top Performing Airbnb Hosts in Luang Prabang (2025)
Learn from the best! This table showcases top-performing Airbnb hosts in Luang Prabang based on the number of properties managed and estimated total revenue over the past year. Analyze their scale and performance metrics.
| Host Name | Properties | Grossing Revenue | Stay Reviews | Avg Rating |
|---|---|---|---|---|
| Souliya | 6 | $85,182 | 211 | 4.14/5.0 |
| The Namkhan | 3 | $42,811 | 8 | 3.20/5.0 |
| Jimmy | 8 | $23,303 | 363 | 4.70/5.0 |
| Eric | 1 | $23,238 | 19 | 5.00/5.0 |
| Bradley | 1 | $19,013 | 57 | 4.89/5.0 |
| Tara | 1 | $17,536 | 129 | 4.88/5.0 |
| Maddie | 1 | $15,695 | 25 | 5.00/5.0 |
| Mark | 1 | $14,719 | 15 | 4.73/5.0 |
| Christine | 1 | $14,607 | 18 | 5.00/5.0 |
| Erich | 1 | $12,785 | 79 | 4.81/5.0 |
Analyzing the strategies of top hosts, such as their property selection, pricing, and guest communication, can offer valuable lessons for optimizing your own Airbnb operations in Luang Prabang.
Dive Deeper: Advanced Luang Prabang STR Market Data (2025)
Ready to unlock more insights? AirROI provides access to advanced metrics and comprehensive Airbnb data for Luang Prabang. Explore detailed analytics beyond this report to refine your investment strategy, optimize pricing, and maximize your vacation rental profits.
Explore Advanced MetricsLuang Prabang Short-Term Rental Market Composition (2025): Property & Room Types
Room Type Distribution
Property Type Distribution
Market Composition Insights for Luang Prabang
- The Luang Prabang Airbnb market composition is heavily skewed towards Entire Home/Apt listings, which make up 48.6% of the 72 active rentals. This indicates strong guest preference for privacy and space.
- However, a notable 45.8% share for Private Rooms suggests opportunities for budget-conscious travelers or hosts renting out spare rooms.
- Looking at the property type distribution in Luang Prabang, House properties are the most common (38.9%), reflecting the local real estate landscape.
- Houses represent a significant 38.9% portion, catering likely to families or larger groups.
- The presence of 36.1% Hotel/Boutique listings indicates integration with traditional hospitality.
- Smaller segments like outdoor/unique, others (combined 5.6%) offer potential for unique stay experiences.
Luang Prabang Airbnb Room Capacity Analysis (2025): Bedroom Distribution
Distribution of Listings by Number of Bedrooms
Room Capacity Insights for Luang Prabang
- The dominant room capacity in Luang Prabang is 1 bedroom listings, making up 56.9% of the market. This suggests a strong demand for properties suitable for couples or solo travelers.
- Together, 1 bedroom and 2 bedrooms properties represent 81.9% of the active Airbnb listings in Luang Prabang, indicating a high concentration in these sizes.
- With over half the market (56.9%) consisting of studios or 1-bedroom units, Luang Prabang is particularly well-suited for individuals or couples.
- Listings with 3+ bedrooms (9.7%) represent a smaller niche, potentially indicating an underserved market for larger group accommodations in Luang Prabang.
Luang Prabang Vacation Rental Guest Capacity Trends (2025)
Distribution of Listings by Guest Capacity
Guest Capacity Insights for Luang Prabang
- The most common guest capacity trend in Luang Prabang vacation rentals is listings accommodating 2 guests (56.9%). This suggests the primary traveler segment is likely couples or solo travelers.
- Properties designed for 2 guests and 4 guests dominate the Luang Prabang STR market, accounting for 73.6% of listings.
- A significant 59.7% of listings cater specifically to 1-2 guests, highlighting strong demand from couples and solo travelers in Luang Prabang.
- On average, properties in Luang Prabang are equipped to host 2.6 guests.
Luang Prabang Airbnb Booking Patterns (2025): Available vs. Booked Days
Available Days Distribution
Booked Days Distribution
Booking Pattern Insights for Luang Prabang
- The most common availability pattern in Luang Prabang falls within the 271-366 days range, representing 61.1% of listings. This suggests many properties have significant open periods on their calendars.
- Approximately 88.9% of listings show high availability (181+ days open annually), indicating potential for increased bookings or specific owner usage patterns.
- For booked days, the 31-90 days range is most frequent in Luang Prabang (37.5%), reflecting common guest stay durations or potential owner blocking patterns.
- A notable 11.1% of properties secure long booking periods (181+ days booked per year), highlighting successful long-term rental strategies or significant owner usage.
Luang Prabang Airbnb Minimum Stay Requirements Analysis
Distribution of Listings by Minimum Night Requirement
1 Night
52 listings
74.3% of total
2 Nights
11 listings
15.7% of total
3 Nights
2 listings
2.9% of total
4-6 Nights
1 listings
1.4% of total
30+ Nights
4 listings
5.7% of total
Key Insights
- The most prevalent minimum stay requirement in Luang Prabang is 1 Night, adopted by 74.3% of listings. This highlights the market's preference for shorter, flexible bookings.
- A strong majority (90.0%) of the Luang Prabang Airbnb data shows acceptance of very short stays (1-2 nights), indicating a dynamic, high-turnover market.
Recommendations
- Align with the market by considering a 1 Night minimum stay, as 74.3% of Luang Prabang hosts use this setting.
- Explore offering discounts for stays of 30+ nights to attract the 5.7% of the market seeking extended stays.
- Adjust minimum nights based on seasonality – potentially shorter during low season and longer during peak demand periods in Luang Prabang.
Luang Prabang Airbnb Cancellation Policy Trends Analysis (2025)
Flexible
15 listings
26.3% of total
Moderate
20 listings
35.1% of total
Firm
18 listings
31.6% of total
Strict
4 listings
7% of total
Cancellation Policy Insights for Luang Prabang
- The prevailing Airbnb cancellation policy trend in Luang Prabang is Moderate, used by 35.1% of listings.
- There's a relatively balanced mix between guest-friendly (61.4%) and stricter (38.6%) policies, offering choices for different guest needs.
- Strict cancellation policies are quite rare (7%), potentially making listings with this policy less competitive unless justified by high demand or property type.
Recommendations for Hosts
- Consider adopting a Moderate policy to align with the 35.1% market standard in Luang Prabang.
- Using a Strict policy might deter some guests, as only 7% of listings use it. Evaluate if potential revenue protection outweighs possible lower booking rates.
- Regularly review your cancellation policy against competitors and market demand shifts in Luang Prabang.
Luang Prabang STR Booking Lead Time Analysis (2025)
Average Booking Lead Time by Month
Booking Lead Time Insights for Luang Prabang
- The overall average booking lead time for vacation rentals in Luang Prabang is 41 days.
- Guests book furthest in advance for stays during November (average 70 days), likely coinciding with peak travel demand or local events.
- The shortest booking windows occur for stays in August (average 19 days), indicating more last-minute travel plans during this time.
- Seasonally, Fall (56 days avg.) sees the longest lead times, while Spring (30 days avg.) has the shortest, reflecting typical travel planning cycles.
Recommendations for Hosts
- Use the overall average lead time (41 days) as a baseline for your pricing and availability strategy in Luang Prabang.
- For November stays, consider implementing length-of-stay discounts or slightly higher rates for bookings made less than 70 days out to capitalize on advance planning.
- Target marketing efforts for the Fall season well in advance (at least 56 days) to capture early planners.
- Monitor your own booking lead times against these Luang Prabang averages to identify opportunities for dynamic pricing adjustments.
Popular & Essential Airbnb Amenities in Luang Prabang (2025)
Amenity Prevalence
Amenity Insights for Luang Prabang
- Essential amenities in Luang Prabang that guests expect include: Wifi, Air conditioning. Lacking these (any) could significantly impact bookings.
- Popular amenities like Essentials, Hair dryer, Hot water are common but not universal. Offering these can provide a competitive edge.
Recommendations for Hosts
- Ensure your listing includes all essential amenities for Luang Prabang: Wifi, Air conditioning.
- Consider adding popular differentiators like Essentials or Hair dryer to increase appeal.
- Highlight unique or less common amenities you offer (e.g., hot tub, dedicated workspace, EV charger) in your listing description and photos.
- Regularly check competitor amenities in Luang Prabang to stay competitive.
Luang Prabang Airbnb Guest Demographics & Profile Analysis (2025)
Guest Profile Summary for Luang Prabang
- The typical guest profile for Airbnb in Luang Prabang consists of predominantly international visitors (99%), with top international origins including United Kingdom, typically belonging to the Post-2000s (Gen Z/Alpha) group (50%), primarily speaking English or French.
- Domestic travelers account for 0.7% of guests.
- Key international markets include United States (25.1%) and United Kingdom (9.2%).
- Top languages spoken are English (48.3%) followed by French (10.8%).
- A significant demographic segment is the Post-2000s (Gen Z/Alpha) group, representing 50% of guests.
Recommendations for Hosts
- Focus marketing internationally, particularly towards travelers from United Kingdom.
- Tailor amenities and listing descriptions to appeal to the dominant Post-2000s (Gen Z/Alpha) demographic (e.g., highlight fast WiFi, smart home features, local guides).
- Highlight unique local experiences or amenities relevant to the primary guest profile.
- Consider seasonal promotions aligned with peak travel times for key origin markets.
Nearby Short-Term Rental Market Comparison
How does the Luang Prabang Airbnb market stack up against its neighbors? Compare key performance metrics like average monthly revenue, ADR, and occupancy rates in surrounding areas to understand the broader regional STR landscape.
| Market | Active Properties | Monthly Revenue | Daily Rate | Avg. Occupancy |
|---|---|---|---|---|
| Khoy | 13 | $507 | $118.68 | 22% |
| Vang Vieng | 18 | $129 | $26.63 | 22% |