Pāvilosta Airbnb Market Analysis 2026: Short Term Rental Data & Vacation Rental Statistics in Courland, Latvia
Is Airbnb profitable in Pāvilosta in 2026? Explore comprehensive Airbnb analytics for Pāvilosta, Courland, Latvia to uncover income potential. This 2026 STR market report for Pāvilosta, based on AirROI data from February 2025 to January 2026, reveals key trends in the niche market of 28 active listings.
Whether you're considering an Airbnb investment in Pāvilosta, optimizing your existing vacation rental, or exploring rental arbitrage opportunities, understanding the Pāvilosta Airbnb data is crucial. Leveraging the low regulation environment is key to maximizing your short term rental income potential. Let's dive into the specifics.
Key Pāvilosta Airbnb Performance Metrics Overview
Monthly Airbnb Revenue Variations & Income Potential in Pāvilosta (2026)
Understanding the monthly revenue variations for Airbnb listings in Pāvilosta is key to maximizing your short term rental income potential. Seasonality significantly impacts earnings. Our analysis, based on data from the past 12 months, shows that the peak revenue month for STRs in Pāvilosta is typically July, while April often presents the lowest earnings, highlighting opportunities for strategic pricing adjustments during shoulder and low seasons. Explore the typical Airbnb income in Pāvilosta across different performance tiers:
- Best-in-class properties (Top 10%) achieve $1,895+ monthly, often utilizing dynamic pricing and superior guest experiences.
- Strong performing properties (Top 25%) earn $1,233 or more, indicating effective management and desirable locations/amenities.
- Typical properties (Median) generate around $574 per month, representing the average market performance.
- Entry-level properties (Bottom 25%) see earnings around $335, often with potential for optimization.
Average Monthly Airbnb Earnings Trend in Pāvilosta
Pāvilosta Airbnb Occupancy Rate Trends (2026)
Maximize your bookings by understanding the Pāvilosta STR occupancy trends. Seasonal demand shifts significantly influence how often properties are booked. Typically, Julysees the highest demand (peak season occupancy), while January experiences the lowest (low season). Effective strategies, like adjusting minimum stays or offering promotions, can boost occupancy during slower periods. Here's how different property tiers perform in Pāvilosta:
- Best-in-class properties (Top 10%) achieve 53%+ occupancy, indicating high desirability and potentially optimized availability.
- Strong performing properties (Top 25%) maintain 36% or higher occupancy, suggesting good market fit and guest satisfaction.
- Typical properties (Median) have an occupancy rate around 20%.
- Entry-level properties (Bottom 25%) average 12% occupancy, potentially facing higher vacancy.
Average Monthly Occupancy Rate Trend in Pāvilosta
Average Daily Rate (ADR) Airbnb Trends in Pāvilosta (2026)
Effective short term rental pricing strategy in Pāvilosta involves understanding monthly ADR fluctuations. The Average Daily Rate (ADR) for Airbnb in Pāvilosta typically peaks in July and dips lowest during February. Leveraging Airbnb dynamic pricing tools or strategies based on this seasonality can significantly boost revenue. Here's a look at the typical nightly rates achieved:
- Best-in-class properties (Top 10%) command rates of $159+ per night, often due to premium features or locations.
- Strong performing properties (Top 25%) achieve nightly rates of $130 or more.
- Typical properties (Median) charge around $99 per night.
- Entry-level properties (Bottom 25%) earn around $78 per night.
Average Daily Rate (ADR) Trend by Month in Pāvilosta
Get Live Pāvilosta Market Intelligence 👇

Explore Real-time Analytics
Airbnb Seasonality Analysis & Trends in Pāvilosta (2026)
Peak Season (July, August, June)
- Revenue averages $1,658 per month
- Occupancy rates average 38.0%
- Daily rates average $114
Shoulder Season
- Revenue averages $718 per month
- Occupancy maintains around 24.5%
- Daily rates hold near $107
Low Season (January, April, October)
- Revenue drops to average $467 per month
- Occupancy decreases to average 15.3%
- Daily rates adjust to average $109
Seasonality Insights for Pāvilosta
- The Airbnb seasonality in Pāvilosta shows highly seasonal trends requiring careful strategy. While the sections above show seasonal averages, it's also insightful to look at the extremes:
- During the high season, the absolute peak month showcases Pāvilosta's highest earning potential, with monthly revenues capable of climbing to $2,108, occupancy reaching a high of 45.7%, and ADRs peaking at $115.
- Conversely, the slowest single month of the year, typically falling within the low season, marks the market's lowest point. In this month, revenue might dip to $438, occupancy could drop to 14.2%, and ADRs may adjust down to $101.
- Understanding both the seasonal averages and these monthly peaks and troughs in revenue, occupancy, and ADR is crucial for maximizing your Airbnb profit potential in Pāvilosta.
Seasonal Strategies for Maximizing Profit
- Peak Season: Maximize revenue through premium pricing and potentially longer minimum stays. Ensure high availability.
- Low Season: Offer competitive pricing, special promotions (e.g., extended stay discounts), and flexible cancellation policies. Target off-season travelers like remote workers or budget-conscious guests.
- Shoulder Seasons: Implement dynamic pricing that balances peak and low rates. Target weekend travelers or specific events. Offer slightly more flexible terms than peak season.
- Regularly analyze your own performance against these Pāvilosta seasonality benchmarks and adjust your pricing and availability strategy accordingly.
Best Areas for Airbnb Investment in Pāvilosta (2026)
Exploring the top neighborhoods for short-term rentals in Pāvilosta? This section highlights key areas, outlining why they are attractive for hosts and guests, along with notable local attractions. Consider these locations based on your target guest profile and investment strategy.
| Neighborhood / Area | Why Host Here? (Target Guests & Appeal) | Key Attractions & Landmarks |
|---|---|---|
| Pāvilosta Beach | A stunning stretch of sandy beach ideal for summer vacations, attracting both local and international tourists looking for sun and sea activities. | Pāvilosta Beach, Pāvilosta Fishing Port, White Dune, lighthouse, Kursīšu Lake |
| Pāvilosta Old Town | Rich in history and character, the Old Town features charming wooden houses and a peaceful atmosphere, perfect for families and small groups. | Old Town architecture, Local cafes, Cultural events, Scenic views |
| Amber Coast | Famous for its beautiful coast and amber deposits, attracting tourists interested in nature and outdoor activities, as well as amber crafts. | Amber beach combing, Hiking trails, Fishing spots, Nature reserves |
| Kursīšu Lake | A tranquil lake that offers a variety of water activities and nature experiences, popular among families and nature lovers. | Swimming, Kayaking, Picnic areas, Bird watching |
| Pāvilosta Marina | A vibrant marina attracting boating enthusiasts and those looking for water-based activities, ideal for adventure travelers. | Boat rentals, Fishing excursions, Water sports, Marina restaurants |
| Nature Trails | The surrounding area has numerous nature trails that are perfect for hiking and exploring the rich biodiversity of Courland. | Hiking opportunities, Wildlife watching, Photography spots |
| Cultural and Historical Sites | Pāvilosta is near several historical sites and museums that educate visitors about local history and culture. | Local museums, Historical tours, Cultural festivals |
| Local Markets | The local markets offer a taste of Latvian culture through food, crafts, and local products, perfect for immersive experiences. | Food stalls, Craft markets, Local delicacies |
Understanding Airbnb License Requirements & STR Laws in Pāvilosta (2026)
While Pāvilosta, Courland, Latvia currently shows low STR regulations, specific Airbnb license requirements might still exist or change. Always verify the latest short term rental regulations and Airbnb license requirements directly with local government authorities for Pāvilosta to ensure full compliance before hosting.
(Source: AirROI data, 2026, finding no licensed listings among those analyzed)
Top Performing Airbnb Properties in Pāvilosta (2026)
Benchmark your potential! Explore examples of top-performing Airbnb properties in Pāvilostabased on Trailing Twelve Month (TTM) revenue. Analyze their characteristics, revenue, occupancy rate, and ADR to understand what drives success in this market.

Spacious family house
Entire Place • 4 bedrooms
Holiday in Pavilosta
Entire Place • 1 bedroom

The Lighthouse
Entire Place • 1 bedroom
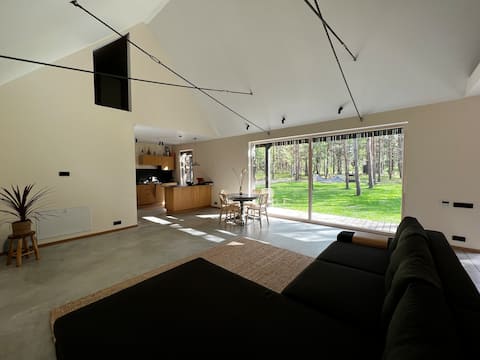
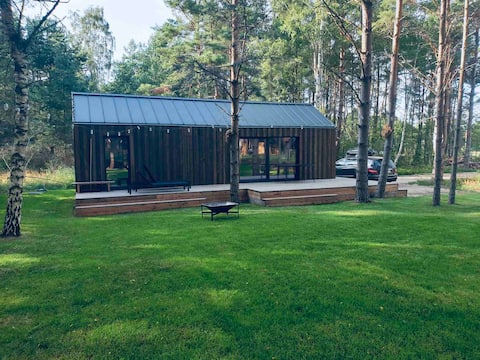
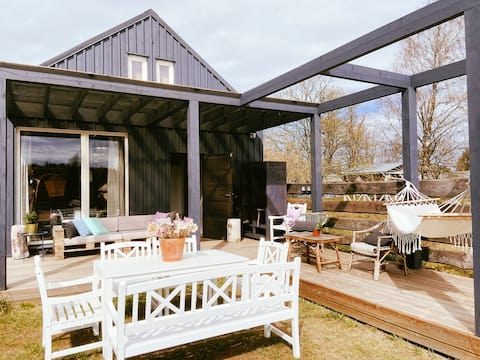
Forest Holiday Home Pāvilosta by the Beach
Entire Place • 2 bedrooms

Coastal hut
Entire Place • 1 bedroom
"VasarNICA" apartment "GALĀ"
Entire Place • 1 bedroom
Note: Performance varies based on location, size, amenities, seasonality, and management quality. Data reflects the past 12 months.
Top Performing Airbnb Hosts in Pāvilosta (2026)
Learn from the best! This table showcases top-performing Airbnb hosts in Pāvilosta based on the number of properties managed and estimated total revenue over the past year. Analyze their scale and performance metrics.
| Host Name | Properties | Grossing Revenue | Stay Reviews | Avg Rating |
|---|---|---|---|---|
| Inese | 4 | $23,393 | 40 | 4.78/5.0 |
| Ādams | 1 | $20,802 | 4 | 5.00/5.0 |
| Laura | 1 | $20,201 | 20 | 4.90/5.0 |
| Louie | 5 | $15,924 | 21 | 4.11/5.0 |
| Kristians | 1 | $15,062 | 24 | 4.92/5.0 |
| Dāvis | 1 | $14,151 | 13 | 5.00/5.0 |
| Inta | 1 | $10,721 | 51 | 5.00/5.0 |
| Krisjanis | 4 | $10,720 | 18 | 4.88/5.0 |
| Vaira | 1 | $6,476 | 96 | 4.61/5.0 |
| Norm | 1 | $4,320 | 6 | 5.00/5.0 |
Analyzing the strategies of top hosts, such as their property selection, pricing, and guest communication, can offer valuable lessons for optimizing your own Airbnb operations in Pāvilosta.
Dive Deeper: Advanced Pāvilosta STR Market Data (2026)
Ready to unlock more insights? AirROI provides access to advanced metrics and comprehensive Airbnb data for Pāvilosta. Explore detailed analytics beyond this report to refine your investment strategy, optimize pricing, and maximize your vacation rental profits.
Explore Advanced MetricsPāvilosta Short-Term Rental Market Composition (2026): Property & Room Types
Room Type Distribution
Property Type Distribution
Market Composition Insights for Pāvilosta
- The Pāvilosta Airbnb market composition is heavily skewed towards Entire Home/Apt listings, which make up 85.7% of the 28 active rentals. This indicates strong guest preference for privacy and space.
- Looking at the property type distribution in Pāvilosta, Apartment/Condo properties are the most common (60.7%), reflecting the local real estate landscape.
- Houses represent a significant 25% portion, catering likely to families or larger groups.
- Smaller segments like others, hotel/boutique (combined 7.2%) offer potential for unique stay experiences.
Pāvilosta Airbnb Room Capacity Analysis (2026): Bedroom Distribution
Distribution of Listings by Number of Bedrooms
Room Capacity Insights for Pāvilosta
- The dominant room capacity in Pāvilosta is 1 bedroom listings, making up 57.1% of the market. This suggests a strong demand for properties suitable for couples or solo travelers.
- Together, 1 bedroom and 2 bedrooms properties represent 89.2% of the active Airbnb listings in Pāvilosta, indicating a high concentration in these sizes.
- With over half the market (57.1%) consisting of studios or 1-bedroom units, Pāvilosta is particularly well-suited for individuals or couples.
- Listings with 3+ bedrooms (7.2%) represent a smaller niche, potentially indicating an underserved market for larger group accommodations in Pāvilosta.
Pāvilosta Vacation Rental Guest Capacity Trends (2026)
Distribution of Listings by Guest Capacity
Guest Capacity Insights for Pāvilosta
- The most common guest capacity trend in Pāvilosta vacation rentals is listings accommodating 4 guests (39.3%). This suggests the primary traveler segment is likely small families or groups.
- Properties designed for 4 guests and 2 guests dominate the Pāvilosta STR market, accounting for 64.3% of listings.
- 17.8% of properties accommodate 6+ guests, serving the market segment for larger families or group travel in Pāvilosta.
- On average, properties in Pāvilosta are equipped to host 4.0 guests.
Pāvilosta Airbnb Booking Patterns (2026): Available vs. Booked Days
Available Days Distribution
Booked Days Distribution
Booking Pattern Insights for Pāvilosta
- The most common availability pattern in Pāvilosta falls within the 271-366 days range, representing 82.1% of listings. This suggests many properties have significant open periods on their calendars.
- Approximately 100.0% of listings show high availability (181+ days open annually), indicating potential for increased bookings or specific owner usage patterns.
- For booked days, the 1-30 days range is most frequent in Pāvilosta (46.4%), reflecting common guest stay durations or potential owner blocking patterns.
Pāvilosta Airbnb Minimum Stay Requirements Analysis
Distribution of Listings by Minimum Night Requirement
1 Night
12 listings
42.9% of total
2 Nights
3 listings
10.7% of total
3 Nights
1 listings
3.6% of total
4-6 Nights
1 listings
3.6% of total
7-29 Nights
1 listings
3.6% of total
30+ Nights
10 listings
35.7% of total
Key Insights
- The most prevalent minimum stay requirement in Pāvilosta is 1 Night, adopted by 42.9% of listings. This highlights the market's preference for shorter, flexible bookings.
- A significant segment (35.7%) caters to monthly stays (30+ nights) in Pāvilosta, pointing to opportunities in the extended-stay market.
Recommendations
- Align with the market by considering a 1 Night minimum stay, as 42.9% of Pāvilosta hosts use this setting.
- Explore offering discounts for stays of 30+ nights to attract the 35.7% of the market seeking extended stays.
- Adjust minimum nights based on seasonality – potentially shorter during low season and longer during peak demand periods in Pāvilosta.
Pāvilosta Airbnb Cancellation Policy Trends Analysis (2026)
Flexible
12 listings
44.4% of total
Firm
3 listings
11.1% of total
Strict
12 listings
44.4% of total
Cancellation Policy Insights for Pāvilosta
- The prevailing Airbnb cancellation policy trend in Pāvilosta is Flexible, used by 44.4% of listings.
- A majority (55.5%) of hosts in Pāvilosta utilize Firm or Strict policies, indicating a market where hosts prioritize booking security.
Recommendations for Hosts
- Consider adopting a Flexible policy to align with the 44.4% market standard in Pāvilosta.
- With 44.4% using Strict terms, this is a viable option in Pāvilosta, particularly for high-value properties or during peak demand periods.
- Regularly review your cancellation policy against competitors and market demand shifts in Pāvilosta.
Pāvilosta STR Booking Lead Time Analysis (2026)
Average Booking Lead Time by Month
Booking Lead Time Insights for Pāvilosta
- The overall average booking lead time for vacation rentals in Pāvilosta is 52 days.
- Guests book furthest in advance for stays during May (average 85 days), likely coinciding with peak travel demand or local events.
- The shortest booking windows occur for stays in February (average 15 days), indicating more last-minute travel plans during this time.
- Seasonally, Summer (56 days avg.) sees the longest lead times, while Winter (18 days avg.) has the shortest, reflecting typical travel planning cycles.
Recommendations for Hosts
- Use the overall average lead time (52 days) as a baseline for your pricing and availability strategy in Pāvilosta.
- For May stays, consider implementing length-of-stay discounts or slightly higher rates for bookings made less than 85 days out to capitalize on advance planning.
- Target marketing efforts for the Summer season well in advance (at least 56 days) to capture early planners.
- Monitor your own booking lead times against these Pāvilosta averages to identify opportunities for dynamic pricing adjustments.
Popular & Essential Airbnb Amenities in Pāvilosta (2026)
Amenity Prevalence
Amenity Insights for Pāvilosta
- Essential amenities in Pāvilosta that guests expect include: Kitchen. Lacking these (this) could significantly impact bookings.
- Popular amenities like Heating, Essentials, Wifi are common but not universal. Offering these can provide a competitive edge.
- Warning: Wifi is not universally provided but is considered essential globally. Ensure reliable Wifi is offered.
Recommendations for Hosts
- Ensure your listing includes all essential amenities for Pāvilosta: Kitchen.
- Prioritize adding missing essentials: Kitchen.
- Consider adding popular differentiators like Heating or Essentials to increase appeal.
- Highlight unique or less common amenities you offer (e.g., hot tub, dedicated workspace, EV charger) in your listing description and photos.
- Regularly check competitor amenities in Pāvilosta to stay competitive.
Pāvilosta Airbnb Guest Demographics & Profile Analysis (2026)
Guest Profile Summary for Pāvilosta
- The typical guest profile for Airbnb in Pāvilosta consists of a mix of domestic (58%) and international guests, often arriving from nearby Riga, typically belonging to the Post-2000s (Gen Z/Alpha) group (50%), primarily speaking English or Latvian.
- Domestic travelers account for 58.3% of guests.
- Key international markets include Latvia (58.3%) and Germany (16.7%).
- Top languages spoken are English (41%) followed by Latvian (15.4%).
- A significant demographic segment is the Post-2000s (Gen Z/Alpha) group, representing 50% of guests.
Recommendations for Hosts
- Balance marketing efforts between domestic and international channels based on the guest mix.
- Tailor amenities and listing descriptions to appeal to the dominant Post-2000s (Gen Z/Alpha) demographic (e.g., highlight fast WiFi, smart home features, local guides).
- Highlight unique local experiences or amenities relevant to the primary guest profile.
- Consider seasonal promotions aligned with peak travel times for key origin markets.
Nearby Short-Term Rental Market Comparison
How does the Pāvilosta Airbnb market stack up against its neighbors? Compare key performance metrics like average monthly revenue, ADR, and occupancy rates in surrounding areas to understand the broader regional STR landscape.
| Market | Active Properties | Monthly Revenue | Daily Rate | Avg. Occupancy |
|---|---|---|---|---|
| Vērgales pagasts | 17 | $1,027 | $117.67 | 37% |
| Kolkas pagasts | 23 | $928 | $141.80 | 30% |
| Nīcas pagasts | 45 | $851 | $128.42 | 32% |
| Svencelė | 20 | $580 | $151.27 | 26% |
| Neringa | 230 | $580 | $123.00 | 32% |
| Jūrkalnes pagasts | 18 | $548 | $178.53 | 29% |
| Klaipėda | 420 | $527 | $84.24 | 33% |
| Padures pagasts | 15 | $514 | $102.95 | 22% |
| Liepaja | 201 | $489 | $82.75 | 33% |
| Palanga | 824 | $475 | $115.22 | 28% |