Ghabi, Beirut Governorate Airbnb Market Data 2026: STR Report & Statistics
How much can you earn on Airbnb in Ghabi, Beirut Governorate? Based on AirROI's 2026 dataset (June 2025 – May 2026), the short answer is $6,867 per year — at a $69 nightly rate, 44.3% occupancy, and a $30 RevPAR that reflects moderate rate-to-revenue efficiency with room to optimize.
With just 29 active listings, Ghabi is a micro-market where moderate demand with room for well-positioned listings to outperform. Supply has held steady year over year while revenue and nightly rates climbed — a mature market where existing hosts capture more value per listing. Stable inventory paired with rising returns reflects healthy demand.
Regulation is low with minimal registration requirements, pointing to an operator-friendly environment. In a market this size, differentiated listings with strong reviews can capture outsized returns relative to the competition.

Table of Contents [hide] [show]
What Are the Key Airbnb Metrics in Ghabi?
In Ghabi, the headline Airbnb metrics are $6,867 in average annual revenue,44.3% occupancy, $69 ADR, and $30 in RevPAR, and guests book about 16 days in advance.
How Much Do Airbnb Hosts Earn Monthly in Ghabi?
Understanding the monthly revenue variations for Airbnb listings in Ghabi is key to maximizing your short term rental income potential. Seasonality significantly impacts earnings. Our analysis, based on data from the past 12 months, shows that the peak revenue month for STRs in Ghabi is typically August, while February often presents the lowest earnings, highlighting opportunities for strategic pricing adjustments during shoulder and low seasons. Explore the typical Airbnb income in Ghabi across different performance tiers:
- Best-in-class properties (Top 10%) achieve $1,827+ monthly, often utilizing dynamic pricing and superior guest experiences.
- Strong performing properties (Top 25%) earn $1,382 or more, indicating effective management and desirable locations/amenities.
- Typical properties (Median) generate around $843 per month, representing the average market performance.
- Entry-level properties (Bottom 25%) see earnings around $443, often with potential for optimization.
Average Monthly Airbnb Earnings Trend in Ghabi
What Is the Monthly Airbnb Occupancy Rate in Ghabi?
Maximize your bookings by understanding the Ghabi STR occupancy trends. Seasonal demand shifts significantly influence how often properties are booked. Typically, Augustsees the highest demand (peak season occupancy), while May experiences the lowest (low season). Effective strategies, like adjusting minimum stays or offering promotions, can boost occupancy during slower periods. Here's how different property tiers perform in Ghabi:
- Best-in-class properties (Top 10%) achieve 80%+ occupancy, indicating high desirability and potentially optimized availability.
- Strong performing properties (Top 25%) maintain 65% or higher occupancy, suggesting good market fit and guest satisfaction.
- Typical properties (Median) have an occupancy rate around 41%.
- Entry-level properties (Bottom 25%) average 25% occupancy, potentially facing higher vacancy.
Average Monthly Occupancy Rate Trend in Ghabi
What Is the Average Airbnb Nightly Rate in Ghabi?
Effective short term rental pricing strategy in Ghabi involves understanding monthly ADR fluctuations. The Average Daily Rate (ADR) for Airbnb in Ghabi typically peaks in May and dips lowest during November. Leveraging Airbnb dynamic pricing tools or strategies based on this seasonality can significantly boost revenue. Here's a look at the typical nightly rates achieved:
- Best-in-class properties (Top 10%) command rates of $112+ per night, often due to premium features or locations.
- Strong performing properties (Top 25%) achieve nightly rates of $86 or more.
- Typical properties (Median) charge around $58 per night.
- Entry-level properties (Bottom 25%) earn around $37 per night.
Average Daily Rate (ADR) Trend by Month in Ghabi
What Is the RevPAR for Airbnb in Ghabi?
RevPAR in Ghabi is currently $30. Because RevPAR combines nightly rates with realized occupancy, it is one of the cleanest ways to compare how efficiently listings turn demand into revenue across the market.
- Entry-level properties (Bottom 25%) see $13 RevPAR.
- Typical properties (Median) generate $31 RevPAR.
- Strong performers (Top 25%) earn $42 RevPAR.
- Best-in-class (Top 10%) achieve $53 RevPAR.
Average Monthly RevPAR Trend in Ghabi
RevPAR Insights for Ghabi
- The average RevPAR in Ghabi is $30. This metric combines nightly rates with realized occupancy, making it one of the best single-number indicators of market efficiency.
- The gap between the top 10% ($53) and bottom 25% ($13) is $40, suggesting a relatively compressed market where operational differences yield moderate returns.
- RevPAR peaks in Aug and bottoms out in Feb, mirroring the broader seasonal demand pattern and suggesting opportunities for dynamic pricing.
Recommendations for Hosts
- Track your own RevPAR monthly against these Ghabi benchmarks. If your RevPAR falls below the median of $31, examine whether low occupancy or low ADR is the primary drag.
- Top-quartile listings achieve $42+ RevPAR through a combination of competitive pricing, strong reviews, and strategic amenities. Target this tier through incremental improvements.
- Use RevPAR rather than revenue alone when comparing properties of different sizes — it normalizes for available nights and gives a more accurate picture of performance.
Get Live Ghabi Market Intelligence 👇
Explore Real-time Analytics
When Is the Peak Season for Airbnb in Ghabi?
Ghabi's peak Airbnb season falls in August, July, March, while the softest stretch is February, May, September. Overall, the market shows highly seasonal trends requiring careful strategy, which should guide pricing, minimum stays, and cash-flow planning.
Peak Season (August, July, March)
- Revenue averages $1,296 per month
- Occupancy rates average 54.3%
- Daily rates average $67
Shoulder Season
- Revenue averages $1,026 per month
- Occupancy maintains around 45.4%
- Daily rates hold near $65
Low Season (February, May, September)
- Revenue drops to average $684 per month
- Occupancy decreases to average 34.0%
- Daily rates adjust to average $68
Seasonality Insights for Ghabi
- Airbnb seasonality in Ghabi is pronounced. Revenue swings sharply between peak and low months, which means pricing strategy, minimum-stay settings, and cash reserves all need to account for extended slower periods.
- During the high season, the absolute peak month showcases Ghabi's highest earning potential, with monthly revenues climbing to $1,395, occupancy reaching 60.0%, and ADRs peaking at $74.
- Conversely, the slowest single month marks the market's lowest point — revenue may dip to $572, occupancy could drop to 24.5%, and ADRs may adjust to $60.
- Understanding both the seasonal averages and these monthly peaks and troughs in revenue, occupancy, and ADR is crucial for maximizing your Airbnb profit potential in Ghabi.
Seasonal Strategies for Maximizing Profit
- Peak Season: Maximize revenue through premium pricing and potentially longer minimum stays. Ensure high availability and consider tightening cancellation policies to reduce last-minute gaps.
- Low Season: Offer competitive pricing, extended-stay discounts, and flexible cancellation policies. Target off-season travelers like remote workers, budget-conscious guests, and travelers with flexible schedules.
- Shoulder Seasons: Implement dynamic pricing that bridges peak and low rates. Target weekend travelers, local events, and business visitors. Slightly more flexible terms than peak season can help maintain occupancy without deep discounting.
- In a highly seasonal market like Ghabi, building a cash reserve during the top months is essential for covering fixed costs during the slow period. Automated pricing tools can help capture demand shifts in real time.
Do You Need a License for Airbnb in Ghabi?
Low regulation and minimal registration activity in Ghabi, Beirut Governorate, Lebanon point to an operator-friendly environment. That said, even low-regulation markets may have tax collection requirements, safety standards, or HOA rules that affect short-term rental operations. Always verify the latest short-term rental regulations and Airbnb license requirements directly with local government authorities for Ghabi to ensure full compliance before hosting.
(Source: AirROI data, 2026, finding no licensed listings among those analyzed)
What Are the Best Neighborhoods for Airbnb in Ghabi?
With a compact short-term rental market, Ghabi gives early-mover hosts an advantage in the right neighborhoods. The areas listed below are where guest demand and local attractions converge — a useful lens for investors evaluating whether to enter this market and where to position their listing.
| Neighborhood / Area | Why Host Here? (Target Guests & Appeal) | Key Attractions & Landmarks |
|---|---|---|
| Hamra | A vibrant neighborhood known for its bustling streets, eclectic shops, and widespread dining options. It attracts both locals and tourists, making it a popular choice for Airbnb investments. | American University of Beirut, Hamra Street, The Beirut Red Cross, Museum of Lebanese Prehistory, Beirut Arab University |
| Gemmayzeh | This lively area is renowned for its nightlife, art galleries, and historic architecture. It appeals to young travelers looking for a trendy and cultural experience. | Gemmayzeh Street, Art galleries, Cafes and bars, St. Nicholas Stairs, Local art studios |
| Achrafieh | A luxurious and upscale neighborhood with a mix of modern and traditional architecture. It's home to many expatriates, making it attractive for long-term Airbnb rentals. | Sassine Square, ABC Achrafieh Mall, Mar Mikhael, St. George Church, Shopping boutiques |
| Jounieh | Located a bit north of Beirut, it offers stunning sea views and is known for its tourist attractions. Great for vacation rentals due to its proximity to resorts and beaches. | Chemtai Bay, Teleferique Jounieh, Saint Charbel Monastery, Jounieh Marina, Lebanon’s Casino |
| Byblos (Jbeil) | One of the oldest continuously inhabited cities in the world, it’s a UNESCO World Heritage site attracting history lovers and tourists. Great potential for Airbnb offers. | Byblos Castle, Old Souk of Byblos, Byblos Port, The Crusader Castle, Byblos Wax Museum |
| Mar Mikhael | Known for its vibrant nightlife filled with bars and restaurants, it's popular among young locals and expatriates for both short and long-term stays. | Mar Mikhael nightlife, Street art, Cafés and bistros, Art space |
| Downtown Beirut | The commercial and cultural hub of the city, loaded with historical landmarks and modern amenities. Highly sought after by tourists for its convenience. | Beirut Souks, Riyad El Solh Square, Zaitunay Bay, Mohammad Al-Amin Mosque, National Museum of Beirut |
| Dahyeh (Southern Suburbs) | An up-and-coming area that’s becoming increasingly popular among tourists seeking a more local experience away from the central tourist spots. | Husseiniyeh Al-Mahdi Mosque, Local souks, Lebanon’s largest mall (City Mall), Historical sites |
With 8 distinct neighborhoods showing meaningful short-term rental activity, Ghabi offers diversification within a single market. Investors can tailor their strategy — from high-turnover tourist zones to quieter residential areas that attract longer stays and remote workers.
What Types of Properties Are on Airbnb in Ghabi?
Room Type Distribution
Property Type Distribution
Market Composition Insights for Ghabi
- The Ghabi Airbnb market composition is heavily skewed towards Entire Home/Apt listings, which make up 96.6% of the 29 active rentals. This indicates strong guest preference for privacy and space.
- Looking at the property type distribution in Ghabi, Apartment/Condo properties are the most common (100%), reflecting the local real estate landscape.
Ghabi Airbnb Room Capacity Analysis (2026): Bedroom Distribution
Distribution of Listings by Number of Bedrooms
Room Capacity Insights for Ghabi
- The dominant room capacity in Ghabi is 1 bedroom listings, making up 55.2% of the market. This suggests a strong demand for properties suitable for couples or solo travelers.
- Together, 1 bedroom and 2 bedrooms properties represent 82.8% of the active Airbnb listings in Ghabi, indicating a high concentration in these sizes.
- With over half the market (55.2%) consisting of studios or 1-bedroom units, Ghabi is particularly well-suited for individuals or couples.
Ghabi Vacation Rental Guest Capacity Trends (2026)
Distribution of Listings by Guest Capacity
Guest Capacity Insights for Ghabi
- The most common guest capacity trend in Ghabi vacation rentals is listings accommodating 2 guests (27.6%). This suggests the primary traveler segment is likely couples or solo travelers.
- Properties designed for 2 guests and 4 guests dominate the Ghabi STR market, accounting for 55.2% of listings.
- 10.3% of properties accommodate 6+ guests, serving the market segment for larger families or group travel in Ghabi.
- On average, properties in Ghabi are equipped to host 3.1 guests.
How Do Listings in Ghabi Compare on Quality?
Listing quality in Ghabi can be approximated through presentation depth, bedroom count, and how often hosts disclose exact locations. These signals show how professionally the local supply base is merchandised.
Listing Quality Insights for Ghabi
- At 21.9 photos per listing on average, Ghabi hosts invest well in visual presentation. Listings with 20+ photos consistently outperform in search ranking and conversion.
- 31.0% of listings show their exact location. Lower disclosure rates can increase booking hesitation — guests want to know exactly where they are staying.
Recommendations for Hosts
- Enable exact location if possible — it removes a common source of guest uncertainty and can improve your listing's position in map-based searches.
- Use these quality indicators as a self-audit checklist. Listings that exceed the Ghabi averages across all three metrics are better positioned for premium pricing.
What Amenities Do Airbnb Guests Expect in Ghabi?
Amenity Prevalence
Amenity Insights for Ghabi
- Essential amenities in Ghabi that guests expect include: Wifi, TV, Air conditioning, Kitchen. Lacking these (any) could significantly impact bookings.
- Popular amenities like Hot water, Washer, Essentials are common but not universal. Offering these can provide a competitive edge.
Recommendations for Hosts
- Ensure your listing includes all essential amenities for Ghabi: Wifi, TV, Air conditioning, Kitchen.
- Prioritize adding missing essentials: Wifi, Kitchen.
- Consider adding popular differentiators like Hot water or Washer to increase appeal.
- Highlight unique or less common amenities you offer (e.g., hot tub, dedicated workspace, EV charger) in your listing description and photos.
- Regularly check competitor amenities in Ghabi to stay competitive.
Which Airbnb Amenities Boost Revenue in Ghabi?
Not every amenity matters equally. This table focuses on the amenities most associated with higher revenue in Ghabi, which makes it more useful for prioritizing upgrades than a simple popularity list alone.
| Amenity | Prevalence | Revenue With | Revenue Without | Revenue Uplift |
|---|---|---|---|---|
Microwave | 72.4% | $8,893 | $1,549 | 474.2% |
Room-darkening shades | 55.2% | $10,705 | $2,144 | 399.2% |
Clothing storage | 75.9% | $8,210 | $2,647 | 210.2% |
Hair dryer | 69.0% | $8,596 | $3,025 | 184.1% |
Bed linens | 79.3% | $7,900 | $2,909 | 171.6% |
Body soap | 48.3% | $10,117 | $3,834 | 163.9% |
Shower gel | 51.7% | $9,770 | $3,757 | 160.0% |
Freezer | 51.7% | $9,697 | $3,835 | 152.9% |
Oven | 65.5% | $8,664 | $3,453 | 150.9% |
Refrigerator | 75.9% | $8,027 | $3,223 | 149.1% |
Revenue Impact Insights for Ghabi
- Microwave tops the revenue impact list with a 474.2% uplift — listings with this amenity earn $8,893 vs. $1,549 without it.
Recommendations for Hosts
- Focus your upgrade budget on amenities in the top half of this table. Below-median amenities may improve guest experience but contribute less to revenue growth.
- Highlight revenue-impacting amenities prominently in your listing title, photos, and description — guests can't value what they don't notice.
Dive Deeper: Advanced Ghabi STR Market Data (2026)
Ready to unlock more insights? AirROI provides access to advanced metrics and comprehensive Airbnb data for Ghabi. Explore detailed analytics beyond this report to refine your investment strategy, optimize pricing, and maximize your vacation rental profits.
Explore Advanced MetricsGhabi Airbnb Guest Demographics & Profile Analysis (2026)
Guest Profile Summary for Ghabi
- The typical guest profile for Airbnb in Ghabi consists of predominantly international visitors (76%), with top international origins including United States, typically belonging to the Post-2000s (Gen Z/Alpha) group (50%), primarily speaking English or Arabic.
- Domestic travelers account for 24.1% of guests.
- Key international markets include Lebanon (24.1%) and United States (16.4%).
- Top languages spoken are English (34.9%) followed by Arabic (25.2%).
- A significant demographic segment is the Post-2000s (Gen Z/Alpha) group, representing 50% of guests.
Recommendations for Hosts
- Focus marketing internationally, particularly towards travelers from United States.
- Tailor amenities and listing descriptions to appeal to the dominant Post-2000s (Gen Z/Alpha) demographic (e.g., highlight fast WiFi, smart home features, local guides).
- Highlight unique local experiences or amenities relevant to the primary guest profile.
- Consider seasonal promotions aligned with peak travel times for key origin markets.
What Are Airbnb Guest Ratings in Ghabi?
Listings in Ghabi average 4.81 out of 5 overall, with about 50.4 reviews per active listing and 0.0% of listings carrying the Guest Favorite badge.
Rating Breakdown by Category
Guest Rating Insights for Ghabi
- With an overall rating of 4.81, Ghabi listings meet an exceptionally high bar. Guests consistently report strong satisfaction, which drives repeat bookings and referral traffic.
- The strongest subcategory is Communication (4.89), while Location (4.75) trails behind — a useful signal for hosts looking to prioritize upgrades.
- 0.0% of listings carry the Guest Favorite badge, a strong trust signal that can meaningfully lift click-through and booking rates.
Recommendations for Hosts
- Focus improvement efforts on Location — even small gains in the weakest subcategory can lift overall ratings and search ranking.
- Encourage guests to leave reviews after checkout. Listings with more reviews rank higher in search results and convert browsers into bookers more effectively.
- With only 0.0% of listings earning Guest Favorite status, hosts who consistently exceed expectations have a clear competitive advantage.
Ghabi Airbnb Booking Patterns (2026): Available vs. Booked Days
Available Days Distribution
Booked Days Distribution
Booking Pattern Insights for Ghabi
- The most common availability pattern in Ghabi falls within the 271-366 days range, representing 58.6% of listings. This suggests many properties have significant open periods on their calendars.
- Approximately 86.2% of listings show high availability (181+ days open annually), indicating potential for increased bookings or specific owner usage patterns.
- For booked days, the 31-90 days range is most frequent in Ghabi (41.4%), reflecting common guest stay durations or potential owner blocking patterns.
- A notable 13.7% of properties secure long booking periods (181+ days booked per year), highlighting successful long-term rental strategies or significant owner usage.
How Far in Advance Do Guests Book Airbnb in Ghabi?
Average Booking Lead Time by Month
Booking Lead Time Insights for Ghabi
- The overall average booking lead time for vacation rentals in Ghabi is 16 days.
- Guests book furthest in advance for stays during August (average 34 days), likely coinciding with peak travel demand or local events.
- The shortest booking windows occur for stays in October (average 5 days), indicating more last-minute travel plans during this time.
- Seasonally, Summer (23 days avg.) sees the longest lead times, while Fall (8 days avg.) has the shortest, reflecting typical travel planning cycles.
Recommendations for Hosts
- Use the overall average lead time (16 days) as a baseline for your pricing and availability strategy in Ghabi.
- For August stays, consider implementing length-of-stay discounts or slightly higher rates for bookings made less than 34 days out to capitalize on advance planning.
- During October, focus on last-minute booking availability and promotions, as guests book with very short notice (5 days avg.).
- Target marketing efforts for the Summer season well in advance (at least 23 days) to capture early planners.
- Monitor your own booking lead times against these Ghabi averages to identify opportunities for dynamic pricing adjustments.
What Is the Average Length of Stay for Airbnb in Ghabi?
Guests in Ghabi stay about 10.7 nights on average, generating roughly 381 reservations and 13.1 bookings per listing in the latest AirROI dataset. The most common check-in time is 3:00 PM and check-out is 12:00 PM.
Monthly Length of Stay in Ghabi
Check-in Time Distribution
Check-out Time Distribution
Stay Pattern Insights for Ghabi
- Longer stays mean fewer turnovers and lower cleaning costs per revenue dollar. This pattern also opens the door to monthly discount strategies that attract remote workers and extended-stay travelers.
- 13.1 bookings per listing is a manageable pace that balances revenue with operational overhead.
- Stay lengths peak in Mar (10.5 nights) and shorten in May (3.2 nights). Adjust minimum-night requirements seasonally to match.
Recommendations for Hosts
- Leverage the longer-stay pattern by offering weekly discounts — even 5-10% off can convert browsing into bookings for guests considering an extended stay.
- Set your check-in time to match or beat the market standard of 3:00 PM. Offering early check-in flexibility can be a low-cost differentiator.
- Monitor length-of-stay seasonality to adjust minimum-night requirements — longer minimums during peak periods maximize revenue while shorter minimums fill gaps in shoulder seasons.
Ghabi Airbnb Minimum Stay Requirements Analysis
Distribution of Listings by Minimum Night Requirement
1 Night
6 listings
20.7% of total
2 Nights
4 listings
13.8% of total
3 Nights
4 listings
13.8% of total
4-6 Nights
2 listings
6.9% of total
7-29 Nights
6 listings
20.7% of total
30+ Nights
7 listings
24.1% of total
Key Insights
- The most prevalent minimum stay requirement in Ghabi is 30+ Nights, adopted by 24.1% of listings. This highlights the market's preference for longer commitments.
- A significant segment (24.1%) caters to monthly stays (30+ nights) in Ghabi, pointing to opportunities in the extended-stay market.
Recommendations
- Align with the market by considering a 30+ Nights minimum stay, as 24.1% of Ghabi hosts use this setting.
- If feasible, allowing 1-night stays, especially midweek or during low season, could capture last-minute bookings, as only 20.7% currently do.
- Explore offering discounts for stays of 30+ nights to attract the 24.1% of the market seeking extended stays.
- Adjust minimum nights based on seasonality – potentially shorter during low season and longer during peak demand periods in Ghabi.
Ghabi Airbnb Cancellation Policy Trends Analysis (2026)
Super Strict 60 Days
1 listings
3.4% of total
Limited
3 listings
10.3% of total
Flexible
7 listings
24.1% of total
Moderate
10 listings
34.5% of total
Firm
5 listings
17.2% of total
Strict
3 listings
10.3% of total
Cancellation Policy Insights for Ghabi
- The prevailing Airbnb cancellation policy trend in Ghabi is Moderate, used by 34.5% of listings.
- There's a relatively balanced mix between guest-friendly (58.6%) and stricter (27.5%) policies, offering choices for different guest needs.
Recommendations for Hosts
- Consider adopting a Moderate policy to align with the 34.5% market standard in Ghabi.
- Using a Strict policy might deter some guests, as only 10.3% of listings use it. Evaluate if potential revenue protection outweighs possible lower booking rates.
- Regularly review your cancellation policy against competitors and market demand shifts in Ghabi.
How Much Are Airbnb Cleaning Fees in Ghabi?
Cleaning fees in Ghabi are meaningful operating levers, not just pass-through charges. What matters most is how often hosts charge them, how high they run relative to market norms, and how large a share of gross revenue they consume.
Cleaning Fee Insights for Ghabi
- 82.8% of listings charge a cleaning fee, making it standard practice in Ghabi. Guests expect it and factor it into their booking decisions.
- The gap between the average ($92) and median ($30) cleaning fee indicates some high-end properties are pulling the average up considerably.
- Cleaning fees represent 5.1% of gross revenue on average — a modest component of the overall booking price.
Recommendations for Hosts
- Price your cleaning fee competitively against the Ghabi median of $30. Fees significantly above market norms can deter bookings, especially for shorter stays.
- Monitor competitor cleaning fees regularly. Airbnb's search algorithm factors in total price, so a well-calibrated cleaning fee can improve your listing's ranking.
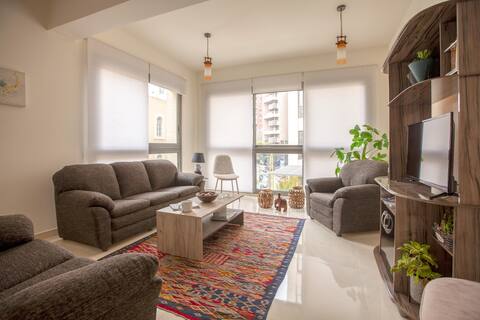
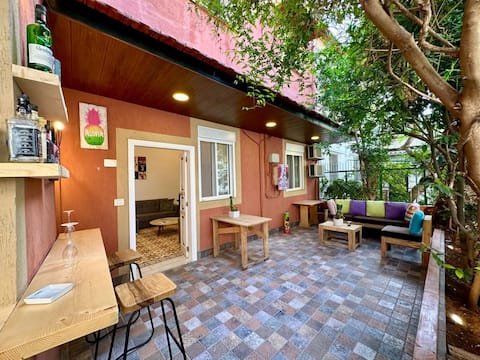
What Do the Top Airbnb Listings in Ghabi Look Like?
Benchmark your potential! Explore examples of top-performing Airbnb properties in Ghabibased on Trailing Twelve Month (TTM) revenue. Analyze their characteristics, revenue, occupancy rate, and ADR to understand what drives success in this market.

Santiago Duplex in Ashrafieh
Entire Place • 2 bedrooms

24/7 Elec Elegant Modern 1-BR APT in Achrafieh
Entire Place • 1 bedroom

24/7 Electricity Remodeled 1-BDR APT in Achrafieh
Entire Place • 1 bedroom
Sioufi - 2-BR Apartment With a Balcony
Entire Place • 2 bedrooms

Georgette’s Residence 2# 24/7 Electricity
Entire Place • 1 bedroom
No104,Ashrafieh,2BR,special discount for today!
Entire Place • 2 bedrooms
Note: Performance varies based on location, size, amenities, seasonality, and management quality. Data reflects the past 12 months.
Who Are the Top Airbnb Hosts in Ghabi?
Learn from the best! This table showcases top-performing Airbnb hosts in Ghabi based on the number of properties managed and estimated total revenue over the past year. Analyze their scale and performance metrics.
| Host Name | Properties | Grossing Revenue | Stay Reviews | Avg Rating |
|---|---|---|---|---|
| Joe | 3 | $46,286 | 425 | 4.93/5.0 |
| StayInn | 1 | $25,525 | 41 | 4.80/5.0 |
| Patricia | 2 | $22,877 | 102 | 4.93/5.0 |
| Local Host | 1 | $15,799 | 126 | 4.63/5.0 |
| Georgette | 2 | $15,038 | 251 | 4.91/5.0 |
| VCondos | 2 | $13,516 | 31 | 4.97/5.0 |
| Charbel | 1 | $11,344 | 144 | 5.00/5.0 |
| Anna Rita | 1 | $10,271 | 8 | 4.88/5.0 |
| Walid | 3 | $7,514 | 56 | 4.73/5.0 |
| Patrick | 1 | $5,328 | 69 | 4.93/5.0 |
Analyzing the strategies of top hosts, such as their property selection, pricing, and guest communication, can offer valuable lessons for optimizing your own Airbnb operations in Ghabi.
Who Are the Airbnb Hosts in Ghabi?
Ghabi is a quality-focused market, with a high Superhost share and fairly mature operating standards.
Host Profile Insights for Ghabi
- With 51.7% Superhosts, Ghabi has an experienced host base that sets high guest expectations. New entrants should plan for competitive quality standards.
- 0.0% of listings have Instant Book enabled. Lower Instant Book adoption means many guests must request approval, which can slow conversions.
- 62.1% of listings use Airbnb's simplified pricing (host-only fee), where the host pays the entire platform service fee and the guest sees one all-in price with no separate Airbnb service charge. High adoption signals a professional, PMS-connected host base — Airbnb mandates simplified pricing for software-connected listings.
Recommendations for Hosts
- Consider enabling Instant Book — it reduces booking friction and Airbnb's algorithm tends to favor Instant Book listings in search results.
- With 62.1% cohosted listings, there may be a growing local market for property management services.
- Benchmark your host metrics against these Ghabi averages regularly and adjust your hosting strategy based on what top performers do differently.
How Does Ghabi's Airbnb Market Compare to Nearby Cities?
How does the Ghabi Airbnb market stack up against its neighbors? Compare key performance metrics like average monthly revenue, ADR, and occupancy rates in surrounding areas to understand the broader regional STR landscape.
Compared with Alona Regional Council, Ghabi has 11 percentage points higher occupancy and about $416 lower ADR. That helps frame whether this market is winning more on demand, pricing, or both.
| Market | Active Properties | Monthly Revenue | Daily Rate | Avg. Occupancy |
|---|---|---|---|---|
| Gilboa Regional Council | 73 | $4,175 | $638.36 | 27% |
| Daliyat al-Karmel | 21 | $3,033 | $562.61 | 21% |
| Emek HaMaayanot Regional Council | 72 | $3,016 | $517.01 | 27% |
| Hof HaCarmel Regional Council | 137 | $2,913 | $592.78 | 26% |
| Galil Tachton Regional Council | 75 | $2,851 | $486.99 | 27% |
| Yavneel | 27 | $2,760 | $505.96 | 24% |
| Alona Regional Council | 11 | $2,614 | $485.16 | 33% |
| Caesarea | 20 | $2,501 | $858.99 | 28% |
| Migdal | 96 | $2,451 | $639.20 | 24% |
| Zikhron Yaakov | 61 | $2,448 | $340.81 | 30% |
Frequently Asked Questions About Airbnb in Ghabi
These quick answers summarize the most common investor and operator questions using AirROI's latest market data for Ghabi.
How much do Airbnb hosts make in Ghabi?
Ghabi hosts earn about $6,867 per year on average, with an average nightly rate of $69 and RevPAR of $30. Those figures describe the typical revenue environment for active listings in Ghabi, Beirut Governorate, not the ceiling for the best operators. Source: AirROI 2026 data, Ghabi market, June 2025 to May 2026.
What is the average Airbnb occupancy rate in Ghabi?
The average Airbnb occupancy rate in Ghabi is 44.3%. August is the strongest month and February is the softest, so hosts should expect demand to move meaningfully throughout the year rather than stay flat.
What is the average Airbnb daily rate in Ghabi?
Listings in Ghabi average $69 per night. The broader pricing spread also matters: lower-performing listings cluster closer to the lower quartiles, while premium homes can price materially above the city average when demand spikes or listing quality stands out.
How many Airbnb listings are active in Ghabi?
Ghabi currently has about 29 active Airbnb listings in AirROI's market dataset. That supply count helps explain how competitive the market is, how much depth there is for benchmarking, and whether the market behaves like a niche destination or a scaled urban market.
How strict are short-term rental regulations in Ghabi?
AirROI currently classifies the short-term rental regulation level in Ghabi as Low. The dataset also shows about 0.0% of listings with registration evidence. That is a market signal, not legal advice, so hosts should still confirm current licensing and compliance rules locally before listing.
What is the RevPAR for Airbnb in Ghabi?
RevPAR in Ghabi is about $30. That metric combines pricing and occupancy into one efficiency number, so it is often a better quick benchmark than ADR alone when investors want to compare how well listings convert nightly rates into realized revenue.
Is Airbnb profitable in Ghabi?
At 44.3% occupancy, Ghabi can be profitable — but margins depend heavily on operating costs, property acquisition price, and how well hosts optimize pricing across seasons. Average annual revenue is $6,867, but individual returns depend on property type, location within the city, and the host's operating efficiency.
How far in advance do guests book Airbnb in Ghabi?
The average booking lead time in Ghabi is about 16 days — a relatively short booking window, meaning most guests decide within a few weeks of their trip — dynamic pricing can capture late demand. Hosts who understand their market's booking cadence can adjust minimum stays and pricing windows accordingly.
What are the best neighborhoods for Airbnb in Ghabi?
Based on AirROI's analysis, some of the top neighborhoods for short-term rentals in Ghabi include Hamra, Gemmayzeh, Achrafieh. Each area attracts different guest profiles — from business travelers to leisure visitors — so the best location depends on the property type and target audience a host is aiming for. See the full neighborhood breakdown above.
What type of property performs best on Airbnb in Ghabi?
entire_home listings make up 96.6% of the active supply in Ghabi. The most common configuration does not always mean the most profitable — operators who identify underserved property types or bedroom counts can sometimes outperform the market average by filling a gap in local supply.
How does Ghabi compare to nearby Airbnb markets?
Among neighboring markets, Gilboa Regional Council posts $50,099 in average annual revenue with 27.4% occupancy, compared to Ghabi's $6,867 and 44.3%. Comparing nearby markets helps investors understand whether a destination's performance reflects local demand or broader regional trends.
What is the average length of stay in Ghabi?
The average Airbnb stay length in Ghabi is about 10.7 nights. That matters for turnover, cleaning operations, and pricing strategy because shorter stays increase changeovers while longer stays can smooth occupancy and reduce operational friction.
What is the average Airbnb guest rating in Ghabi?
Airbnb listings in Ghabi average 4.81 out of 5 overall. About 0.0% of listings carry the guest favorite badge, which suggests a meaningful share of inventory is competing on review quality rather than price alone.
Which amenities boost Airbnb revenue in Ghabi?
Microwave and Room-darkening shades are among the strongest revenue-linked amenities in Ghabi. In AirROI's latest dataset, listings with these amenities outperform those without on average revenue, which makes amenities analysis useful for prioritizing investment and listing upgrades.
Do Airbnb hosts charge cleaning fees in Ghabi?
Yes. About 82.8% of active Airbnb listings in Ghabi charge a cleaning fee, and the average fee is $92. The more important operating benchmark is how much of gross revenue that fee consumes, not just the absolute dollar amount.
What percentage of Airbnb hosts are Superhosts in Ghabi?
A 51.7% Superhost rate signals a highly competitive market where review quality and responsiveness are table stakes, not differentiators.
About AirROI Market Data
AirROI tracks over 20 million properties across 190+ countries and maintains 15+ years of historical performance data, making it one of the deepest Airbnb and STR intelligence platforms available. The analytics pipeline aggregates listing-level data monthly — revenue, occupancy, nightly rates, RevPAR, guest demographics, booking patterns, and competitive supply — so investors and operators can benchmark any market against its own history and against neighboring destinations.
Real estate investors, property managers, financial institutions, hedge funds, tourism boards, hospitality consultants, tech platforms, and academic researchers rely on AirROI data to underwrite acquisitions, optimize pricing, model macro trends, and conduct peer-reviewed research. Data is available through in-depth market reports like this one and the Airbnb API with 22 endpoints and an Airbnb MCP Server for AI agents.
AirROI proprietary analytics as of 2026-05-31. Metrics reflect trailing twelve-month aggregates from active listings. Revenue figures are market averages, not projections. Neighborhood descriptions are AI-generated and reviewed for accuracy. For full methodology, see the data methodology page.