Berbara Airbnb Market Analysis 2026: Short Term Rental Data & Vacation Rental Statistics in Keserwan-Jbeil Governorate, Lebanon
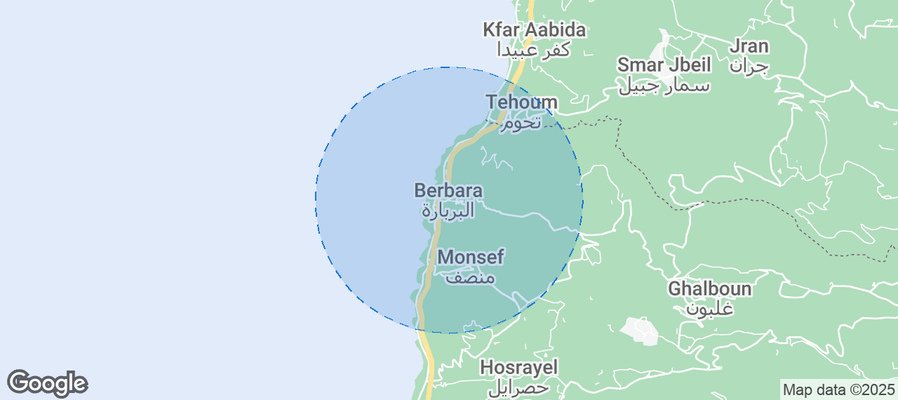
Is Airbnb profitable in Berbara in 2026? Explore comprehensive Airbnb analytics for Berbara, Keserwan-Jbeil Governorate, Lebanon to uncover income potential. This 2026 STR market report for Berbara, based on AirROI data from May 2024 to April 2025, reveals key trends in the niche market of 18 active listings.
Whether you're considering an Airbnb investment in Berbara, optimizing your existing vacation rental, or exploring rental arbitrage opportunities, understanding the Berbara Airbnb data is crucial. Leveraging the low regulation environment is key to maximizing your short term rental income potential. Let's dive into the specifics.
Key Berbara Airbnb Performance Metrics Overview
Monthly Airbnb Revenue Variations & Income Potential in Berbara (2026)
Understanding the monthly revenue variations for Airbnb listings in Berbara is key to maximizing your short term rental income potential. Seasonality significantly impacts earnings. Our analysis, based on data from the past 12 months, shows that the peak revenue month for STRs in Berbara is typically October, while January often presents the lowest earnings, highlighting opportunities for strategic pricing adjustments during shoulder and low seasons. Explore the typical Airbnb income in Berbara across different performance tiers:
- Best-in-class properties (Top 10%) achieve $8,279+ monthly, often utilizing dynamic pricing and superior guest experiences.
- Strong performing properties (Top 25%) earn $3,900 or more, indicating effective management and desirable locations/amenities.
- Typical properties (Median) generate around $3,336 per month, representing the average market performance.
- Entry-level properties (Bottom 25%) see earnings around $2,121, often with potential for optimization.
Average Monthly Airbnb Earnings Trend in Berbara
Berbara Airbnb Occupancy Rate Trends (2026)
Maximize your bookings by understanding the Berbara STR occupancy trends. Seasonal demand shifts significantly influence how often properties are booked. Typically, Junesees the highest demand (peak season occupancy), while January experiences the lowest (low season). Effective strategies, like adjusting minimum stays or offering promotions, can boost occupancy during slower periods. Here's how different property tiers perform in Berbara:
- Best-in-class properties (Top 10%) achieve 26%+ occupancy, indicating high desirability and potentially optimized availability.
- Strong performing properties (Top 25%) maintain 23% or higher occupancy, suggesting good market fit and guest satisfaction.
- Typical properties (Median) have an occupancy rate around 21%.
- Entry-level properties (Bottom 25%) average 6% occupancy, potentially facing higher vacancy.
Average Monthly Occupancy Rate Trend in Berbara
Average Daily Rate (ADR) Airbnb Trends in Berbara (2026)
Effective short term rental pricing strategy in Berbara involves understanding monthly ADR fluctuations. The Average Daily Rate (ADR) for Airbnb in Berbara typically peaks in July and dips lowest during December. Leveraging Airbnb dynamic pricing tools or strategies based on this seasonality can significantly boost revenue. Here's a look at the typical nightly rates achieved:
- Best-in-class properties (Top 10%) command rates of $437+ per night, often due to premium features or locations.
- Strong performing properties (Top 25%) achieve nightly rates of $288 or more.
- Typical properties (Median) charge around $242 per night.
- Entry-level properties (Bottom 25%) earn around $162 per night.
Average Daily Rate (ADR) Trend by Month in Berbara
Get Live Berbara Market Intelligence 👇
Explore Real-time Analytics
Airbnb Seasonality Analysis & Trends in Berbara (2025)
Peak Season (October, November, May)
- Revenue averages $7,740 per month
- Occupancy rates average 4.4%
- Daily rates average $266
Shoulder Season
- Revenue averages $3,487 per month
- Occupancy maintains around 25.8%
- Daily rates hold near $253
Low Season (January, February, March)
- Revenue drops to average $73 per month
- Occupancy decreases to average 3.2%
- Daily rates adjust to average $227
Seasonality Insights for Berbara
- The Airbnb seasonality in Berbara shows highly seasonal trends requiring careful strategy. While the sections above show seasonal averages, it's also insightful to look at the extremes:
- During the high season, the absolute peak month showcases Berbara's highest earning potential, with monthly revenues capable of climbing to $8,048, occupancy reaching a high of 68.3%, and ADRs peaking at $267.
- Conversely, the slowest single month of the year, typically falling within the low season, marks the market's lowest point. In this month, revenue might dip to $0, occupancy could drop to 0.0%, and ADRs may adjust down to $222.
- Understanding both the seasonal averages and these monthly peaks and troughs in revenue, occupancy, and ADR is crucial for maximizing your Airbnb profit potential in Berbara.
Seasonal Strategies for Maximizing Profit
- Peak Season: Maximize revenue through premium pricing and potentially longer minimum stays. Ensure high availability.
- Low Season: Offer competitive pricing, special promotions (e.g., extended stay discounts), and flexible cancellation policies. Target off-season travelers like remote workers or budget-conscious guests.
- Shoulder Seasons: Implement dynamic pricing that balances peak and low rates. Target weekend travelers or specific events. Offer slightly more flexible terms than peak season.
- Regularly analyze your own performance against these Berbara seasonality benchmarks and adjust your pricing and availability strategy accordingly.
Best Areas for Airbnb Investment in Berbara (2026)
Exploring the top neighborhoods for short-term rentals in Berbara? This section highlights key areas, outlining why they are attractive for hosts and guests, along with notable local attractions. Consider these locations based on your target guest profile and investment strategy.
| Neighborhood / Area | Why Host Here? (Target Guests & Appeal) | Key Attractions & Landmarks |
|---|---|---|
| Byblos | A historic city known for its ancient ruins and beautiful Mediterranean coastline. Popular among tourists for its rich history and vibrant atmosphere. | Byblos Castle, Byblos Old Souk, Saint John-Marc Cathedral, Byblos Harbor, Roman Ruins |
| Jbeil | Located close to the coast, offering stunning views and a blend of history and modernity. Ideal for visitors seeking both relaxation and cultural experiences. | Jbeil Castle, The Old City of Jbeil, Public Beach, Marina, Restaurants |
| Bkerke | A spiritual and historical place with a variety of churches, making it appealing for religious tourism and visitors seeking tranquility. | Maronite Patriarchate, Church of St. George, Mount Lebanon views, Local markets |
| Kfarabida | A picturesque coastal village perfect for beach lovers and those looking for a serene getaway. Offers a relaxed atmosphere with beautiful beaches. | Kfarabida Beach, Beachside cafes, Local seafood restaurants |
| Ain El Mraiseh | A vibrant neighborhood known for its lively nightlife and close proximity to major attractions in Beirut, ideal for younger tourists. | Nightclubs, Waterfront Promenade, Restaurants, Shopping |
| Batroun | Famous for its charming old town and beautiful beaches. It attracts visitors interested in both historical sites and beach vacations. | Batroun Old Town, Phoenician Wall, Rocky Beach, Local wineries |
| Hezballah Hill | A unique area known for its stunning views of the coastline and offers a range of outdoor activities for adventure seekers. | Hiking trails, Scenic viewpoints, Cultural sites |
| Fanar | A suburb that offers easy access to Beirut with a friendly local atmosphere. Suitable for families and those wanting a quieter stay. | Local parks, Shopping areas, Cafes |
Understanding Airbnb License Requirements & STR Laws in Berbara (2026)
While Berbara, Keserwan-Jbeil Governorate, Lebanon currently shows low STR regulations, specific Airbnb license requirements might still exist or change. Always verify the latest short term rental regulations and Airbnb license requirements directly with local government authorities for Berbara to ensure full compliance before hosting.
(Source: AirROI data, 2026, finding no licensed listings among those analyzed)
Top Performing Airbnb Properties in Berbara (2026)
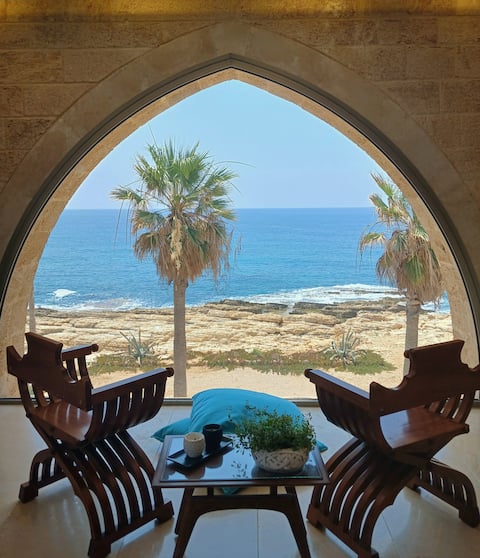
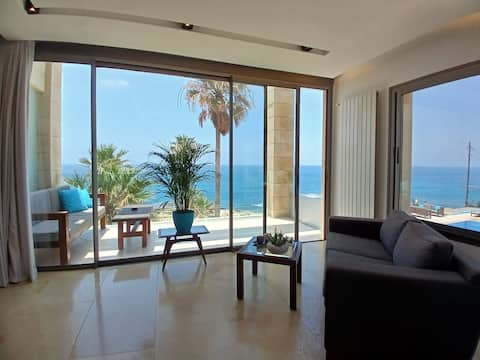
Benchmark your potential! Explore examples of top-performing Airbnb properties in Berbarabased on Trailing Twelve Month (TTM) revenue. Analyze their characteristics, revenue, occupancy rate, and ADR to understand what drives success in this market.

Room with balcony in luxury guesthouse and resort
Private Room • 1 bedroom
Stylish room in luxury guesthouse and resort
Private Room • 1 bedroom
Room with terrace in luxury guesthouse and resort
Private Room • 1 bedroom
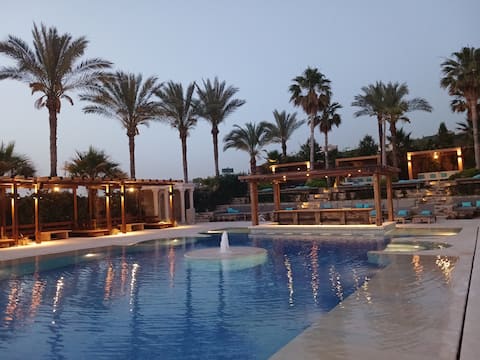
Luxury guest house room with pool and beach
Private Room • 1 bedroom
Room in Luxury guesthouse and resort
Private Room • 1 bedroom
Apartment by the sea in Batroun
Entire Place • 1 bedroom
Note: Performance varies based on location, size, amenities, seasonality, and management quality. Data reflects the past 12 months.
Top Performing Airbnb Hosts in Berbara (2026)
Learn from the best! This table showcases top-performing Airbnb hosts in Berbara based on the number of properties managed and estimated total revenue over the past year. Analyze their scale and performance metrics.
| Host Name | Properties | Grossing Revenue | Stay Reviews | Avg Rating |
|---|---|---|---|---|
| Host #20398839 | 5 | $110,386 | 1 | 0.00/5.0 |
| Host #486881240 | 5 | $85,237 | 0 | 0.00/5.0 |
| Host #128505673 | 1 | $17,967 | 0 | 0.00/5.0 |
| Host #497761059 | 1 | $11,517 | 0 | 0.00/5.0 |
| Host #450403400 | 2 | $10,894 | 0 | 0.00/5.0 |
| Host #405387033 | 1 | $9,022 | 0 | 0.00/5.0 |
| Ralph | 2 | $1,195 | 14 | 5.00/5.0 |
| Host #199150181 | 1 | $677 | 1 | 0.00/5.0 |
Analyzing the strategies of top hosts, such as their property selection, pricing, and guest communication, can offer valuable lessons for optimizing your own Airbnb operations in Berbara.
Dive Deeper: Advanced Berbara STR Market Data (2026)
Ready to unlock more insights? AirROI provides access to advanced metrics and comprehensive Airbnb data for Berbara. Explore detailed analytics beyond this report to refine your investment strategy, optimize pricing, and maximize your vacation rental profits.
Explore Advanced MetricsBerbara Short-Term Rental Market Composition (2026): Property & Room Types
Room Type Distribution
Property Type Distribution
Market Composition Insights for Berbara
- The Berbara Airbnb market composition is heavily skewed towards Private Room listings, which make up 72.2% of the 18 active rentals. This indicates strong guest preference for privacy and space.
- Looking at the property type distribution in Berbara, Hotel/Boutique properties are the most common (72.2%), reflecting the local real estate landscape.
- The presence of 72.2% Hotel/Boutique listings indicates integration with traditional hospitality.
Berbara Airbnb Room Capacity Analysis (2026): Bedroom Distribution
Distribution of Listings by Number of Bedrooms
Room Capacity Insights for Berbara
- The dominant room capacity in Berbara is 1 bedroom listings, making up 83.3% of the market. This suggests a strong demand for properties suitable for couples or solo travelers.
- Together, 1 bedroom and 3 bedrooms properties represent 94.4% of the active Airbnb listings in Berbara, indicating a high concentration in these sizes.
- With over half the market (83.3%) consisting of studios or 1-bedroom units, Berbara is particularly well-suited for individuals or couples.
Berbara Vacation Rental Guest Capacity Trends (2026)
Distribution of Listings by Guest Capacity
Guest Capacity Insights for Berbara
- The most common guest capacity trend in Berbara vacation rentals is listings accommodating 2 guests (50%). This suggests the primary traveler segment is likely couples or solo travelers.
- Properties designed for 2 guests and 3 guests dominate the Berbara STR market, accounting for 88.9% of listings.
- A significant 50.0% of listings cater specifically to 1-2 guests, highlighting strong demand from couples and solo travelers in Berbara.
- 11.2% of properties accommodate 6+ guests, serving the market segment for larger families or group travel in Berbara.
- On average, properties in Berbara are equipped to host 2.9 guests.
Berbara Airbnb Booking Patterns (2026): Available vs. Booked Days
Available Days Distribution
Booked Days Distribution
Booking Pattern Insights for Berbara
- The most common availability pattern in Berbara falls within the 271-366 days range, representing 94.4% of listings. This suggests many properties have significant open periods on their calendars.
- Approximately 100.0% of listings show high availability (181+ days open annually), indicating potential for increased bookings or specific owner usage patterns.
- For booked days, the 31-90 days range is most frequent in Berbara (77.8%), reflecting common guest stay durations or potential owner blocking patterns.
Berbara Airbnb Minimum Stay Requirements Analysis
Distribution of Listings by Minimum Night Requirement
1 Night
11 listings
84.6% of total
2 Nights
2 listings
15.4% of total
Key Insights
- The most prevalent minimum stay requirement in Berbara is 1 Night, adopted by 84.6% of listings. This highlights the market's preference for shorter, flexible bookings.
- A strong majority (100.0%) of the Berbara Airbnb data shows acceptance of very short stays (1-2 nights), indicating a dynamic, high-turnover market.
Recommendations
- Align with the market by considering a 1 Night minimum stay, as 84.6% of Berbara hosts use this setting.
- Adjust minimum nights based on seasonality – potentially shorter during low season and longer during peak demand periods in Berbara.
Berbara Airbnb Cancellation Policy Trends Analysis (2026)
Flexible
2 listings
100% of total
Cancellation Policy Insights for Berbara
- The prevailing Airbnb cancellation policy trend in Berbara is Flexible, used by 100% of listings.
- The market strongly favors guest-friendly terms, with 100.0% of listings offering Flexible or Moderate policies. This suggests guests in Berbara may expect booking flexibility.
Recommendations for Hosts
- Consider adopting a Flexible policy to align with the 100% market standard in Berbara.
- Given the high prevalence of Flexible policies (100%), offering this can enhance booking appeal, especially during shoulder seasons.
- Regularly review your cancellation policy against competitors and market demand shifts in Berbara.
Berbara STR Booking Lead Time Analysis (2026)
Average Booking Lead Time by Month
Booking Lead Time Insights for Berbara
- The overall average booking lead time for vacation rentals in Berbara is 10 days.
- Guests book furthest in advance for stays during October (average 41 days), likely coinciding with peak travel demand or local events.
- The shortest booking windows occur for stays in June (average 0 days), indicating more last-minute travel plans during this time.
- Seasonally, Fall (22 days avg.) sees the longest lead times, while Spring (6 days avg.) has the shortest, reflecting typical travel planning cycles.
Recommendations for Hosts
- Use the overall average lead time (10 days) as a baseline for your pricing and availability strategy in Berbara.
- For October stays, consider implementing length-of-stay discounts or slightly higher rates for bookings made less than 41 days out to capitalize on advance planning.
- During June, focus on last-minute booking availability and promotions, as guests book with very short notice (0 days avg.).
- Target marketing efforts for the Fall season well in advance (at least 22 days) to capture early planners.
- Monitor your own booking lead times against these Berbara averages to identify opportunities for dynamic pricing adjustments.
Popular & Essential Airbnb Amenities in Berbara (2026)
Amenity Prevalence
Amenity Insights for Berbara
- Essential amenities in Berbara that guests expect include: Kitchen, Dryer, Heating, Free parking on premises, Air conditioning, Essentials, TV, Washer, Wifi. Lacking these (any) could significantly impact bookings.
- Popular amenities like Hot water are common but not universal. Offering these can provide a competitive edge.
Recommendations for Hosts
- Ensure your listing includes all essential amenities for Berbara: Kitchen, Dryer, Heating, Free parking on premises, Air conditioning, Essentials, TV, Washer, Wifi.
- Consider adding popular differentiators like Hot water to increase appeal.
- Highlight unique or less common amenities you offer (e.g., hot tub, dedicated workspace, EV charger) in your listing description and photos.
- Regularly check competitor amenities in Berbara to stay competitive.
Berbara Airbnb Guest Demographics & Profile Analysis (2026)
Guest Profile Summary for Berbara
- The typical guest profile for Airbnb in Berbara consists of predominantly international visitors (100%), with top international origins including Canada, typically belonging to the 1990s (Older Gen Z) group (50%), primarily speaking English or French.
- Domestic travelers account for 0.0% of guests.
- Top languages spoken are English (25%) followed by French (25%).
- A significant demographic segment is the Post-2000s (Gen Z/Alpha) group, representing 50% of guests.
Recommendations for Hosts
- Focus marketing internationally, particularly towards travelers from Canada.
- Tailor amenities and listing descriptions to appeal to the dominant 1990s (Older Gen Z) demographic (e.g., highlight fast WiFi, smart home features, local guides).
- Highlight unique local experiences or amenities relevant to the primary guest profile.
- Consider seasonal promotions aligned with peak travel times for key origin markets.
Nearby Short-Term Rental Market Comparison
How does the Berbara Airbnb market stack up against its neighbors? Compare key performance metrics like average monthly revenue, ADR, and occupancy rates in surrounding areas to understand the broader regional STR landscape.
| Market | Active Properties | Monthly Revenue | Daily Rate | Avg. Occupancy |
|---|---|---|---|---|
| Aannaya | 20 | $2,814 | $371.02 | 19% |
| Shlomi | 10 | $2,521 | $499.60 | 16% |
| Paralimni | 1,172 | $2,278 | $231.74 | 41% |
| Maale Yosef Regional Council | 77 | $1,941 | $426.64 | 22% |
| Mayrouba | 21 | $1,725 | $180.09 | 28% |
| Baabdat | 10 | $1,610 | $205.08 | 28% |
| Mtain | 11 | $1,604 | $281.61 | 17% |
| Eddeh | 12 | $1,571 | $211.77 | 24% |
| Mar Maroun | 29 | $1,537 | $168.51 | 31% |
| Mas'ade | 19 | $1,515 | $252.95 | 18% |