Chabtine Airbnb Market Analysis 2025: Short Term Rental Data & Vacation Rental Statistics in North Governorate, Lebanon
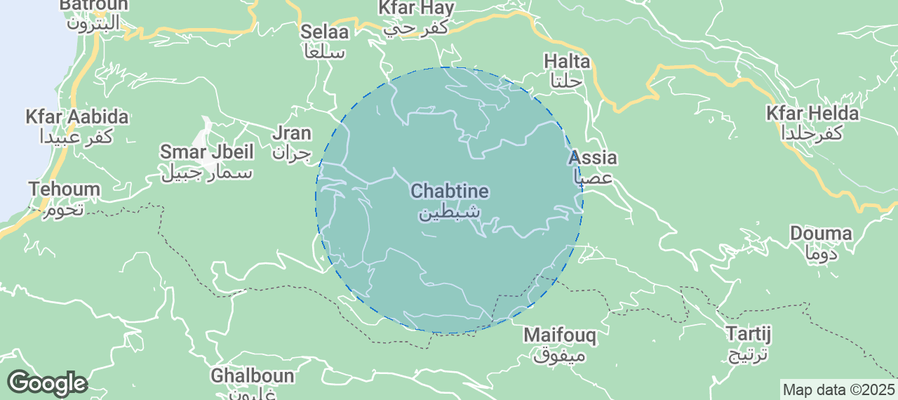
Is Airbnb profitable in Chabtine in 2025? Explore comprehensive Airbnb analytics for Chabtine, North Governorate, Lebanon to uncover income potential. This 2025 STR market report for Chabtine, based on AirROI data from May 2024 to April 2025, reveals key trends in the niche market of 19 active listings.
Whether you're considering an Airbnb investment in Chabtine, optimizing your existing vacation rental, or exploring rental arbitrage opportunities, understanding the Chabtine Airbnb data is crucial. Leveraging the low regulation environment is key to maximizing your short term rental income potential. Let's dive into the specifics.
Key Chabtine Airbnb Performance Metrics Overview
Monthly Airbnb Revenue Variations & Income Potential in Chabtine (2025)
Understanding the monthly revenue variations for Airbnb listings in Chabtine is key to maximizing your short term rental income potential. Seasonality significantly impacts earnings. Our analysis, based on data from the past 12 months, shows that the peak revenue month for STRs in Chabtine is typically May, while February often presents the lowest earnings, highlighting opportunities for strategic pricing adjustments during shoulder and low seasons. Explore the typical Airbnb income in Chabtine across different performance tiers:
- Best-in-class properties (Top 10%) achieve $8,011+ monthly, often utilizing dynamic pricing and superior guest experiences.
- Strong performing properties (Top 25%) earn $5,829 or more, indicating effective management and desirable locations/amenities.
- Typical properties (Median) generate around $1,889 per month, representing the average market performance.
- Entry-level properties (Bottom 25%) see earnings around $945, often with potential for optimization.
Average Monthly Airbnb Earnings Trend in Chabtine
Chabtine Airbnb Occupancy Rate Trends (2025)
Maximize your bookings by understanding the Chabtine STR occupancy trends. Seasonal demand shifts significantly influence how often properties are booked. Typically, Octobersees the highest demand (peak season occupancy), while December experiences the lowest (low season). Effective strategies, like adjusting minimum stays or offering promotions, can boost occupancy during slower periods. Here's how different property tiers perform in Chabtine:
- Best-in-class properties (Top 10%) achieve 46%+ occupancy, indicating high desirability and potentially optimized availability.
- Strong performing properties (Top 25%) maintain 36% or higher occupancy, suggesting good market fit and guest satisfaction.
- Typical properties (Median) have an occupancy rate around 17%.
- Entry-level properties (Bottom 25%) average 12% occupancy, potentially facing higher vacancy.
Average Monthly Occupancy Rate Trend in Chabtine
Average Daily Rate (ADR) Airbnb Trends in Chabtine (2025)
Effective short term rental pricing strategy in Chabtine involves understanding monthly ADR fluctuations. The Average Daily Rate (ADR) for Airbnb in Chabtine typically peaks in December and dips lowest during October. Leveraging Airbnb dynamic pricing tools or strategies based on this seasonality can significantly boost revenue. Here's a look at the typical nightly rates achieved:
- Best-in-class properties (Top 10%) command rates of $383+ per night, often due to premium features or locations.
- Strong performing properties (Top 25%) achieve nightly rates of $321 or more.
- Typical properties (Median) charge around $152 per night.
- Entry-level properties (Bottom 25%) earn around $92 per night.
Average Daily Rate (ADR) Trend by Month in Chabtine
Get Live Chabtine Market Intelligence 👇
Explore Real-time Analytics
Airbnb Seasonality Analysis & Trends in Chabtine (2025)
Peak Season (May, October, June)
- Revenue averages $6,537 per month
- Occupancy rates average 29.9%
- Daily rates average $188
Shoulder Season
- Revenue averages $3,392 per month
- Occupancy maintains around 29.1%
- Daily rates hold near $192
Low Season (February, April, December)
- Revenue drops to average $847 per month
- Occupancy decreases to average 12.8%
- Daily rates adjust to average $199
Seasonality Insights for Chabtine
- The Airbnb seasonality in Chabtine shows highly seasonal trends requiring careful strategy. While the sections above show seasonal averages, it's also insightful to look at the extremes:
- During the high season, the absolute peak month showcases Chabtine's highest earning potential, with monthly revenues capable of climbing to $7,049, occupancy reaching a high of 54.8%, and ADRs peaking at $205.
- Conversely, the slowest single month of the year, typically falling within the low season, marks the market's lowest point. In this month, revenue might dip to $724, occupancy could drop to 7.5%, and ADRs may adjust down to $184.
- Understanding both the seasonal averages and these monthly peaks and troughs in revenue, occupancy, and ADR is crucial for maximizing your Airbnb profit potential in Chabtine.
Seasonal Strategies for Maximizing Profit
- Peak Season: Maximize revenue through premium pricing and potentially longer minimum stays. Ensure high availability.
- Low Season: Offer competitive pricing, special promotions (e.g., extended stay discounts), and flexible cancellation policies. Target off-season travelers like remote workers or budget-conscious guests.
- Shoulder Seasons: Implement dynamic pricing that balances peak and low rates. Target weekend travelers or specific events. Offer slightly more flexible terms than peak season.
- Regularly analyze your own performance against these Chabtine seasonality benchmarks and adjust your pricing and availability strategy accordingly.
Best Areas for Airbnb Investment in Chabtine (2025)
Exploring the top neighborhoods for short-term rentals in Chabtine? This section highlights key areas, outlining why they are attractive for hosts and guests, along with notable local attractions. Consider these locations based on your target guest profile and investment strategy.
| Neighborhood / Area | Why Host Here? (Target Guests & Appeal) | Key Attractions & Landmarks |
|---|---|---|
| Batroun | Charming coastal town known for its stunning seafront views and rich history. A favorite among beach lovers and tourists seeking a relaxing getaway. | Batroun Beach, Old Batroun, Saint George Cathedral, Batroun Fishing Port, White Beach, Dive Center Batroun |
| Byblos | One of the oldest continuously inhabited cities in the world, known for its historic ruins and beautiful coastal scenery. Attracts history buffs and tourists seeking cultural experiences. | Byblos Castle, Old Souk of Byblos, Byblos Archaeological Museum, The Phoenician Wall, Byblos Port, Jbeil Beach |
| Tripoli | Lebanon's second-largest city with a rich history and medieval architecture. An emerging destination for those looking to explore authentic Lebanese culture. | Tripoli Citadel, El Mina Beach, The Great Mosque of Tripoli, Soap Museum, Turtle Rock, Traditional Souks |
| Ehden | A picturesque mountain resort town known for its stunning landscapes and cool climate, perfect for those seeking a scenic retreat. | Qadisha Valley, Ehden Nature Reserve, Saint Mary Church, Kfaryabda, Hiking Trails, Lebanon Cedar Trees |
| Zgharta | Known for its beautiful nature and proximity to the mountains, Zgharta attracts those interested in outdoor activities and cultural experiences. | Zgharta Mountain, Saint Hilaire Monastery, Local wineries, Hiking trails, Scenic views, Traditional Lebanese food |
| Bsharri | Nestled in the mountains, Bsharri is famous for its breathtaking views and cultural significance, being the birthplace of Khalil Gibran. | Khalil Gibran Museum, Cedars of God, Bsharri Heritage Museum, Qadisha Valley, Hiking Trails, Scenic picnics |
| Kaslik | A vibrant area close to Jounieh known for its nightlife and shopping, appealing to both tourists and locals looking for entertainment. | Kaslik Beach, Shopping Malls, Nightclubs, Restaurants, Lebanese Cuisine, Water Sports |
| Jounieh | Famous for its scenic coastline and nightlife, making it a hot spot for both tourists and locals, with beautiful views of the Mediterranean. | Jounieh Bay, Teleferique, Our Lady of Lebanon, Nightclubs, Beaches, Marina |
Understanding Airbnb License Requirements & STR Laws in Chabtine (2025)
While Chabtine, North Governorate, Lebanon currently shows low STR regulations, specific Airbnb license requirements might still exist or change. Always verify the latest short term rental regulations and Airbnb license requirements directly with local government authorities for Chabtine to ensure full compliance before hosting.
(Source: AirROI data, 2025, finding no licensed listings among those analyzed)
Top Performing Airbnb Properties in Chabtine (2025)
Benchmark your potential! Explore examples of top-performing Airbnb properties in Chabtinebased on Trailing Twelve Month (TTM) revenue. Analyze their characteristics, revenue, occupancy rate, and ADR to understand what drives success in this market.
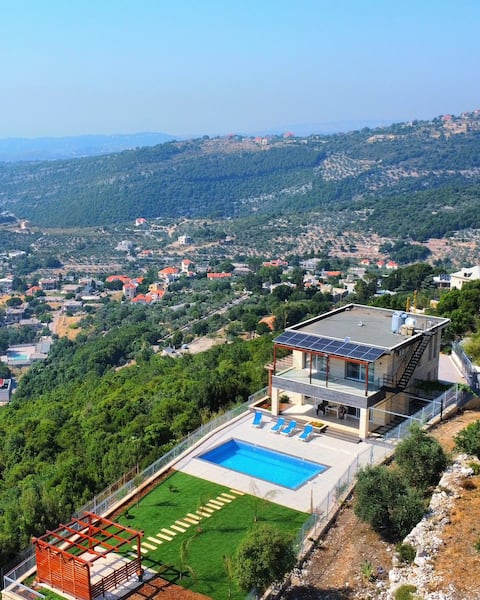
3 Bedroom Villa w/Pool
Entire Place • 3 bedrooms

4 Bdr Private Villa w/Pool | Lebanon rental
Entire Place • 4 bedrooms
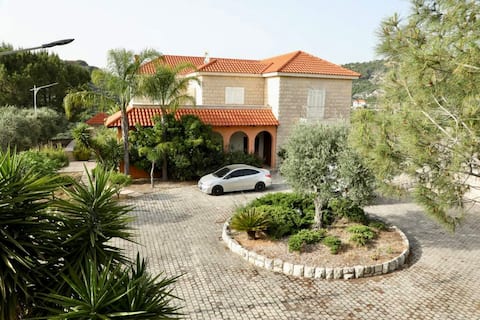
Villa with private pool for rent
Entire Place • 4 bedrooms

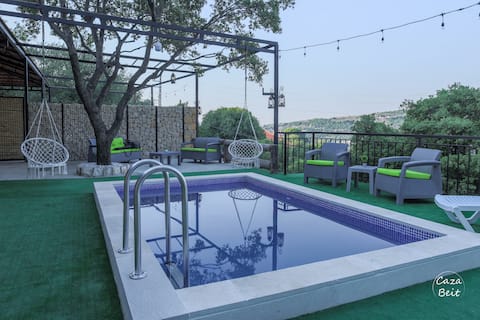
PrivatePool-BatrounMountains
Entire Place • 4 bedrooms

Najem Rental
Entire Place • 3 bedrooms
Oak Big
Entire Place • 2 bedrooms
Note: Performance varies based on location, size, amenities, seasonality, and management quality. Data reflects the past 12 months.
Top Performing Airbnb Hosts in Chabtine (2025)
Learn from the best! This table showcases top-performing Airbnb hosts in Chabtine based on the number of properties managed and estimated total revenue over the past year. Analyze their scale and performance metrics.
| Host Name | Properties | Grossing Revenue | Stay Reviews | Avg Rating |
|---|---|---|---|---|
| Host #414136490 | 8 | $140,979 | 1 | 0.00/5.0 |
| Host #555840480 | 2 | $34,001 | 0 | 0.00/5.0 |
| Host #290763266 | 1 | $29,689 | 0 | 0.00/5.0 |
| Host #361233908 | 1 | $28,922 | 0 | 0.00/5.0 |
| Host #498104630 | 1 | $25,384 | 0 | 0.00/5.0 |
| Host #951197 | 1 | $21,207 | 0 | 0.00/5.0 |
| Assaad B | 1 | $16,434 | 10 | 5.00/5.0 |
| Marc | 1 | $8,335 | 17 | 4.71/5.0 |
| Dalia | 1 | $8,074 | 4 | 5.00/5.0 |
| Marie Joe | 1 | $6,405 | 3 | 4.67/5.0 |
Analyzing the strategies of top hosts, such as their property selection, pricing, and guest communication, can offer valuable lessons for optimizing your own Airbnb operations in Chabtine.
Dive Deeper: Advanced Chabtine STR Market Data (2025)
Ready to unlock more insights? AirROI provides access to advanced metrics and comprehensive Airbnb data for Chabtine. Explore detailed analytics beyond this report to refine your investment strategy, optimize pricing, and maximize your vacation rental profits.
Explore Advanced MetricsChabtine Short-Term Rental Market Composition (2025): Property & Room Types
Room Type Distribution
Property Type Distribution
Market Composition Insights for Chabtine
- The Chabtine Airbnb market composition is heavily skewed towards Entire Home/Apt listings, which make up 100% of the 19 active rentals. This indicates strong guest preference for privacy and space.
- Looking at the property type distribution in Chabtine, House properties are the most common (57.9%), reflecting the local real estate landscape.
- Houses represent a significant 57.9% portion, catering likely to families or larger groups.
- The presence of 31.6% Hotel/Boutique listings indicates integration with traditional hospitality.
Chabtine Airbnb Room Capacity Analysis (2025): Bedroom Distribution
Distribution of Listings by Number of Bedrooms
Room Capacity Insights for Chabtine
- The dominant room capacity in Chabtine is 1 bedroom listings, making up 42.1% of the market. This suggests a strong demand for properties suitable for couples or solo travelers.
- Together, 1 bedroom and 3 bedrooms properties represent 63.2% of the active Airbnb listings in Chabtine, indicating a high concentration in these sizes.
- A significant 36.9% of listings offer 3+ bedrooms, catering to larger groups and families seeking more space in Chabtine.
Chabtine Vacation Rental Guest Capacity Trends (2025)
Distribution of Listings by Guest Capacity
Guest Capacity Insights for Chabtine
- The most common guest capacity trend in Chabtine vacation rentals is listings accommodating 8+ guests (36.8%). This suggests the primary traveler segment is likely larger groups.
- Properties designed for 8+ guests and 6 guests dominate the Chabtine STR market, accounting for 63.1% of listings.
- 63.1% of properties accommodate 6+ guests, serving the market segment for larger families or group travel in Chabtine.
- On average, properties in Chabtine are equipped to host 5.9 guests.
Chabtine Airbnb Booking Patterns (2025): Available vs. Booked Days
Available Days Distribution
Booked Days Distribution
Booking Pattern Insights for Chabtine
- The most common availability pattern in Chabtine falls within the 271-366 days range, representing 94.7% of listings. This suggests many properties have significant open periods on their calendars.
- Approximately 100.0% of listings show high availability (181+ days open annually), indicating potential for increased bookings or specific owner usage patterns.
- For booked days, the 31-90 days range is most frequent in Chabtine (94.7%), reflecting common guest stay durations or potential owner blocking patterns.
Chabtine Airbnb Minimum Stay Requirements Analysis
Distribution of Listings by Minimum Night Requirement
1 Night
17 listings
100% of total
Key Insights
- The most prevalent minimum stay requirement in Chabtine is 1 Night, adopted by 100% of listings. This highlights the market's preference for shorter, flexible bookings.
- A strong majority (100.0%) of the Chabtine Airbnb data shows acceptance of very short stays (1-2 nights), indicating a dynamic, high-turnover market.
Recommendations
- Align with the market by considering a 1 Night minimum stay, as 100% of Chabtine hosts use this setting.
- Adjust minimum nights based on seasonality – potentially shorter during low season and longer during peak demand periods in Chabtine.
Chabtine Airbnb Cancellation Policy Trends Analysis (2025)
Flexible
1 listings
25% of total
Moderate
3 listings
75% of total
Cancellation Policy Insights for Chabtine
- The prevailing Airbnb cancellation policy trend in Chabtine is Moderate, used by 75% of listings.
- The market strongly favors guest-friendly terms, with 100.0% of listings offering Flexible or Moderate policies. This suggests guests in Chabtine may expect booking flexibility.
Recommendations for Hosts
- Consider adopting a Moderate policy to align with the 75% market standard in Chabtine.
- Regularly review your cancellation policy against competitors and market demand shifts in Chabtine.
Chabtine STR Booking Lead Time Analysis (2025)
Average Booking Lead Time by Month
Booking Lead Time Insights for Chabtine
- The overall average booking lead time for vacation rentals in Chabtine is 11 days.
- Guests book furthest in advance for stays during August (average 19 days), likely coinciding with peak travel demand or local events.
- The shortest booking windows occur for stays in May (average 4 days), indicating more last-minute travel plans during this time.
- Seasonally, Summer (14 days avg.) sees the longest lead times, while Fall (8 days avg.) has the shortest, reflecting typical travel planning cycles.
Recommendations for Hosts
- Use the overall average lead time (11 days) as a baseline for your pricing and availability strategy in Chabtine.
- Target marketing efforts for the Summer season well in advance (at least 14 days) to capture early planners.
- Monitor your own booking lead times against these Chabtine averages to identify opportunities for dynamic pricing adjustments.
Popular & Essential Airbnb Amenities in Chabtine (2025)
Amenity Prevalence
Amenity Insights for Chabtine
- Essential amenities in Chabtine that guests expect include: TV, Hot water, Wifi, Heating, Free parking on premises, Essentials. Lacking these (any) could significantly impact bookings.
- Popular amenities like Air conditioning, Washer, Kitchen are common but not universal. Offering these can provide a competitive edge.
Recommendations for Hosts
- Ensure your listing includes all essential amenities for Chabtine: TV, Hot water, Wifi, Heating, Free parking on premises, Essentials.
- Consider adding popular differentiators like Air conditioning or Washer to increase appeal.
- Highlight unique or less common amenities you offer (e.g., hot tub, dedicated workspace, EV charger) in your listing description and photos.
- Regularly check competitor amenities in Chabtine to stay competitive.
Chabtine Airbnb Guest Demographics & Profile Analysis (2025)
Guest Profile Summary for Chabtine
- The typical guest profile for Airbnb in Chabtine consists of a mix of domestic (50%) and international guests, with top international origins including United States, typically belonging to the Post-2000s (Gen Z/Alpha) group (50%), primarily speaking English or Arabic.
- Domestic travelers account for 50.0% of guests.
- Key international markets include Lebanon (50%) and United States (16.7%).
- Top languages spoken are English (36.8%) followed by Arabic (31.6%).
- A significant demographic segment is the Post-2000s (Gen Z/Alpha) group, representing 50% of guests.
Recommendations for Hosts
- Balance marketing efforts between domestic and international channels based on the guest mix.
- Tailor amenities and listing descriptions to appeal to the dominant Post-2000s (Gen Z/Alpha) demographic (e.g., highlight fast WiFi, smart home features, local guides).
- Highlight unique local experiences or amenities relevant to the primary guest profile.
- Consider seasonal promotions aligned with peak travel times for key origin markets.
Nearby Short-Term Rental Market Comparison
How does the Chabtine Airbnb market stack up against its neighbors? Compare key performance metrics like average monthly revenue, ADR, and occupancy rates in surrounding areas to understand the broader regional STR landscape.
| Market | Active Properties | Monthly Revenue | Daily Rate | Avg. Occupancy |
|---|---|---|---|---|
| Aannaya | 20 | $2,814 | $371.02 | 19% |
| Shlomi | 10 | $2,521 | $499.60 | 16% |
| Paralimni | 1,172 | $2,278 | $231.74 | 41% |
| Maale Yosef Regional Council | 77 | $1,941 | $426.64 | 22% |
| Mayrouba | 21 | $1,725 | $180.09 | 28% |
| Baabdat | 10 | $1,610 | $205.08 | 28% |
| Mtain | 11 | $1,604 | $281.61 | 17% |
| Eddeh | 12 | $1,571 | $211.77 | 24% |
| Mar Maroun | 29 | $1,537 | $168.51 | 31% |
| Mas'ade | 19 | $1,515 | $252.95 | 18% |