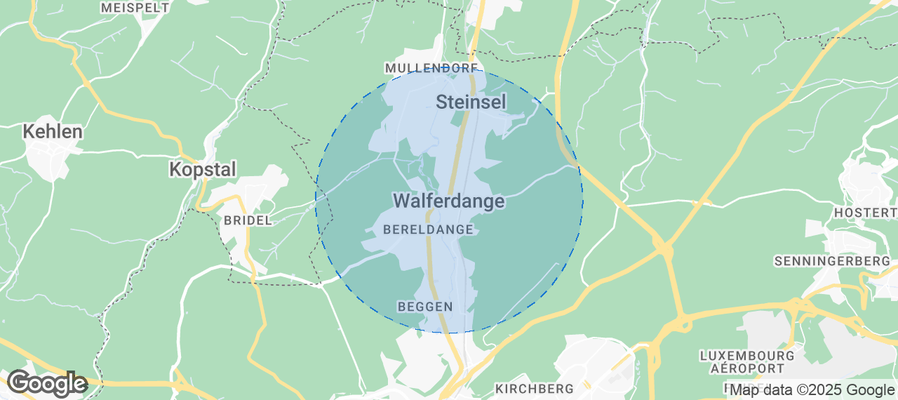
Walferdange Airbnb Market Analysis 2026: Short Term Rental Data & Vacation Rental Statistics in Canton Luxembourg, Luxembourg
Is Airbnb profitable in Walferdange in 2026? Explore comprehensive Airbnb analytics for Walferdange, Canton Luxembourg, Luxembourg to uncover income potential. This 2026 STR market report for Walferdange, based on AirROI data from July 2024 to June 2025, reveals key trends in the niche market of 18 active listings.
Whether you're considering an Airbnb investment in Walferdange, optimizing your existing vacation rental, or exploring rental arbitrage opportunities, understanding the Walferdange Airbnb data is crucial. Leveraging the low regulation environment is key to maximizing your short term rental income potential. Let's dive into the specifics.
Key Walferdange Airbnb Performance Metrics Overview
Monthly Airbnb Revenue Variations & Income Potential in Walferdange (2026)
Understanding the monthly revenue variations for Airbnb listings in Walferdange is key to maximizing your short term rental income potential. Seasonality significantly impacts earnings. Our analysis, based on data from the past 12 months, shows that the peak revenue month for STRs in Walferdange is typically May, while November often presents the lowest earnings, highlighting opportunities for strategic pricing adjustments during shoulder and low seasons. Explore the typical Airbnb income in Walferdange across different performance tiers:
- Best-in-class properties (Top 10%) achieve $2,034+ monthly, often utilizing dynamic pricing and superior guest experiences.
- Strong performing properties (Top 25%) earn $1,457 or more, indicating effective management and desirable locations/amenities.
- Typical properties (Median) generate around $1,019 per month, representing the average market performance.
- Entry-level properties (Bottom 25%) see earnings around $730, often with potential for optimization.
Average Monthly Airbnb Earnings Trend in Walferdange
Walferdange Airbnb Occupancy Rate Trends (2026)
Maximize your bookings by understanding the Walferdange STR occupancy trends. Seasonal demand shifts significantly influence how often properties are booked. Typically, Maysees the highest demand (peak season occupancy), while November experiences the lowest (low season). Effective strategies, like adjusting minimum stays or offering promotions, can boost occupancy during slower periods. Here's how different property tiers perform in Walferdange:
- Best-in-class properties (Top 10%) achieve 76%+ occupancy, indicating high desirability and potentially optimized availability.
- Strong performing properties (Top 25%) maintain 63% or higher occupancy, suggesting good market fit and guest satisfaction.
- Typical properties (Median) have an occupancy rate around 51%.
- Entry-level properties (Bottom 25%) average 38% occupancy, potentially facing higher vacancy.
Average Monthly Occupancy Rate Trend in Walferdange
Average Daily Rate (ADR) Airbnb Trends in Walferdange (2026)
Effective short term rental pricing strategy in Walferdange involves understanding monthly ADR fluctuations. The Average Daily Rate (ADR) for Airbnb in Walferdange typically peaks in June and dips lowest during January. Leveraging Airbnb dynamic pricing tools or strategies based on this seasonality can significantly boost revenue. Here's a look at the typical nightly rates achieved:
- Best-in-class properties (Top 10%) command rates of $130+ per night, often due to premium features or locations.
- Strong performing properties (Top 25%) achieve nightly rates of $74 or more.
- Typical properties (Median) charge around $55 per night.
- Entry-level properties (Bottom 25%) earn around $33 per night.
Average Daily Rate (ADR) Trend by Month in Walferdange
Get Live Walferdange Market Intelligence 👇
Explore Real-time Analytics
Airbnb Seasonality Analysis & Trends in Walferdange (2025)
Peak Season (May, July, March)
- Revenue averages $1,591 per month
- Occupancy rates average 66.5%
- Daily rates average $72
Shoulder Season
- Revenue averages $1,166 per month
- Occupancy maintains around 51.2%
- Daily rates hold near $72
Low Season (August, November, December)
- Revenue drops to average $747 per month
- Occupancy decreases to average 35.3%
- Daily rates adjust to average $69
Seasonality Insights for Walferdange
- The Airbnb seasonality in Walferdange shows highly seasonal trends requiring careful strategy. While the sections above show seasonal averages, it's also insightful to look at the extremes:
- During the high season, the absolute peak month showcases Walferdange's highest earning potential, with monthly revenues capable of climbing to $1,738, occupancy reaching a high of 74.2%, and ADRs peaking at $79.
- Conversely, the slowest single month of the year, typically falling within the low season, marks the market's lowest point. In this month, revenue might dip to $493, occupancy could drop to 14.5%, and ADRs may adjust down to $68.
- Understanding both the seasonal averages and these monthly peaks and troughs in revenue, occupancy, and ADR is crucial for maximizing your Airbnb profit potential in Walferdange.
Seasonal Strategies for Maximizing Profit
- Peak Season: Maximize revenue through premium pricing and potentially longer minimum stays. Ensure high availability.
- Low Season: Offer competitive pricing, special promotions (e.g., extended stay discounts), and flexible cancellation policies. Target off-season travelers like remote workers or budget-conscious guests.
- Shoulder Seasons: Implement dynamic pricing that balances peak and low rates. Target weekend travelers or specific events. Offer slightly more flexible terms than peak season.
- Regularly analyze your own performance against these Walferdange seasonality benchmarks and adjust your pricing and availability strategy accordingly.
Best Areas for Airbnb Investment in Walferdange (2026)
Exploring the top neighborhoods for short-term rentals in Walferdange? This section highlights key areas, outlining why they are attractive for hosts and guests, along with notable local attractions. Consider these locations based on your target guest profile and investment strategy.
| Neighborhood / Area | Why Host Here? (Target Guests & Appeal) | Key Attractions & Landmarks |
|---|---|---|
| Walferdange Center | A charming area with local shops and eateries, perfect for families and travelers seeking a relaxing atmosphere while staying close to Luxembourg City. | Walferdange Castle, Local parks, Restaurants and cafes, Cultural events, Proximity to public transport |
| Cultural District | This area is rich in history and culture, attracting tourists who appreciate museums, galleries, and historical sites, making it a prime investment for short stays. | National Museum of History and Art, Grand Ducal Palace, Luxembourg City History Museum, Philharmonie Luxembourg, Various art galleries |
| Utopia | A trendy neighborhood known for its vibrant nightlife and dining options, appealing to younger tourists and groups looking for entertainment and social activity. | Bars and clubs, Restaurants of diverse cuisines, Cafes and coffee shops, Public art installations, Local markets |
| Bridel | A picturesque suburb known for its green spaces and family-friendly environment, ideal for longer-term rentals for families visiting the area. | Parks and playgrounds, Local schools, Cycling paths, Community events in parks |
| Hesperange | Located close to outdoor recreational areas, this region appeals to nature lovers and those seeking active holidays, capturing a niche market for Airbnb. | Nature parks, Hiking and biking trails, Scenic views of the countryside |
| Niederanven | A peaceful village ambiance combined with proximity to the airport and important transport links, making it convenient for business travelers and tourists alike. | Luxembourg Airport, Local amenities, Parks and recreation, Public transportation access |
| Howald | A vibrant neighborhood known for its local community feel and wide range of shopping and dining options, which attracts a variety of visitors. | Shopping centers, Local restaurants and cafes, Art exhibitions, Community parks |
| Findel | Close to Luxembourg's international airport and well connected by public transport, this area is ideal for short-term stays for international travelers. | Luxembourg Airport, Public transport links, Nearby parks, Shopping options |
Understanding Airbnb License Requirements & STR Laws in Walferdange (2026)
While Walferdange, Canton Luxembourg, Luxembourg currently shows low STR regulations, specific Airbnb license requirements might still exist or change. Always verify the latest short term rental regulations and Airbnb license requirements directly with local government authorities for Walferdange to ensure full compliance before hosting.
(Source: AirROI data, 2026, based on 6% licensed listings)
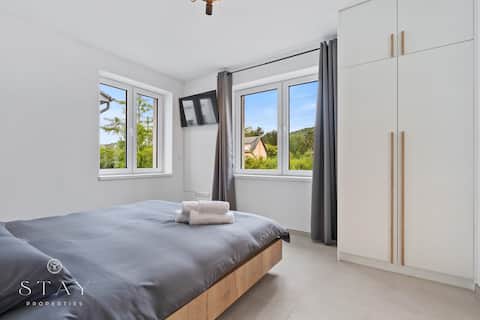
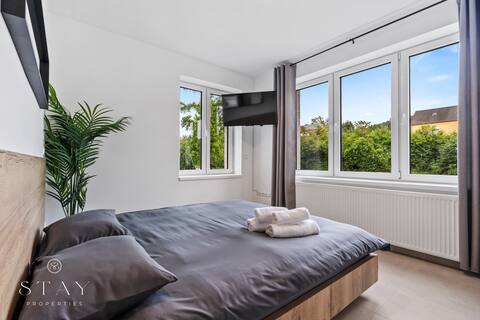
Top Performing Airbnb Properties in Walferdange (2026)
Benchmark your potential! Explore examples of top-performing Airbnb properties in Walferdangebased on Trailing Twelve Month (TTM) revenue. Analyze their characteristics, revenue, occupancy rate, and ADR to understand what drives success in this market.
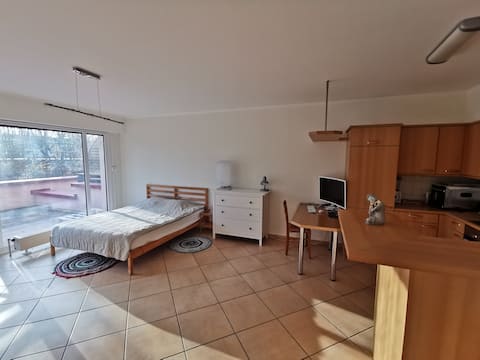
Studio with large bed in Steinsel
Entire Place • 1 bedroom

Room with privat bathroom in Walferdange
Private Room • N/A
Room with privat bathroom in Walferdange
Private Room • N/A

Private room in Luxembourg
Private Room • N/A
Room in Walferdange
Private Room • N/A
Room in Walferdange
Private Room • N/A
Note: Performance varies based on location, size, amenities, seasonality, and management quality. Data reflects the past 12 months.
Top Performing Airbnb Hosts in Walferdange (2026)
Learn from the best! This table showcases top-performing Airbnb hosts in Walferdange based on the number of properties managed and estimated total revenue over the past year. Analyze their scale and performance metrics.
| Host Name | Properties | Grossing Revenue | Stay Reviews | Avg Rating |
|---|---|---|---|---|
| Stay | 6 | $63,499 | 201 | 4.51/5.0 |
| Serguei | 1 | $21,279 | 7 | 5.00/5.0 |
| Lidia | 1 | $11,821 | 50 | 4.92/5.0 |
| Joëlle | 1 | $5,993 | 2 | Not Rated |
| Accommodations For You | 5 | $5,645 | 8 | 3.67/5.0 |
| Poussard | 1 | $4,178 | 2 | Not Rated |
| Mike | 3 | $1,750 | 16 | 4.09/5.0 |
Analyzing the strategies of top hosts, such as their property selection, pricing, and guest communication, can offer valuable lessons for optimizing your own Airbnb operations in Walferdange.
Dive Deeper: Advanced Walferdange STR Market Data (2026)
Ready to unlock more insights? AirROI provides access to advanced metrics and comprehensive Airbnb data for Walferdange. Explore detailed analytics beyond this report to refine your investment strategy, optimize pricing, and maximize your vacation rental profits.
Explore Advanced MetricsWalferdange Short-Term Rental Market Composition (2026): Property & Room Types
Room Type Distribution
Property Type Distribution
Market Composition Insights for Walferdange
- The Walferdange Airbnb market composition is heavily skewed towards Private Room listings, which make up 88.9% of the 18 active rentals. This indicates strong guest preference for privacy and space.
- Looking at the property type distribution in Walferdange, House properties are the most common (72.2%), reflecting the local real estate landscape.
- Houses represent a significant 72.2% portion, catering likely to families or larger groups.
- The presence of 11.1% Hotel/Boutique listings indicates integration with traditional hospitality.
Walferdange Airbnb Room Capacity Analysis (2026): Bedroom Distribution
Distribution of Listings by Number of Bedrooms
Room Capacity Insights for Walferdange
- The dominant room capacity in Walferdange is 1 bedroom listings, making up 33.3% of the market. This suggests a strong demand for properties suitable for couples or solo travelers.
Walferdange Vacation Rental Guest Capacity Trends (2026)
Distribution of Listings by Guest Capacity
Guest Capacity Insights for Walferdange
- The most common guest capacity trend in Walferdange vacation rentals is listings accommodating 1 guest (16.7%). This suggests the primary traveler segment is likely couples or solo travelers.
- Properties designed for 1 guest and 2 guests dominate the Walferdange STR market, accounting for 27.8% of listings.
- On average, properties in Walferdange are equipped to host 0.6 guests.
Walferdange Airbnb Booking Patterns (2026): Available vs. Booked Days
Available Days Distribution
Booked Days Distribution
Booking Pattern Insights for Walferdange
- The most common availability pattern in Walferdange falls within the 271-366 days range, representing 55.6% of listings. This suggests many properties have significant open periods on their calendars.
- Approximately 88.9% of listings show high availability (181+ days open annually), indicating potential for increased bookings or specific owner usage patterns.
- For booked days, the 91-180 days range is most frequent in Walferdange (33.3%), reflecting common guest stay durations or potential owner blocking patterns.
- A notable 11.1% of properties secure long booking periods (181+ days booked per year), highlighting successful long-term rental strategies or significant owner usage.
Walferdange Airbnb Minimum Stay Requirements Analysis
Distribution of Listings by Minimum Night Requirement
1 Night
7 listings
38.9% of total
2 Nights
1 listings
5.6% of total
3 Nights
1 listings
5.6% of total
4-6 Nights
4 listings
22.2% of total
7-29 Nights
4 listings
22.2% of total
30+ Nights
1 listings
5.6% of total
Key Insights
- The most prevalent minimum stay requirement in Walferdange is 1 Night, adopted by 38.9% of listings. This highlights the market's preference for shorter, flexible bookings.
Recommendations
- Align with the market by considering a 1 Night minimum stay, as 38.9% of Walferdange hosts use this setting.
- Explore offering discounts for stays of 30+ nights to attract the 5.6% of the market seeking extended stays.
- Adjust minimum nights based on seasonality – potentially shorter during low season and longer during peak demand periods in Walferdange.
Walferdange Airbnb Cancellation Policy Trends Analysis (2026)
Flexible
1 listings
5.6% of total
Moderate
6 listings
33.3% of total
Firm
2 listings
11.1% of total
Strict
9 listings
50% of total
Cancellation Policy Insights for Walferdange
- The prevailing Airbnb cancellation policy trend in Walferdange is Strict, used by 50% of listings.
- A majority (61.1%) of hosts in Walferdange utilize Firm or Strict policies, indicating a market where hosts prioritize booking security.
Recommendations for Hosts
- Consider adopting a Strict policy to align with the 50% market standard in Walferdange.
- With 50% using Strict terms, this is a viable option in Walferdange, particularly for high-value properties or during peak demand periods.
- Regularly review your cancellation policy against competitors and market demand shifts in Walferdange.
Walferdange STR Booking Lead Time Analysis (2026)
Average Booking Lead Time by Month
Booking Lead Time Insights for Walferdange
- The overall average booking lead time for vacation rentals in Walferdange is 19 days.
- Guests book furthest in advance for stays during October (average 78 days), likely coinciding with peak travel demand or local events.
- The shortest booking windows occur for stays in March (average 14 days), indicating more last-minute travel plans during this time.
- Seasonally, Fall (41 days avg.) sees the longest lead times, while Winter (27 days avg.) has the shortest, reflecting typical travel planning cycles.
Recommendations for Hosts
- Use the overall average lead time (19 days) as a baseline for your pricing and availability strategy in Walferdange.
- For October stays, consider implementing length-of-stay discounts or slightly higher rates for bookings made less than 78 days out to capitalize on advance planning.
- Target marketing efforts for the Fall season well in advance (at least 41 days) to capture early planners.
- Monitor your own booking lead times against these Walferdange averages to identify opportunities for dynamic pricing adjustments.
Popular & Essential Airbnb Amenities in Walferdange (2026)
Amenity data is currently unavailable for Walferdange.
Walferdange Airbnb Guest Demographics & Profile Analysis (2026)
Guest Profile Summary for Walferdange
- The typical guest profile for Airbnb in Walferdange consists of predominantly international visitors (97%), with top international origins including France, typically belonging to the Post-2000s (Gen Z/Alpha) group (50%), primarily speaking English or German.
- Domestic travelers account for 3.5% of guests.
- Key international markets include Germany (23.3%) and France (19.8%).
- Top languages spoken are English (36.5%) followed by German (16%).
- A significant demographic segment is the Post-2000s (Gen Z/Alpha) group, representing 50% of guests.
Recommendations for Hosts
- Focus marketing internationally, particularly towards travelers from France.
- Tailor amenities and listing descriptions to appeal to the dominant Post-2000s (Gen Z/Alpha) demographic (e.g., highlight fast WiFi, smart home features, local guides).
- Highlight unique local experiences or amenities relevant to the primary guest profile.
- Consider seasonal promotions aligned with peak travel times for key origin markets.
Nearby Short-Term Rental Market Comparison
How does the Walferdange Airbnb market stack up against its neighbors? Compare key performance metrics like average monthly revenue, ADR, and occupancy rates in surrounding areas to understand the broader regional STR landscape.
| Market | Active Properties | Monthly Revenue | Daily Rate | Avg. Occupancy |
|---|---|---|---|---|
| Wellin | 10 | $4,032 | $262.28 | 45% |
| Bertogne | 26 | $3,813 | $294.96 | 42% |
| Ittenheim | 21 | $3,787 | $250.03 | 41% |
| Aubel | 29 | $3,780 | $268.08 | 44% |
| Samrée | 17 | $3,473 | $383.54 | 30% |
| Heers | 24 | $3,319 | $313.77 | 36% |
| Le Valtin | 16 | $3,243 | $333.61 | 41% |
| La Forge | 12 | $3,215 | $324.78 | 42% |
| Marcourt | 20 | $3,157 | $367.06 | 37% |
| Furdenheim | 21 | $3,153 | $366.84 | 47% |