Gua Musang Airbnb Market Analysis 2025: Short Term Rental Data & Vacation Rental Statistics in Kelantan, Malaysia
Is Airbnb profitable in Gua Musang in 2025? Explore comprehensive Airbnb analytics for Gua Musang, Kelantan, Malaysia to uncover income potential. This 2025 STR market report for Gua Musang, based on AirROI data from November 2024 to October 2025, reveals key trends in the niche market of 18 active listings.
Whether you're considering an Airbnb investment in Gua Musang, optimizing your existing vacation rental, or exploring rental arbitrage opportunities, understanding the Gua Musang Airbnb data is crucial. Leveraging the low regulation environment is key to maximizing your short term rental income potential. Let's dive into the specifics.
Key Gua Musang Airbnb Performance Metrics Overview
Monthly Airbnb Revenue Variations & Income Potential in Gua Musang (2025)
Understanding the monthly revenue variations for Airbnb listings in Gua Musang is key to maximizing your short term rental income potential. Seasonality significantly impacts earnings. Our analysis, based on data from the past 12 months, shows that the peak revenue month for STRs in Gua Musang is typically January, while July often presents the lowest earnings, highlighting opportunities for strategic pricing adjustments during shoulder and low seasons. Explore the typical Airbnb income in Gua Musang across different performance tiers:
- Best-in-class properties (Top 10%) achieve $490+ monthly, often utilizing dynamic pricing and superior guest experiences.
- Strong performing properties (Top 25%) earn $294 or more, indicating effective management and desirable locations/amenities.
- Typical properties (Median) generate around $169 per month, representing the average market performance.
- Entry-level properties (Bottom 25%) see earnings around $107, often with potential for optimization.
Average Monthly Airbnb Earnings Trend in Gua Musang
Gua Musang Airbnb Occupancy Rate Trends (2025)
Maximize your bookings by understanding the Gua Musang STR occupancy trends. Seasonal demand shifts significantly influence how often properties are booked. Typically, Decembersees the highest demand (peak season occupancy), while October experiences the lowest (low season). Effective strategies, like adjusting minimum stays or offering promotions, can boost occupancy during slower periods. Here's how different property tiers perform in Gua Musang:
- Best-in-class properties (Top 10%) achieve 30%+ occupancy, indicating high desirability and potentially optimized availability.
- Strong performing properties (Top 25%) maintain 23% or higher occupancy, suggesting good market fit and guest satisfaction.
- Typical properties (Median) have an occupancy rate around 15%.
- Entry-level properties (Bottom 25%) average 9% occupancy, potentially facing higher vacancy.
Average Monthly Occupancy Rate Trend in Gua Musang
Average Daily Rate (ADR) Airbnb Trends in Gua Musang (2025)
Effective short term rental pricing strategy in Gua Musang involves understanding monthly ADR fluctuations. The Average Daily Rate (ADR) for Airbnb in Gua Musang typically peaks in August and dips lowest during March. Leveraging Airbnb dynamic pricing tools or strategies based on this seasonality can significantly boost revenue. Here's a look at the typical nightly rates achieved:
- Best-in-class properties (Top 10%) command rates of $63+ per night, often due to premium features or locations.
- Strong performing properties (Top 25%) achieve nightly rates of $50 or more.
- Typical properties (Median) charge around $36 per night.
- Entry-level properties (Bottom 25%) earn around $31 per night.
Average Daily Rate (ADR) Trend by Month in Gua Musang
Get Live Gua Musang Market Intelligence 👇

Explore Real-time Analytics
Airbnb Seasonality Analysis & Trends in Gua Musang (2025)
Peak Season (January, December, June)
- Revenue averages $322 per month
- Occupancy rates average 21.4%
- Daily rates average $42
Shoulder Season
- Revenue averages $266 per month
- Occupancy maintains around 18.7%
- Daily rates hold near $42
Low Season (July, August, October)
- Revenue drops to average $205 per month
- Occupancy decreases to average 14.7%
- Daily rates adjust to average $43
Seasonality Insights for Gua Musang
- The Airbnb seasonality in Gua Musang shows moderate seasonality with distinct peak and low periods. While the sections above show seasonal averages, it's also insightful to look at the extremes:
- During the high season, the absolute peak month showcases Gua Musang's highest earning potential, with monthly revenues capable of climbing to $336, occupancy reaching a high of 22.3%, and ADRs peaking at $43.
- Conversely, the slowest single month of the year, typically falling within the low season, marks the market's lowest point. In this month, revenue might dip to $189, occupancy could drop to 13.9%, and ADRs may adjust down to $41.
- Understanding both the seasonal averages and these monthly peaks and troughs in revenue, occupancy, and ADR is crucial for maximizing your Airbnb profit potential in Gua Musang.
Seasonal Strategies for Maximizing Profit
- Peak Season: Maximize revenue through premium pricing and potentially longer minimum stays. Ensure high availability.
- Low Season: Offer competitive pricing, special promotions (e.g., extended stay discounts), and flexible cancellation policies. Target off-season travelers like remote workers or budget-conscious guests.
- Shoulder Seasons: Implement dynamic pricing that balances peak and low rates. Target weekend travelers or specific events. Offer slightly more flexible terms than peak season.
- Regularly analyze your own performance against these Gua Musang seasonality benchmarks and adjust your pricing and availability strategy accordingly.
Best Areas for Airbnb Investment in Gua Musang (2025)
Exploring the top neighborhoods for short-term rentals in Gua Musang? This section highlights key areas, outlining why they are attractive for hosts and guests, along with notable local attractions. Consider these locations based on your target guest profile and investment strategy.
| Neighborhood / Area | Why Host Here? (Target Guests & Appeal) | Key Attractions & Landmarks |
|---|---|---|
| Gua Musang Town | The central area of Gua Musang with various amenities and services. It's easily accessible and serves as a hub for travelers visiting nearby attractions like the National Parks and caves. | Gua Musang Caves, Muzium Gua Musang, Masjid Felda, Pasar Gua Musang, Sungai Galas |
| Manik Urai | A picturesque village area known for its scenic rivers and natural beauty. It's popular for those seeking a tranquil getaway amidst nature. | Sungai Ula, Kampung Manik Urai, Nature trails, Local handicrafts, Traditional Malay culture |
| Cameron Highlands | Although slightly farther, it's a popular tourist destination known for tea plantations, strawberry farms, and cooler climates. It attracts a significant number of tourists. | Boh Tea Plantation, Strawberry Farms, Cameron Lavender Garden, Cactus Valley, Mossy Forest |
| National Parks | The surrounding national parks, including Taman Negara, offer adventurous outdoor experiences. Ideal for guests looking for trekking and wildlife exploration. | Taman Negara, Gua Musang National Park, Forest reserves, Wildlife watching, Waterfall hiking |
| Jeli | Nearby town with local attractions and weekend markets. It serves as a good stopover point for travelers heading to Gua Musang. | Jeli River, Temenggor Lake, Traditional market, Jeli Museum, Beautiful landscapes |
| Nenggiri River | Known for its beautiful river and fishing opportunities. Great for eco-tourism and water activities. | Nenggiri River activities, Fishing spots, Camping sites, Kayaking, Scenic views |
| Gua Musang Hot Springs | A relaxing destination for visitors looking to unwind. The hot springs are a natural attraction for those traveling to the region. | Hot Springs experience, Spa services, Natural surroundings, Relaxation spots |
| Local Villages | Exploring the local culture and lifestyle in traditional Malay villages can attract tourists who are interested in cultural experiences. | Village homestays, Local food experiences, Cultural workshops, Traditional performances, Nature walks |
Understanding Airbnb License Requirements & STR Laws in Gua Musang (2025)
While Gua Musang, Kelantan, Malaysia currently shows low STR regulations, specific Airbnb license requirements might still exist or change. Always verify the latest short term rental regulations and Airbnb license requirements directly with local government authorities for Gua Musang to ensure full compliance before hosting.
(Source: AirROI data, 2025, finding no licensed listings among those analyzed)
Top Performing Airbnb Properties in Gua Musang (2025)
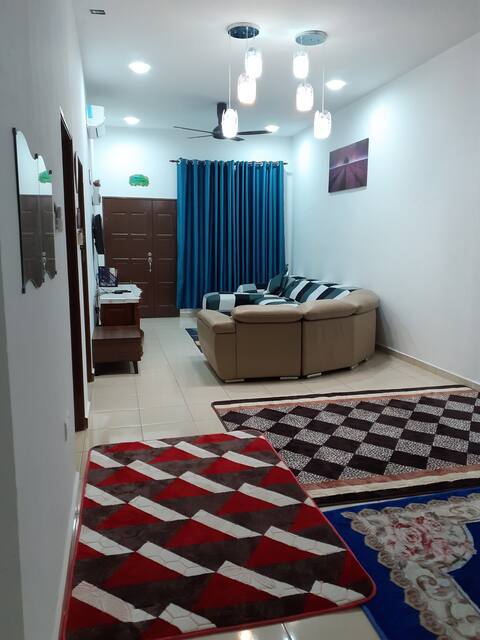
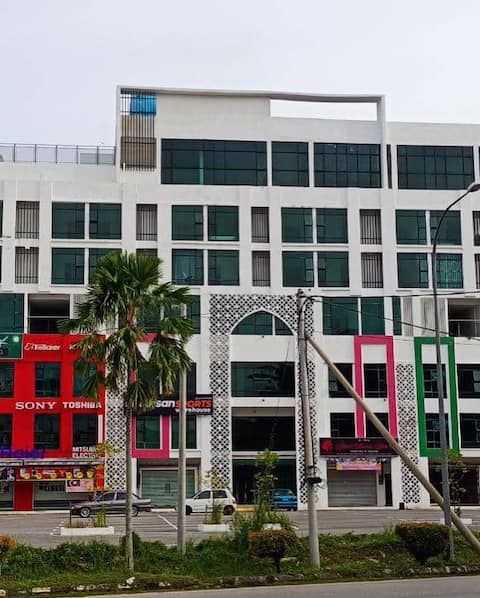
Benchmark your potential! Explore examples of top-performing Airbnb properties in Gua Musangbased on Trailing Twelve Month (TTM) revenue. Analyze their characteristics, revenue, occupancy rate, and ADR to understand what drives success in this market.

A lovely night at Mecca Mosque Homestay Gua Musang
Entire Place • 3 bedrooms
D'tasek Homestay Gua Musang
Entire Place • 5 bedrooms
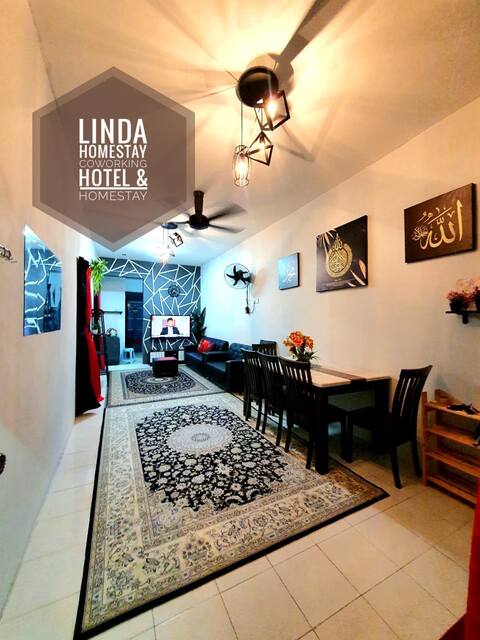
LH Alisha Mewangi Cave Musang
Entire Place • 3 bedrooms

ar guest house
Entire Place • 3 bedrooms

RJ Studio Apartment(2)
Entire Place • N/A
Andriana studio
Private Room • 1 bedroom
Note: Performance varies based on location, size, amenities, seasonality, and management quality. Data reflects the past 12 months.
Top Performing Airbnb Hosts in Gua Musang (2025)
Learn from the best! This table showcases top-performing Airbnb hosts in Gua Musang based on the number of properties managed and estimated total revenue over the past year. Analyze their scale and performance metrics.
| Host Name | Properties | Grossing Revenue | Stay Reviews | Avg Rating |
|---|---|---|---|---|
| Rosmalinda | 3 | $10,516 | 23 | 4.97/5.0 |
| Ummi Nazrah | 1 | $4,379 | 3 | 4.67/5.0 |
| Putra | 1 | $4,101 | 4 | 5.00/5.0 |
| Ain | 1 | $4,058 | 18 | 4.72/5.0 |
| Nik | 1 | $3,429 | 5 | 4.40/5.0 |
| Azrul | 2 | $2,983 | 27 | 4.76/5.0 |
| Sam | 2 | $2,594 | 22 | 4.57/5.0 |
| Syakirin | 1 | $2,411 | 9 | 4.89/5.0 |
| Rik Shien | 1 | $1,237 | 14 | 4.36/5.0 |
| Durian Hill Villa | 4 | $1,234 | 8 | 4.60/5.0 |
Analyzing the strategies of top hosts, such as their property selection, pricing, and guest communication, can offer valuable lessons for optimizing your own Airbnb operations in Gua Musang.
Dive Deeper: Advanced Gua Musang STR Market Data (2025)
Ready to unlock more insights? AirROI provides access to advanced metrics and comprehensive Airbnb data for Gua Musang. Explore detailed analytics beyond this report to refine your investment strategy, optimize pricing, and maximize your vacation rental profits.
Explore Advanced MetricsGua Musang Short-Term Rental Market Composition (2025): Property & Room Types
Room Type Distribution
Property Type Distribution
Market Composition Insights for Gua Musang
- The Gua Musang Airbnb market composition is heavily skewed towards Entire Home/Apt listings, which make up 72.2% of the 18 active rentals. This indicates strong guest preference for privacy and space.
- Looking at the property type distribution in Gua Musang, House properties are the most common (55.6%), reflecting the local real estate landscape.
- Houses represent a significant 55.6% portion, catering likely to families or larger groups.
- The presence of 5.6% Hotel/Boutique listings indicates integration with traditional hospitality.
Gua Musang Airbnb Room Capacity Analysis (2025): Bedroom Distribution
Distribution of Listings by Number of Bedrooms
Room Capacity Insights for Gua Musang
- The dominant room capacity in Gua Musang is 1 bedroom listings, making up 50% of the market. This suggests a strong demand for properties suitable for couples or solo travelers.
- Together, 1 bedroom and 3 bedrooms properties represent 66.7% of the active Airbnb listings in Gua Musang, indicating a high concentration in these sizes.
- A significant 22.3% of listings offer 3+ bedrooms, catering to larger groups and families seeking more space in Gua Musang.
Gua Musang Vacation Rental Guest Capacity Trends (2025)
Distribution of Listings by Guest Capacity
Guest Capacity Insights for Gua Musang
- The most common guest capacity trend in Gua Musang vacation rentals is listings accommodating 8+ guests (27.8%). This suggests the primary traveler segment is likely larger groups.
- Properties designed for 8+ guests and 4 guests dominate the Gua Musang STR market, accounting for 50.0% of listings.
- 33.4% of properties accommodate 6+ guests, serving the market segment for larger families or group travel in Gua Musang.
- On average, properties in Gua Musang are equipped to host 4.6 guests.
Gua Musang Airbnb Booking Patterns (2025): Available vs. Booked Days
Available Days Distribution
Booked Days Distribution
Booking Pattern Insights for Gua Musang
- The most common availability pattern in Gua Musang falls within the 271-366 days range, representing 94.4% of listings. This suggests many properties have significant open periods on their calendars.
- Approximately 100.0% of listings show high availability (181+ days open annually), indicating potential for increased bookings or specific owner usage patterns.
- For booked days, the 31-90 days range is most frequent in Gua Musang (61.1%), reflecting common guest stay durations or potential owner blocking patterns.
Gua Musang Airbnb Minimum Stay Requirements Analysis
Distribution of Listings by Minimum Night Requirement
1 Night
18 listings
100% of total
Key Insights
- The most prevalent minimum stay requirement in Gua Musang is 1 Night, adopted by 100% of listings. This highlights the market's preference for shorter, flexible bookings.
- A strong majority (100.0%) of the Gua Musang Airbnb data shows acceptance of very short stays (1-2 nights), indicating a dynamic, high-turnover market.
Recommendations
- Align with the market by considering a 1 Night minimum stay, as 100% of Gua Musang hosts use this setting.
- Adjust minimum nights based on seasonality – potentially shorter during low season and longer during peak demand periods in Gua Musang.
Gua Musang Airbnb Cancellation Policy Trends Analysis (2025)
Flexible
13 listings
72.2% of total
Moderate
2 listings
11.1% of total
Firm
3 listings
16.7% of total
Cancellation Policy Insights for Gua Musang
- The prevailing Airbnb cancellation policy trend in Gua Musang is Flexible, used by 72.2% of listings.
- The market strongly favors guest-friendly terms, with 83.3% of listings offering Flexible or Moderate policies. This suggests guests in Gua Musang may expect booking flexibility.
Recommendations for Hosts
- Consider adopting a Flexible policy to align with the 72.2% market standard in Gua Musang.
- Given the high prevalence of Flexible policies (72.2%), offering this can enhance booking appeal, especially during shoulder seasons.
- Regularly review your cancellation policy against competitors and market demand shifts in Gua Musang.
Gua Musang STR Booking Lead Time Analysis (2025)
Average Booking Lead Time by Month
Booking Lead Time Insights for Gua Musang
- The overall average booking lead time for vacation rentals in Gua Musang is 23 days.
- Guests book furthest in advance for stays during May (average 62 days), likely coinciding with peak travel demand or local events.
- The shortest booking windows occur for stays in February (average 8 days), indicating more last-minute travel plans during this time.
- Seasonally, Spring (29 days avg.) sees the longest lead times, while Winter (14 days avg.) has the shortest, reflecting typical travel planning cycles.
Recommendations for Hosts
- Use the overall average lead time (23 days) as a baseline for your pricing and availability strategy in Gua Musang.
- For May stays, consider implementing length-of-stay discounts or slightly higher rates for bookings made less than 62 days out to capitalize on advance planning.
- During February, focus on last-minute booking availability and promotions, as guests book with very short notice (8 days avg.).
- Target marketing efforts for the Spring season well in advance (at least 29 days) to capture early planners.
- Monitor your own booking lead times against these Gua Musang averages to identify opportunities for dynamic pricing adjustments.
Popular & Essential Airbnb Amenities in Gua Musang (2025)
Amenity Prevalence
Amenity Insights for Gua Musang
- Essential amenities in Gua Musang that guests expect include: Air conditioning. Lacking these (this) could significantly impact bookings.
- Popular amenities like TV, Iron, Essentials are common but not universal. Offering these can provide a competitive edge.
Recommendations for Hosts
- Ensure your listing includes all essential amenities for Gua Musang: Air conditioning.
- Consider adding popular differentiators like TV or Iron to increase appeal.
- Highlight unique or less common amenities you offer (e.g., hot tub, dedicated workspace, EV charger) in your listing description and photos.
- Regularly check competitor amenities in Gua Musang to stay competitive.
Gua Musang Airbnb Guest Demographics & Profile Analysis (2025)
Guest Profile Summary for Gua Musang
- The typical guest profile for Airbnb in Gua Musang consists of primarily domestic travelers (75%), often arriving from nearby Kuala Lumpur, typically belonging to the Post-2000s (Gen Z/Alpha) group (50%), primarily speaking English or Malay.
- Domestic travelers account for 75.0% of guests.
- Key international markets include Malaysia (75%) and France (8.3%).
- Top languages spoken are English (52.4%) followed by Malay (33.3%).
- A significant demographic segment is the Post-2000s (Gen Z/Alpha) group, representing 50% of guests.
Recommendations for Hosts
- Target domestic marketing efforts towards travelers from Kuala Lumpur and Shah Alam.
- Tailor amenities and listing descriptions to appeal to the dominant Post-2000s (Gen Z/Alpha) demographic (e.g., highlight fast WiFi, smart home features, local guides).
- Highlight unique local experiences or amenities relevant to the primary guest profile.
- Consider seasonal promotions aligned with peak travel times for key origin markets.
Nearby Short-Term Rental Market Comparison
How does the Gua Musang Airbnb market stack up against its neighbors? Compare key performance metrics like average monthly revenue, ADR, and occupancy rates in surrounding areas to understand the broader regional STR landscape.
| Market | Active Properties | Monthly Revenue | Daily Rate | Avg. Occupancy |
|---|---|---|---|---|
| Genting Sempah | 16 | $5,654 | $605.00 | 33% |
| Kampung Janda Baik | 23 | $2,041 | $303.90 | 21% |
| Hulu Chemperuh Aboriginal Village | 17 | $1,422 | $192.21 | 26% |
| Bukit Tinggi | 88 | $1,377 | $176.31 | 24% |
| Pulau Perhentian Kecil | 10 | $1,359 | $103.88 | 53% |
| Jeram | 10 | $1,194 | $175.23 | 22% |
| Batang Kali | 11 | $1,016 | $158.62 | 18% |
| Bentong | 84 | $950 | $196.43 | 18% |
| Kuala Kubu Bharu | 37 | $932 | $133.30 | 22% |
| George Town | 3,689 | $763 | $85.87 | 35% |