Kepala Batas, Penang Airbnb Market Data 2025: STR Report & Statistics
How much can you earn on Airbnb in Kepala Batas, Penang? Based on AirROI's 2025 dataset (June 2024 – May 2025), the short answer is $3,821 per year — at a $74 nightly rate, 22.2% occupancy, and a N/A RevPAR.
With just 34 active listings, Kepala Batas is a micro-market where selective demand that rewards strong listing quality and pricing strategy. Supply grew 30.8% over the past year, yet revenue and nightly rates both trended upward — a signal that traveler demand is outpacing new inventory rather than being diluted by it. For hosts, pricing power remains intact even as competition increases.
Regulation is low, reducing the compliance barrier — though local ordinances should still be verified. In a market this size, differentiated listings with strong reviews can capture outsized returns relative to the competition.

Table of Contents [hide] [show]
What Are the Key Airbnb Metrics in Kepala Batas?
In Kepala Batas, the headline Airbnb metrics are $3,821 in average annual revenue,22.2% occupancy, $74 ADR, and $0 in RevPAR, and guests book about 34 days in advance.
How Much Do Airbnb Hosts Earn Monthly in Kepala Batas?
Understanding the monthly revenue variations for Airbnb listings in Kepala Batas is key to maximizing your short term rental income potential. Seasonality significantly impacts earnings. Our analysis, based on data from the past 12 months, shows that the peak revenue month for STRs in Kepala Batas is typically January, while June often presents the lowest earnings, highlighting opportunities for strategic pricing adjustments during shoulder and low seasons. Explore the typical Airbnb income in Kepala Batas across different performance tiers:
- Best-in-class properties (Top 10%) achieve $920+ monthly, often utilizing dynamic pricing and superior guest experiences.
- Strong performing properties (Top 25%) earn $615 or more, indicating effective management and desirable locations/amenities.
- Typical properties (Median) generate around $352 per month, representing the average market performance.
- Entry-level properties (Bottom 25%) see earnings around $192, often with potential for optimization.
Average Monthly Airbnb Earnings Trend in Kepala Batas
What Is the Monthly Airbnb Occupancy Rate in Kepala Batas?
Maximize your bookings by understanding the Kepala Batas STR occupancy trends. Seasonal demand shifts significantly influence how often properties are booked. Typically, Decembersees the highest demand (peak season occupancy), while June experiences the lowest (low season). Effective strategies, like adjusting minimum stays or offering promotions, can boost occupancy during slower periods. Here's how different property tiers perform in Kepala Batas:
- Best-in-class properties (Top 10%) achieve 43%+ occupancy, indicating high desirability and potentially optimized availability.
- Strong performing properties (Top 25%) maintain 31% or higher occupancy, suggesting good market fit and guest satisfaction.
- Typical properties (Median) have an occupancy rate around 20%.
- Entry-level properties (Bottom 25%) average 11% occupancy, potentially facing higher vacancy.
Average Monthly Occupancy Rate Trend in Kepala Batas
What Is the Average Airbnb Nightly Rate in Kepala Batas?
Effective short term rental pricing strategy in Kepala Batas involves understanding monthly ADR fluctuations. The Average Daily Rate (ADR) for Airbnb in Kepala Batas typically peaks in May and dips lowest during June. Leveraging Airbnb dynamic pricing tools or strategies based on this seasonality can significantly boost revenue. Here's a look at the typical nightly rates achieved:
- Best-in-class properties (Top 10%) command rates of $90+ per night, often due to premium features or locations.
- Strong performing properties (Top 25%) achieve nightly rates of $68 or more.
- Typical properties (Median) charge around $54 per night.
- Entry-level properties (Bottom 25%) earn around $45 per night.
Average Daily Rate (ADR) Trend by Month in Kepala Batas
What Is the RevPAR for Airbnb in Kepala Batas?
RevPAR in Kepala Batas is currently N/A. Because RevPAR combines nightly rates with realized occupancy, it is one of the cleanest ways to compare how efficiently listings turn demand into revenue across the market.
- Entry-level properties (Bottom 25%) see N/A RevPAR.
- Typical properties (Median) generate N/A RevPAR.
- Strong performers (Top 25%) earn N/A RevPAR.
- Best-in-class (Top 10%) achieve N/A RevPAR.
Average Monthly RevPAR Trend in Kepala Batas
RevPAR Insights for Kepala Batas
- RevPAR peaks in Jan and bottoms out in Jan, mirroring the broader seasonal demand pattern and suggesting opportunities for dynamic pricing.
Recommendations for Hosts
- Track your own RevPAR monthly against these Kepala Batas benchmarks. If your RevPAR falls below the median of N/A, examine whether low occupancy or low ADR is the primary drag.
- Use RevPAR rather than revenue alone when comparing properties of different sizes — it normalizes for available nights and gives a more accurate picture of performance.
Get Live Kepala Batas Market Intelligence 👇
Explore Real-time Analytics
When Is the Peak Season for Airbnb in Kepala Batas?
Kepala Batas's peak Airbnb season falls in January, December, February, while the softest stretch is March, June, November. Overall, the market shows highly seasonal trends requiring careful strategy, which should guide pricing, minimum stays, and cash-flow planning.
Peak Season (January, December, February)
- Revenue averages $598 per month
- Occupancy rates average 29.8%
- Daily rates average $71
Shoulder Season
- Revenue averages $471 per month
- Occupancy maintains around 23.7%
- Daily rates hold near $66
Low Season (March, June, November)
- Revenue drops to average $279 per month
- Occupancy decreases to average 14.9%
- Daily rates adjust to average $65
Seasonality Insights for Kepala Batas
- Airbnb seasonality in Kepala Batas is pronounced. Revenue swings sharply between peak and low months, which means pricing strategy, minimum-stay settings, and cash reserves all need to account for extended slower periods.
- During the high season, the absolute peak month showcases Kepala Batas's highest earning potential, with monthly revenues climbing to $662, occupancy reaching 32.9%, and ADRs peaking at $80.
- Conversely, the slowest single month marks the market's lowest point — revenue may dip to $237, occupancy could drop to 12.6%, and ADRs may adjust to $59.
- Lower occupancy paired with meaningful seasonality means hosts in Kepala Batas need to maximize every peak-season booking and seriously consider whether off-season pricing adjustments or minimum-stay changes can capture incremental revenue.
Seasonal Strategies for Maximizing Profit
- Peak Season: Maximize revenue through premium pricing and potentially longer minimum stays. Ensure high availability and consider tightening cancellation policies to reduce last-minute gaps.
- Low Season: Offer competitive pricing, extended-stay discounts, and flexible cancellation policies. Target off-season travelers like remote workers, budget-conscious guests, and travelers with flexible schedules.
- Shoulder Seasons: Implement dynamic pricing that bridges peak and low rates. Target weekend travelers, local events, and business visitors. Slightly more flexible terms than peak season can help maintain occupancy without deep discounting.
- In a highly seasonal market like Kepala Batas, building a cash reserve during the top months is essential for covering fixed costs during the slow period. Automated pricing tools can help capture demand shifts in real time.
Do You Need a License for Airbnb in Kepala Batas?
While Kepala Batas, Penang, Malaysia currently shows low STR regulations, 6% of listings carry registration evidence — suggesting some hosts proactively register or that certain neighborhoods have their own rules. Checking local zoning and tax obligations before listing is still wise. Always verify the latest short-term rental regulations and Airbnb license requirements directly with local government authorities for Kepala Batas to ensure full compliance before hosting.
(Source: AirROI data, 2026, based on 6% licensed listings)
What Are the Best Neighborhoods for Airbnb in Kepala Batas?
With a compact short-term rental market, Kepala Batas gives early-mover hosts an advantage in the right neighborhoods. The areas listed below are where guest demand and local attractions converge — a useful lens for investors evaluating whether to enter this market and where to position their listing.
| Neighborhood / Area | Why Host Here? (Target Guests & Appeal) | Key Attractions & Landmarks |
|---|---|---|
| Kepala Batas Town | A bustling town center with local amenities and easy access to major roads, making it a convenient spot for visitors wanting to explore Penang. | Kepala Batas Wet Market, Penang Golf Club, Masjid Jamek Al-Muhajirin, Local food stalls |
| Tasek Gelugor | A serene area with a mix of rural charm and modern developments, attractive for those looking for a quieter stay close to nature. | Tasek Gelugor Park, Seberang Perai Agricultural Park, Local farms and fruit orchards |
| Bertam | A growing residential area with proximity to local attractions and amenities, appealing to families and long-term visitors. | Bertam Perdana Park, Shopping at Bertam Mall, Nearby golf courses |
| Batu Kawan | A rapidly developing area with the latest attractions and shopping amenities, popular among younger travelers and families. | Eco Theme Park, Batu Kawan Stadium, Simpang Ampat Food Court |
| Sungai Dua | A suburban area that offers a blend of urban and traditional Penang life, great for those wanting to experience local culture. | Kg Sungai Dua Heritage Trail, Local cuisine restaurants, Nearby beaches |
| Penaga | Known for its historical significance and cultural heritage, this area attracts visitors interested in Penang's rich history and local artisans. | Penaga Heritage House, Local art galleries, Traditional craft stores |
| Juru | An industrial zone that is blossoming with new developments, appealing to business travelers and those attending events in the area. | Juru AutoCity, Local dining spots, Business parks |
| Bayan Lepas | A key industrial area with proximity to the airport, making it perfect for business travelers and those exploring Penang Island. | Penang International Airport, Queensbay Mall, Bayan Lepas Industrial Park |
With 8 distinct neighborhoods showing meaningful short-term rental activity, Kepala Batas offers diversification within a single market. Investors can tailor their strategy — from high-turnover tourist zones to quieter residential areas that attract longer stays and remote workers.
What Types of Properties Are on Airbnb in Kepala Batas?
Room Type Distribution
Property Type Distribution
Market Composition Insights for Kepala Batas
- The Kepala Batas Airbnb market composition is heavily skewed towards Entire Home/Apt listings, which make up 97.1% of the 34 active rentals. This indicates strong guest preference for privacy and space.
- Looking at the property type distribution in Kepala Batas, House properties are the most common (94.1%), reflecting the local real estate landscape.
- Houses represent a significant 94.1% portion, catering likely to families or larger groups.
- Smaller segments like others, hotel/boutique (combined 5.8%) offer potential for unique stay experiences.
Kepala Batas Airbnb Room Capacity Analysis (2026): Bedroom Distribution
Distribution of Listings by Number of Bedrooms
Room Capacity Insights for Kepala Batas
- The dominant room capacity in Kepala Batas is 3 bedrooms listings, making up 50% of the market. This suggests a strong demand for properties suitable for families or small groups.
- Together, 3 bedrooms and 4 bedrooms properties represent 88.2% of the active Airbnb listings in Kepala Batas, indicating a high concentration in these sizes.
- A significant 97.0% of listings offer 3+ bedrooms, catering to larger groups and families seeking more space in Kepala Batas.
Kepala Batas Vacation Rental Guest Capacity Trends (2026)
Distribution of Listings by Guest Capacity
Guest Capacity Insights for Kepala Batas
- The most common guest capacity trend in Kepala Batas vacation rentals is listings accommodating 8+ guests (70.6%). This suggests the primary traveler segment is likely larger groups.
- Properties designed for 8+ guests and 6 guests dominate the Kepala Batas STR market, accounting for 85.3% of listings.
- 94.1% of properties accommodate 6+ guests, serving the market segment for larger families or group travel in Kepala Batas.
- On average, properties in Kepala Batas are equipped to host 7.3 guests.
What Amenities Do Airbnb Guests Expect in Kepala Batas?
Amenity Prevalence
Amenity Insights for Kepala Batas
- Essential amenities in Kepala Batas that guests expect include: Free parking on premises, Air conditioning, TV. Lacking these (any) could significantly impact bookings.
- Popular amenities like Kitchen, Iron, Washer are common but not universal. Offering these can provide a competitive edge.
- Warning: Wifi is not universally provided but is considered essential globally. Ensure reliable Wifi is offered.
Recommendations for Hosts
- Ensure your listing includes all essential amenities for Kepala Batas: Free parking on premises, Air conditioning, TV.
- Prioritize adding missing essentials: TV.
- Consider adding popular differentiators like Kitchen or Iron to increase appeal.
- Highlight unique or less common amenities you offer (e.g., hot tub, dedicated workspace, EV charger) in your listing description and photos.
- Regularly check competitor amenities in Kepala Batas to stay competitive.
Dive Deeper: Advanced Kepala Batas STR Market Data (2026)
Ready to unlock more insights? AirROI provides access to advanced metrics and comprehensive Airbnb data for Kepala Batas. Explore detailed analytics beyond this report to refine your investment strategy, optimize pricing, and maximize your vacation rental profits.
Explore Advanced MetricsKepala Batas Airbnb Guest Demographics & Profile Analysis (2026)
Guest Profile Summary for Kepala Batas
- The typical guest profile for Airbnb in Kepala Batas consists of primarily domestic travelers (99%), often arriving from nearby Kuala Lumpur, typically belonging to the Post-2000s (Gen Z/Alpha) group (50%), primarily speaking Malay or English.
- Domestic travelers account for 98.7% of guests.
- Key international markets include Malaysia (98.7%) and United Kingdom (1.3%).
- Top languages spoken are Malay (47.8%) followed by English (46.7%).
- A significant demographic segment is the Post-2000s (Gen Z/Alpha) group, representing 50% of guests.
Recommendations for Hosts
- Target domestic marketing efforts towards travelers from Kuala Lumpur and Selangor.
- Tailor amenities and listing descriptions to appeal to the dominant Post-2000s (Gen Z/Alpha) demographic (e.g., highlight fast WiFi, smart home features, local guides).
- Highlight unique local experiences or amenities relevant to the primary guest profile.
- Consider seasonal promotions aligned with peak travel times for key origin markets.
Kepala Batas Airbnb Booking Patterns (2026): Available vs. Booked Days
Available Days Distribution
Booked Days Distribution
Booking Pattern Insights for Kepala Batas
- The most common availability pattern in Kepala Batas falls within the 271-366 days range, representing 79.4% of listings. This suggests many properties have significant open periods on their calendars.
- Approximately 97.0% of listings show high availability (181+ days open annually), indicating potential for increased bookings or specific owner usage patterns.
- For booked days, the 31-90 days range is most frequent in Kepala Batas (50%), reflecting common guest stay durations or potential owner blocking patterns.
- A notable 2.9% of properties secure long booking periods (181+ days booked per year), highlighting successful long-term rental strategies or significant owner usage.
How Far in Advance Do Guests Book Airbnb in Kepala Batas?
Average Booking Lead Time by Month
Booking Lead Time Insights for Kepala Batas
- The overall average booking lead time for vacation rentals in Kepala Batas is 34 days.
- Guests book furthest in advance for stays during March (average 51 days), likely coinciding with peak travel demand or local events.
- The shortest booking windows occur for stays in July (average 10 days), indicating more last-minute travel plans during this time.
- Seasonally, Spring (41 days avg.) sees the longest lead times, while Summer (17 days avg.) has the shortest, reflecting typical travel planning cycles.
Recommendations for Hosts
- Use the overall average lead time (34 days) as a baseline for your pricing and availability strategy in Kepala Batas.
- For March stays, consider implementing length-of-stay discounts or slightly higher rates for bookings made less than 51 days out to capitalize on advance planning.
- During July, focus on last-minute booking availability and promotions, as guests book with very short notice (10 days avg.).
- Target marketing efforts for the Spring season well in advance (at least 41 days) to capture early planners.
- Monitor your own booking lead times against these Kepala Batas averages to identify opportunities for dynamic pricing adjustments.
Kepala Batas Airbnb Minimum Stay Requirements Analysis
Distribution of Listings by Minimum Night Requirement
1 Night
32 listings
94.1% of total
2 Nights
2 listings
5.9% of total
Key Insights
- The most prevalent minimum stay requirement in Kepala Batas is 1 Night, adopted by 94.1% of listings. This highlights the market's preference for shorter, flexible bookings.
- A strong majority (100.0%) of the Kepala Batas Airbnb data shows acceptance of very short stays (1-2 nights), indicating a dynamic, high-turnover market.
Recommendations
- Align with the market by considering a 1 Night minimum stay, as 94.1% of Kepala Batas hosts use this setting.
- Adjust minimum nights based on seasonality – potentially shorter during low season and longer during peak demand periods in Kepala Batas.
Kepala Batas Airbnb Cancellation Policy Trends Analysis (2026)
Flexible
6 listings
20.7% of total
Moderate
12 listings
41.4% of total
Firm
3 listings
10.3% of total
Strict
8 listings
27.6% of total
Cancellation Policy Insights for Kepala Batas
- The prevailing Airbnb cancellation policy trend in Kepala Batas is Moderate, used by 41.4% of listings.
- There's a relatively balanced mix between guest-friendly (62.1%) and stricter (37.9%) policies, offering choices for different guest needs.
Recommendations for Hosts
- Consider adopting a Moderate policy to align with the 41.4% market standard in Kepala Batas.
- Regularly review your cancellation policy against competitors and market demand shifts in Kepala Batas.
What Do the Top Airbnb Listings in Kepala Batas Look Like?
Benchmark your potential! Explore examples of top-performing Airbnb properties in Kepala Batasbased on Trailing Twelve Month (TTM) revenue. Analyze their characteristics, revenue, occupancy rate, and ADR to understand what drives success in this market.

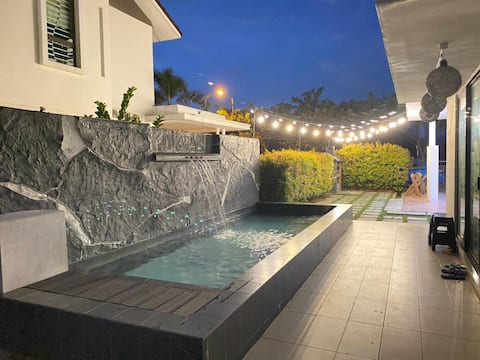
Four (4) Rooms With Private Pool @ Villa A&A
Entire Place • 4 bedrooms
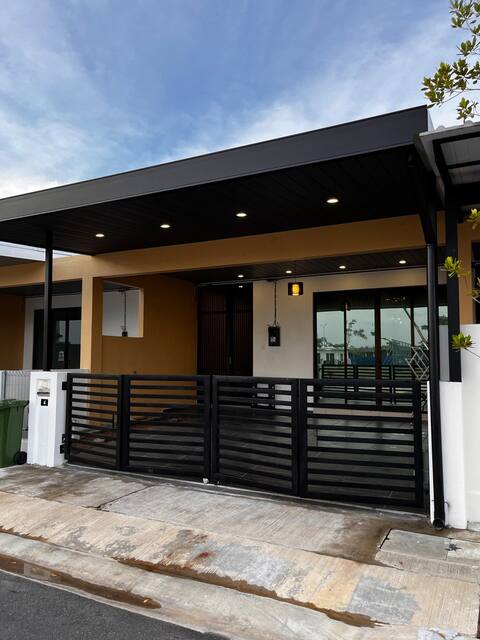
PROMO- private pool Homestay Penang Kepala Batas
Entire Place • 3 bedrooms

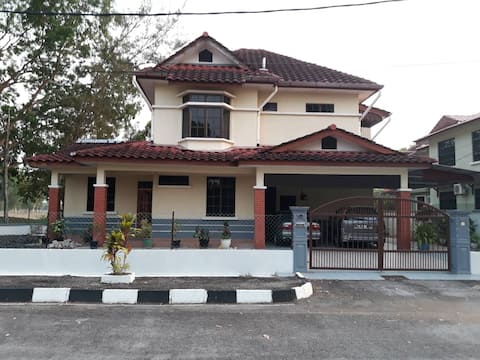
Tisa Homestay
Entire Place • 4 bedrooms

Stylaa Homestay Bertam DS Terrace 4 Bedroom
Entire Place • 4 bedrooms
Muiiz Muslim Homestay Bertam Lakeview & Waterpark
Entire Place • 3 bedrooms
Permai Villa Homestay
Entire Place • 5 bedrooms
Note: Performance varies based on location, size, amenities, seasonality, and management quality. Data reflects the past 12 months.
Who Are the Top Airbnb Hosts in Kepala Batas?
Learn from the best! This table showcases top-performing Airbnb hosts in Kepala Batas based on the number of properties managed and estimated total revenue over the past year. Analyze their scale and performance metrics.
| Host Name | Properties | Grossing Revenue | Stay Reviews | Avg Rating |
|---|---|---|---|---|
| Muhamad Faris | 3 | $15,604 | 45 | 4.54/5.0 |
| Azwa | 1 | $14,532 | 18 | 4.72/5.0 |
| Sunarti | 1 | $8,840 | 14 | 4.93/5.0 |
| Syazreen | 2 | $8,349 | 6 | 4.75/5.0 |
| Jasni | 1 | $8,211 | 8 | 5.00/5.0 |
| Abdul Muiiz | 1 | $7,091 | 25 | 4.92/5.0 |
| Yazwan | 1 | $6,963 | 13 | 4.38/5.0 |
| Amin | 1 | $6,799 | 5 | 4.60/5.0 |
| Mairaz | 1 | $6,649 | 16 | 5.00/5.0 |
| Fadilah | 1 | $6,421 | 66 | 4.88/5.0 |
Analyzing the strategies of top hosts, such as their property selection, pricing, and guest communication, can offer valuable lessons for optimizing your own Airbnb operations in Kepala Batas.
How Does Kepala Batas's Airbnb Market Compare to Nearby Cities?
How does the Kepala Batas Airbnb market stack up against its neighbors? Compare key performance metrics like average monthly revenue, ADR, and occupancy rates in surrounding areas to understand the broader regional STR landscape.
Compared with George Town, Kepala Batas has 13 percentage points lower occupancy and about $7 lower ADR. That helps frame whether this market is winning more on demand, pricing, or both.
| Market | Active Properties | Monthly Revenue | Daily Rate | Avg. Occupancy |
|---|---|---|---|---|
| Kuala Teriang | 16 | $2,044 | $178.58 | 31% |
| Tengah Island | 79 | $1,495 | $169.21 | 32% |
| Langkawi | 151 | $996 | $118.42 | 32% |
| Chemor | 11 | $726 | $125.65 | 22% |
| Ban Phru | 10 | $722 | $93.29 | 31% |
| Kampung Padang Gaong | 49 | $713 | $92.90 | 32% |
| George Town | 4,003 | $642 | $80.48 | 35% |
| Paya Mempelam Village | 82 | $638 | $125.22 | 28% |
| Ban Ko Li Pe | 131 | $620 | $226.15 | 25% |
| Kuah | 317 | $557 | $72.14 | 31% |
Frequently Asked Questions About Airbnb in Kepala Batas
These quick answers summarize the most common investor and operator questions using AirROI's latest market data for Kepala Batas.
How much do Airbnb hosts make in Kepala Batas?
Kepala Batas hosts earn about $3,821 per year on average, with an average nightly rate of $74 and RevPAR of N/A. Those figures describe the typical revenue environment for active listings in Kepala Batas, Penang, not the ceiling for the best operators. Source: AirROI 2025 data, Kepala Batas market, June 2024 to May 2025.
What is the average Airbnb occupancy rate in Kepala Batas?
The average Airbnb occupancy rate in Kepala Batas is 22.2%. January is the strongest month and June is the softest, so hosts should expect demand to move meaningfully throughout the year rather than stay flat.
What is the average Airbnb daily rate in Kepala Batas?
Listings in Kepala Batas average $74 per night. The broader pricing spread also matters: lower-performing listings cluster closer to the lower quartiles, while premium homes can price materially above the city average when demand spikes or listing quality stands out.
How many Airbnb listings are active in Kepala Batas?
Kepala Batas currently has about 34 active Airbnb listings in AirROI's market dataset. That supply count helps explain how competitive the market is, how much depth there is for benchmarking, and whether the market behaves like a niche destination or a scaled urban market.
How strict are short-term rental regulations in Kepala Batas?
AirROI currently classifies the short-term rental regulation level in Kepala Batas as Low. The dataset also shows about 5.9% of listings with registration evidence. That is a market signal, not legal advice, so hosts should still confirm current licensing and compliance rules locally before listing.
What is the RevPAR for Airbnb in Kepala Batas?
RevPAR in Kepala Batas is about N/A. That metric combines pricing and occupancy into one efficiency number, so it is often a better quick benchmark than ADR alone when investors want to compare how well listings convert nightly rates into realized revenue.
Is Airbnb profitable in Kepala Batas?
Occupancy of 22.2% means Kepala Batas is a more selective market. Profitability is achievable but requires careful cost management, premium positioning, or targeting longer stays to reduce turnover. Average annual revenue is $3,821, but individual returns depend on property type, location within the city, and the host's operating efficiency.
How far in advance do guests book Airbnb in Kepala Batas?
The average booking lead time in Kepala Batas is about 34 days — a moderate lead time that gives hosts planning visibility while still benefiting from last-minute bookings. Hosts who understand their market's booking cadence can adjust minimum stays and pricing windows accordingly.
What are the best neighborhoods for Airbnb in Kepala Batas?
Based on AirROI's analysis, some of the top neighborhoods for short-term rentals in Kepala Batas include Kepala Batas Town, Tasek Gelugor, Bertam. Each area attracts different guest profiles — from business travelers to leisure visitors — so the best location depends on the property type and target audience a host is aiming for. See the full neighborhood breakdown above.
What type of property performs best on Airbnb in Kepala Batas?
entire_home listings make up 97.1% of the active supply in Kepala Batas. The most common configuration does not always mean the most profitable — operators who identify underserved property types or bedroom counts can sometimes outperform the market average by filling a gap in local supply.
How does Kepala Batas compare to nearby Airbnb markets?
Among neighboring markets, Kuala Teriang posts $24,527 in average annual revenue with 31.3% occupancy, compared to Kepala Batas's $3,821 and 22.2%. Comparing nearby markets helps investors understand whether a destination's performance reflects local demand or broader regional trends.
When is the peak season for Airbnb in Kepala Batas?
January is the highest-revenue month in Kepala Batas, while June is the softest. The revenue spread between them indicates a highly seasonal market — revenue in the peak month is more than double the low month, so cash-flow planning and pricing automation are critical.
About AirROI Market Data
AirROI tracks over 20 million properties across 190+ countries and maintains 15+ years of historical performance data, making it one of the deepest Airbnb and STR intelligence platforms available. The analytics pipeline aggregates listing-level data monthly — revenue, occupancy, nightly rates, RevPAR, guest demographics, booking patterns, and competitive supply — so investors and operators can benchmark any market against its own history and against neighboring destinations.
Real estate investors, property managers, financial institutions, hedge funds, tourism boards, hospitality consultants, tech platforms, and academic researchers rely on AirROI data to underwrite acquisitions, optimize pricing, model macro trends, and conduct peer-reviewed research. Data is available through in-depth market reports like this one and the Airbnb API with 22 endpoints and an Airbnb MCP Server for AI agents.
AirROI proprietary analytics as of 2025-05-31. Metrics reflect trailing twelve-month aggregates from active listings. Revenue figures are market averages, not projections. Neighborhood descriptions are AI-generated and reviewed for accuracy. For full methodology, see the data methodology page.