Fuvahmulah Airbnb Market Analysis 2025: Short Term Rental Data & Vacation Rental Statistics in Fuvahmulah, Maldives
Is Airbnb profitable in Fuvahmulah in 2025? Explore comprehensive Airbnb analytics for Fuvahmulah, Fuvahmulah, Maldives to uncover income potential. This 2025 STR market report for Fuvahmulah, based on AirROI data from June 2024 to May 2025, reveals key trends in the niche market of 27 active listings.
Whether you're considering an Airbnb investment in Fuvahmulah, optimizing your existing vacation rental, or exploring rental arbitrage opportunities, understanding the Fuvahmulah Airbnb data is crucial. Understanding the local regulations is key to maximizing your short term rental income potential. Let's dive into the specifics.
Key Fuvahmulah Airbnb Performance Metrics Overview
Monthly Airbnb Revenue Variations & Income Potential in Fuvahmulah (2025)
Understanding the monthly revenue variations for Airbnb listings in Fuvahmulah is key to maximizing your short term rental income potential. Seasonality significantly impacts earnings. Our analysis, based on data from the past 12 months, shows that the peak revenue month for STRs in Fuvahmulah is typically February, while August often presents the lowest earnings, highlighting opportunities for strategic pricing adjustments during shoulder and low seasons. Explore the typical Airbnb income in Fuvahmulah across different performance tiers:
- Best-in-class properties (Top 10%) achieve $2,216+ monthly, often utilizing dynamic pricing and superior guest experiences.
- Strong performing properties (Top 25%) earn $1,621 or more, indicating effective management and desirable locations/amenities.
- Typical properties (Median) generate around $1,068 per month, representing the average market performance.
- Entry-level properties (Bottom 25%) see earnings around $472, often with potential for optimization.
Average Monthly Airbnb Earnings Trend in Fuvahmulah
Fuvahmulah Airbnb Occupancy Rate Trends (2025)
Maximize your bookings by understanding the Fuvahmulah STR occupancy trends. Seasonal demand shifts significantly influence how often properties are booked. Typically, Februarysees the highest demand (peak season occupancy), while June experiences the lowest (low season). Effective strategies, like adjusting minimum stays or offering promotions, can boost occupancy during slower periods. Here's how different property tiers perform in Fuvahmulah:
- Best-in-class properties (Top 10%) achieve 32%+ occupancy, indicating high desirability and potentially optimized availability.
- Strong performing properties (Top 25%) maintain 20% or higher occupancy, suggesting good market fit and guest satisfaction.
- Typical properties (Median) have an occupancy rate around 14%.
- Entry-level properties (Bottom 25%) average 10% occupancy, potentially facing higher vacancy.
Average Monthly Occupancy Rate Trend in Fuvahmulah
Average Daily Rate (ADR) Airbnb Trends in Fuvahmulah (2025)
Effective short term rental pricing strategy in Fuvahmulah involves understanding monthly ADR fluctuations. The Average Daily Rate (ADR) for Airbnb in Fuvahmulah typically peaks in January and dips lowest during December. Leveraging Airbnb dynamic pricing tools or strategies based on this seasonality can significantly boost revenue. Here's a look at the typical nightly rates achieved:
- Best-in-class properties (Top 10%) command rates of $348+ per night, often due to premium features or locations.
- Strong performing properties (Top 25%) achieve nightly rates of $262 or more.
- Typical properties (Median) charge around $141 per night.
- Entry-level properties (Bottom 25%) earn around $63 per night.
Average Daily Rate (ADR) Trend by Month in Fuvahmulah
Get Live Fuvahmulah Market Intelligence 👇
Explore Real-time Analytics
Airbnb Seasonality Analysis & Trends in Fuvahmulah (2025)
Peak Season (February, April, March)
- Revenue averages $2,702 per month
- Occupancy rates average 27.0%
- Daily rates average $286
Shoulder Season
- Revenue averages $947 per month
- Occupancy maintains around 16.5%
- Daily rates hold near $172
Low Season (June, August, October)
- Revenue drops to average $366 per month
- Occupancy decreases to average 8.1%
- Daily rates adjust to average $113
Seasonality Insights for Fuvahmulah
- The Airbnb seasonality in Fuvahmulah shows highly seasonal trends requiring careful strategy. While the sections above show seasonal averages, it's also insightful to look at the extremes:
- During the high season, the absolute peak month showcases Fuvahmulah's highest earning potential, with monthly revenues capable of climbing to $3,162, occupancy reaching a high of 33.5%, and ADRs peaking at $301.
- Conversely, the slowest single month of the year, typically falling within the low season, marks the market's lowest point. In this month, revenue might dip to $282, occupancy could drop to 3.3%, and ADRs may adjust down to $109.
- Understanding both the seasonal averages and these monthly peaks and troughs in revenue, occupancy, and ADR is crucial for maximizing your Airbnb profit potential in Fuvahmulah.
Seasonal Strategies for Maximizing Profit
- Peak Season: Maximize revenue through premium pricing and potentially longer minimum stays. Ensure high availability.
- Low Season: Offer competitive pricing, special promotions (e.g., extended stay discounts), and flexible cancellation policies. Target off-season travelers like remote workers or budget-conscious guests.
- Shoulder Seasons: Implement dynamic pricing that balances peak and low rates. Target weekend travelers or specific events. Offer slightly more flexible terms than peak season.
- Regularly analyze your own performance against these Fuvahmulah seasonality benchmarks and adjust your pricing and availability strategy accordingly.
Best Areas for Airbnb Investment in Fuvahmulah (2025)
Exploring the top neighborhoods for short-term rentals in Fuvahmulah? This section highlights key areas, outlining why they are attractive for hosts and guests, along with notable local attractions. Consider these locations based on your target guest profile and investment strategy.
| Neighborhood / Area | Why Host Here? (Target Guests & Appeal) | Key Attractions & Landmarks |
|---|---|---|
| Manta Point | Famous for its exceptional diving experiences, especially to see manta rays. A prime location for divers and ocean enthusiasts looking for adventure. | Manta Point, Diving spots, Surrounding coral reefs, Marine life, Breathtaking underwater scenery |
| Kanduolhi | Known for its serene beaches and beautiful lagoons, ideal for relaxation and local experiences. Great for tourists wanting tranquility away from hustle. | Kanduolhi Beach, Lagoons, Local fish markets, Relaxing spots by the sea, Sunset views |
| Fuvahmulah Museum | Cultural and historical site showcasing the rich heritage of Fuvahmulah. Appeals to those interested in local history and culture. | Fuvahmulah Museum, Local art, Cultural exhibitions, Historical artifacts, Guided tours |
| Masjidul Ameer | Central mosque in Fuvahmulah that offers insight into local culture and religion. Attracts culturally curious travelers. | Masjidul Ameer, Cultural insights, Local architecture, Community events |
| Dhadimagu | A charming residential area with friendly locals, offering a taste of authentic Maldivian life. Ideal for longer stays. | Dhadimagu neighborhoods, Local dining options, Community attractions, Cultural immersion |
| Fuvahmulah City Center | The commercial heart of Fuvahmulah, where guests can experience local markets and shops, perfect for daily necessities and souvenirs. | Local markets, Shops, Cafes, Local events |
| Villingili | A secluded area with beautiful natural views and fewer tourists, ideal for those seeking peace and quiet in a natural setting. | Villingili Beach, Scenic views, Nature walks, Relaxing retreats |
| Local Beaches | Fuvahmulah is known for its stunning beaches, offering sun, sand, and activities for every traveler. Perfect for beach lovers. | Local beaches, Water sports, Swimming, Beachfront relaxation, Beach activities |
Understanding Airbnb License Requirements & STR Laws in Fuvahmulah (2025)
With 22% of listings showing registration in 2025, understanding potential Airbnb license requirements is crucial in Fuvahmulah. Always verify the latest short term rental regulations and Airbnb license requirements directly with local government authorities for Fuvahmulah to ensure full compliance before hosting.
(Source: AirROI data, 2025, based on 22% licensed listings)
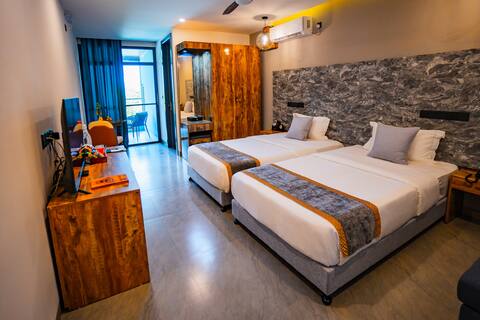
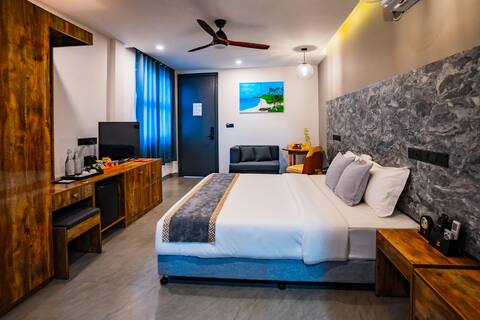
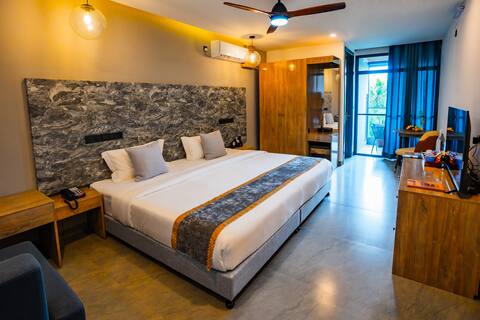
Top Performing Airbnb Properties in Fuvahmulah (2025)
Benchmark your potential! Explore examples of top-performing Airbnb properties in Fuvahmulahbased on Trailing Twelve Month (TTM) revenue. Analyze their characteristics, revenue, occupancy rate, and ADR to understand what drives success in this market.

Suite Room Full Board @Maa Thundi
Private Room • 1 bedroom

Modern Luxury Beach Front Villa.
Entire Place • 4 bedrooms

Suite Room Half Board @Maa Thundi
Private Room • 1 bedroom
Superior Room Full Board @Maa Thundi
Private Room • 1 bedroom
Suite Room with Breakfast @Maa Thundi
Private Room • 1 bedroom
Deluxe Room Full Board @Maa Thundi
Private Room • 1 bedroom
Note: Performance varies based on location, size, amenities, seasonality, and management quality. Data reflects the past 12 months.
Top Performing Airbnb Hosts in Fuvahmulah (2025)
Learn from the best! This table showcases top-performing Airbnb hosts in Fuvahmulah based on the number of properties managed and estimated total revenue over the past year. Analyze their scale and performance metrics.
| Host Name | Properties | Grossing Revenue | Stay Reviews | Avg Rating |
|---|---|---|---|---|
| Athif | 12 | $191,982 | 0 | Not Rated |
| Host #110603804 | 2 | $24,977 | 0 | Not Rated |
| Milja | 2 | $19,429 | 1 | Not Rated |
| Host #18000528 | 1 | $14,706 | 1 | Not Rated |
| Host #273464209 | 3 | $4,505 | 0 | Not Rated |
| Shafeena | 1 | $3,612 | 0 | Not Rated |
| Host #514474917 | 1 | $3,047 | 0 | Not Rated |
| Ibbeyz | 1 | $1,852 | 6 | 4.50/5.0 |
| Nadeem | 1 | $1,530 | 0 | Not Rated |
| Host #454663241 | 1 | $757 | 2 | Not Rated |
Analyzing the strategies of top hosts, such as their property selection, pricing, and guest communication, can offer valuable lessons for optimizing your own Airbnb operations in Fuvahmulah.
Dive Deeper: Advanced Fuvahmulah STR Market Data (2025)
Ready to unlock more insights? AirROI provides access to advanced metrics and comprehensive Airbnb data for Fuvahmulah. Explore detailed analytics beyond this report to refine your investment strategy, optimize pricing, and maximize your vacation rental profits.
Explore Advanced MetricsFuvahmulah Short-Term Rental Market Composition (2025): Property & Room Types
Room Type Distribution
Property Type Distribution
Market Composition Insights for Fuvahmulah
- The Fuvahmulah Airbnb market composition is heavily skewed towards Private Room listings, which make up 74.1% of the 27 active rentals. This indicates strong guest preference for privacy and space.
- Looking at the property type distribution in Fuvahmulah, Hotel/Boutique properties are the most common (55.6%), reflecting the local real estate landscape.
- Houses represent a significant 40.7% portion, catering likely to families or larger groups.
- The presence of 55.6% Hotel/Boutique listings indicates integration with traditional hospitality.
- Smaller segments like apartment/condo (combined 3.7%) offer potential for unique stay experiences.
Fuvahmulah Airbnb Room Capacity Analysis (2025): Bedroom Distribution
Distribution of Listings by Number of Bedrooms
Room Capacity Insights for Fuvahmulah
- The dominant room capacity in Fuvahmulah is 1 bedroom listings, making up 66.7% of the market. This suggests a strong demand for properties suitable for couples or solo travelers.
- Together, 1 bedroom and 2 bedrooms properties represent 85.2% of the active Airbnb listings in Fuvahmulah, indicating a high concentration in these sizes.
- With over half the market (66.7%) consisting of studios or 1-bedroom units, Fuvahmulah is particularly well-suited for individuals or couples.
Fuvahmulah Vacation Rental Guest Capacity Trends (2025)
Distribution of Listings by Guest Capacity
Guest Capacity Insights for Fuvahmulah
- The most common guest capacity trend in Fuvahmulah vacation rentals is listings accommodating 3 guests (44.4%). This suggests the primary traveler segment is likely small families or groups.
- Properties designed for 3 guests and 2 guests dominate the Fuvahmulah STR market, accounting for 66.6% of listings.
- 14.8% of properties accommodate 6+ guests, serving the market segment for larger families or group travel in Fuvahmulah.
- On average, properties in Fuvahmulah are equipped to host 3.3 guests.
Fuvahmulah Airbnb Booking Patterns (2025): Available vs. Booked Days
Available Days Distribution
Booked Days Distribution
Booking Pattern Insights for Fuvahmulah
- The most common availability pattern in Fuvahmulah falls within the 271-366 days range, representing 100% of listings. This suggests many properties have significant open periods on their calendars.
- Approximately 100.0% of listings show high availability (181+ days open annually), indicating potential for increased bookings or specific owner usage patterns.
- For booked days, the 31-90 days range is most frequent in Fuvahmulah (70.4%), reflecting common guest stay durations or potential owner blocking patterns.
Fuvahmulah Airbnb Minimum Stay Requirements Analysis
Distribution of Listings by Minimum Night Requirement
1 Night
25 listings
92.6% of total
2 Nights
1 listings
3.7% of total
7-29 Nights
1 listings
3.7% of total
Key Insights
- The most prevalent minimum stay requirement in Fuvahmulah is 1 Night, adopted by 92.6% of listings. This highlights the market's preference for shorter, flexible bookings.
- A strong majority (96.3%) of the Fuvahmulah Airbnb data shows acceptance of very short stays (1-2 nights), indicating a dynamic, high-turnover market.
Recommendations
- Align with the market by considering a 1 Night minimum stay, as 92.6% of Fuvahmulah hosts use this setting.
- Adjust minimum nights based on seasonality – potentially shorter during low season and longer during peak demand periods in Fuvahmulah.
Fuvahmulah Airbnb Cancellation Policy Trends Analysis (2025)
Flexible
12 listings
92.3% of total
Moderate
1 listings
7.7% of total
Cancellation Policy Insights for Fuvahmulah
- The prevailing Airbnb cancellation policy trend in Fuvahmulah is Flexible, used by 92.3% of listings.
- The market strongly favors guest-friendly terms, with 100.0% of listings offering Flexible or Moderate policies. This suggests guests in Fuvahmulah may expect booking flexibility.
Recommendations for Hosts
- Consider adopting a Flexible policy to align with the 92.3% market standard in Fuvahmulah.
- Given the high prevalence of Flexible policies (92.3%), offering this can enhance booking appeal, especially during shoulder seasons.
- Regularly review your cancellation policy against competitors and market demand shifts in Fuvahmulah.
Fuvahmulah STR Booking Lead Time Analysis (2025)
Average Booking Lead Time by Month
Booking Lead Time Insights for Fuvahmulah
- The overall average booking lead time for vacation rentals in Fuvahmulah is 39 days.
- Guests book furthest in advance for stays during January (average 126 days), likely coinciding with peak travel demand or local events.
- The shortest booking windows occur for stays in June (average 0 days), indicating more last-minute travel plans during this time.
- Seasonally, Winter (67 days avg.) sees the longest lead times, while Summer (4 days avg.) has the shortest, reflecting typical travel planning cycles.
Recommendations for Hosts
- Use the overall average lead time (39 days) as a baseline for your pricing and availability strategy in Fuvahmulah.
- For January stays, consider implementing length-of-stay discounts or slightly higher rates for bookings made less than 126 days out to capitalize on advance planning.
- During June, focus on last-minute booking availability and promotions, as guests book with very short notice (0 days avg.).
- Target marketing efforts for the Winter season well in advance (at least 67 days) to capture early planners.
- Monitor your own booking lead times against these Fuvahmulah averages to identify opportunities for dynamic pricing adjustments.
Popular & Essential Airbnb Amenities in Fuvahmulah (2025)
Amenity Prevalence
Amenity Insights for Fuvahmulah
- Essential amenities in Fuvahmulah that guests expect include: Air conditioning, Wifi. Lacking these (any) could significantly impact bookings.
- Popular amenities like Washer, TV, Hot water are common but not universal. Offering these can provide a competitive edge.
Recommendations for Hosts
- Ensure your listing includes all essential amenities for Fuvahmulah: Air conditioning, Wifi.
- Prioritize adding missing essentials: Wifi.
- Consider adding popular differentiators like Washer or TV to increase appeal.
- Highlight unique or less common amenities you offer (e.g., hot tub, dedicated workspace, EV charger) in your listing description and photos.
- Regularly check competitor amenities in Fuvahmulah to stay competitive.
Fuvahmulah Airbnb Guest Demographics & Profile Analysis (2025)
Guest Profile Summary for Fuvahmulah
- The typical guest profile for Airbnb in Fuvahmulah consists of predominantly international visitors (90%), with top international origins including Germany, typically belonging to the 1980s (Millennials) group (50%), primarily speaking English or French.
- Domestic travelers account for 10.0% of guests.
- Key international markets include Spain (20%) and Germany (20%).
- Top languages spoken are English (37.5%) followed by French (18.8%).
- A significant demographic segment is the Post-2000s (Gen Z/Alpha) group, representing 50% of guests.
Recommendations for Hosts
- Focus marketing internationally, particularly towards travelers from Germany.
- Tailor amenities and listing descriptions to appeal to the dominant 1980s (Millennials) demographic (e.g., highlight fast WiFi, smart home features, local guides).
- Highlight unique local experiences or amenities relevant to the primary guest profile.
- Consider seasonal promotions aligned with peak travel times for key origin markets.
Nearby Short-Term Rental Market Comparison
How does the Fuvahmulah Airbnb market stack up against its neighbors? Compare key performance metrics like average monthly revenue, ADR, and occupancy rates in surrounding areas to understand the broader regional STR landscape.
| Market | Active Properties | Monthly Revenue | Daily Rate | Avg. Occupancy |
|---|---|---|---|---|
| Addu City | 11 | $1,446 | $444.63 | 24% |