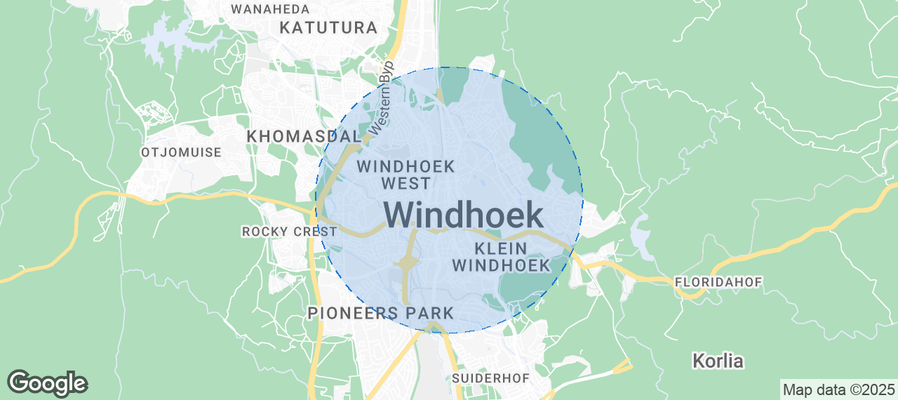
Windhoek Airbnb Market Analysis 2026: Short Term Rental Data & Vacation Rental Statistics in Khomas Region, Namibia
Is Airbnb profitable in Windhoek in 2026? Explore comprehensive Airbnb analytics for Windhoek, Khomas Region, Namibia to uncover income potential. This 2026 STR market report for Windhoek, based on AirROI data from May 2024 to April 2025, reveals key trends in the niche market of 18 active listings.
Whether you're considering an Airbnb investment in Windhoek, optimizing your existing vacation rental, or exploring rental arbitrage opportunities, understanding the Windhoek Airbnb data is crucial. Leveraging the low regulation environment is key to maximizing your short term rental income potential. Let's dive into the specifics.
Key Windhoek Airbnb Performance Metrics Overview
Monthly Airbnb Revenue Variations & Income Potential in Windhoek (2026)
Understanding the monthly revenue variations for Airbnb listings in Windhoek is key to maximizing your short term rental income potential. Seasonality significantly impacts earnings. Our analysis, based on data from the past 12 months, shows that the peak revenue month for STRs in Windhoek is typically May, while October often presents the lowest earnings, highlighting opportunities for strategic pricing adjustments during shoulder and low seasons. Explore the typical Airbnb income in Windhoek across different performance tiers:
- Best-in-class properties (Top 10%) achieve $3,112+ monthly, often utilizing dynamic pricing and superior guest experiences.
- Strong performing properties (Top 25%) earn $1,570 or more, indicating effective management and desirable locations/amenities.
- Typical properties (Median) generate around $805 per month, representing the average market performance.
- Entry-level properties (Bottom 25%) see earnings around $400, often with potential for optimization.
Average Monthly Airbnb Earnings Trend in Windhoek
Windhoek Airbnb Occupancy Rate Trends (2026)
Maximize your bookings by understanding the Windhoek STR occupancy trends. Seasonal demand shifts significantly influence how often properties are booked. Typically, Augustsees the highest demand (peak season occupancy), while October experiences the lowest (low season). Effective strategies, like adjusting minimum stays or offering promotions, can boost occupancy during slower periods. Here's how different property tiers perform in Windhoek:
- Best-in-class properties (Top 10%) achieve 72%+ occupancy, indicating high desirability and potentially optimized availability.
- Strong performing properties (Top 25%) maintain 58% or higher occupancy, suggesting good market fit and guest satisfaction.
- Typical properties (Median) have an occupancy rate around 29%.
- Entry-level properties (Bottom 25%) average 15% occupancy, potentially facing higher vacancy.
Average Monthly Occupancy Rate Trend in Windhoek
Average Daily Rate (ADR) Airbnb Trends in Windhoek (2026)
Effective short term rental pricing strategy in Windhoek involves understanding monthly ADR fluctuations. The Average Daily Rate (ADR) for Airbnb in Windhoek typically peaks in April and dips lowest during September. Leveraging Airbnb dynamic pricing tools or strategies based on this seasonality can significantly boost revenue. Here's a look at the typical nightly rates achieved:
- Best-in-class properties (Top 10%) command rates of $130+ per night, often due to premium features or locations.
- Strong performing properties (Top 25%) achieve nightly rates of $86 or more.
- Typical properties (Median) charge around $51 per night.
- Entry-level properties (Bottom 25%) earn around $33 per night.
Average Daily Rate (ADR) Trend by Month in Windhoek
Get Live Windhoek Market Intelligence 👇
Explore Real-time Analytics
Airbnb Seasonality Analysis & Trends in Windhoek (2025)
Peak Season (May, June, August)
- Revenue averages $1,782 per month
- Occupancy rates average 41.8%
- Daily rates average $66
Shoulder Season
- Revenue averages $1,133 per month
- Occupancy maintains around 35.8%
- Daily rates hold near $75
Low Season (February, October, December)
- Revenue drops to average $947 per month
- Occupancy decreases to average 34.7%
- Daily rates adjust to average $76
Seasonality Insights for Windhoek
- The Airbnb seasonality in Windhoek shows highly seasonal trends requiring careful strategy. While the sections above show seasonal averages, it's also insightful to look at the extremes:
- During the high season, the absolute peak month showcases Windhoek's highest earning potential, with monthly revenues capable of climbing to $2,181, occupancy reaching a high of 48.8%, and ADRs peaking at $85.
- Conversely, the slowest single month of the year, typically falling within the low season, marks the market's lowest point. In this month, revenue might dip to $895, occupancy could drop to 28.5%, and ADRs may adjust down to $64.
- Understanding both the seasonal averages and these monthly peaks and troughs in revenue, occupancy, and ADR is crucial for maximizing your Airbnb profit potential in Windhoek.
Seasonal Strategies for Maximizing Profit
- Peak Season: Maximize revenue through premium pricing and potentially longer minimum stays. Ensure high availability.
- Low Season: Offer competitive pricing, special promotions (e.g., extended stay discounts), and flexible cancellation policies. Target off-season travelers like remote workers or budget-conscious guests.
- Shoulder Seasons: Implement dynamic pricing that balances peak and low rates. Target weekend travelers or specific events. Offer slightly more flexible terms than peak season.
- Regularly analyze your own performance against these Windhoek seasonality benchmarks and adjust your pricing and availability strategy accordingly.
Best Areas for Airbnb Investment in Windhoek (2026)
Exploring the top neighborhoods for short-term rentals in Windhoek? This section highlights key areas, outlining why they are attractive for hosts and guests, along with notable local attractions. Consider these locations based on your target guest profile and investment strategy.
| Neighborhood / Area | Why Host Here? (Target Guests & Appeal) | Key Attractions & Landmarks |
|---|---|---|
| Windhoek City Centre | The heart of Windhoek, offering a mix of cultural attractions, shopping, and dining. It's ideal for tourists who want to be near museums, restaurants, and city life. | Independence Memorial Museum, Christ Church, Namibia Craft Centre, Post Street Mall, Gemini Giraffe Centre |
| Klein Windhoek | A quieter, more residential area with a suburban feel. Known for its lush gardens and family-friendly atmosphere, it attracts those looking for a peaceful stay close to the city. | Klein Windhoek Cemetery, Windhoek Golf Club, Zoo Park, Namibia University of Science and Technology |
| Southern Industrial Area | An industrial area becoming popular for affordable accommodations close to business centers. Ideal for business travelers and those needing easy access to transportation. | Southern Industry cemeteries, Various factories and warehouses |
| Wanaheda | A diverse neighborhood that is more residential with a mix of local culture. Offers a unique experience for visitors who want to explore local life beyond the typical tourist scene. | Local shops and markets, Community parks, Cultural events |
| Kapps Farm | Located on the outskirts, this area offers a more rural experience while still being accessible to the city. Great for nature lovers and those seeking tranquility away from city bustle. | Outdoor hiking trails, Scenic views, Wildlife spotting |
| Windhoek North | An emerging area with new developments and amenities. It attracts young professionals and families, making it a promising location for short-term rentals. | Modern shopping centers, Community parks, Sports facilities |
| Khomasdal | A vibrant neighborhood with local markets and cultural experiences. It's great for guests wanting to immerse themselves in local life and cuisine. | Khomasdal Market, Local eateries, Cultural festivals |
| Eros | A residential area known for its tree-lined streets and proximity to the airport. It's convenient for travelers looking for a peaceful environment near the city. | Eros Airport, Local parks and recreational areas, Residential charm |
Understanding Airbnb License Requirements & STR Laws in Windhoek (2026)
While Windhoek, Khomas Region, Namibia currently shows low STR regulations, specific Airbnb license requirements might still exist or change. Always verify the latest short term rental regulations and Airbnb license requirements directly with local government authorities for Windhoek to ensure full compliance before hosting.
(Source: AirROI data, 2026, finding no licensed listings among those analyzed)
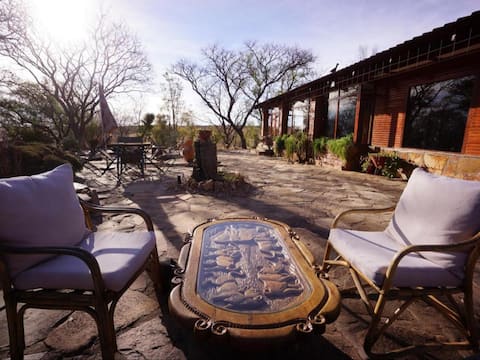
Top Performing Airbnb Properties in Windhoek (2026)
Benchmark your potential! Explore examples of top-performing Airbnb properties in Windhoekbased on Trailing Twelve Month (TTM) revenue. Analyze their characteristics, revenue, occupancy rate, and ADR to understand what drives success in this market.

Leopard’s View Mountain Villa - Steinheim Farm
Entire Place • 4 bedrooms

Country living at it's best
Entire Place • 2 bedrooms
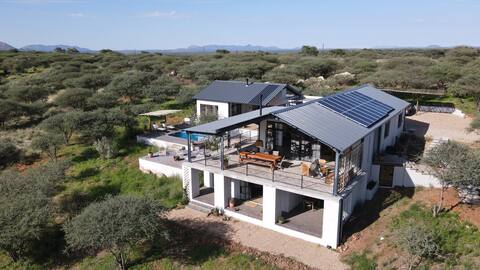
Villa in the Bushveld
Entire Place • 3 bedrooms
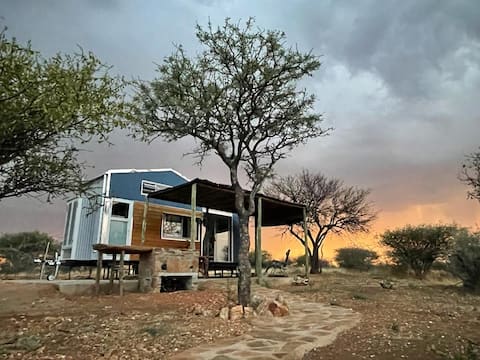
BellaTiny House & Gypsy Wagon - with great views
Entire Place • 2 bedrooms
Self-catering Bungalow- Overwintering
Private Room • 1 bedroom
Connect with Nature
Entire Place • 1 bedroom
Note: Performance varies based on location, size, amenities, seasonality, and management quality. Data reflects the past 12 months.
Top Performing Airbnb Hosts in Windhoek (2026)
Learn from the best! This table showcases top-performing Airbnb hosts in Windhoek based on the number of properties managed and estimated total revenue over the past year. Analyze their scale and performance metrics.
| Host Name | Properties | Grossing Revenue | Stay Reviews | Avg Rating |
|---|---|---|---|---|
| Barbara | 1 | $57,197 | 9 | 5.00/5.0 |
| Irma | 1 | $25,636 | 9 | 5.00/5.0 |
| Host #39355652 | 3 | $25,107 | 0 | 0.00/5.0 |
| Host #19362970 | 1 | $19,084 | 0 | 0.00/5.0 |
| Sybille | 1 | $15,178 | 39 | 5.00/5.0 |
| Nikolai Johannes | 2 | $9,928 | 60 | 4.67/5.0 |
| Host #102549890 | 1 | $9,877 | 0 | 0.00/5.0 |
| Eike | 1 | $5,663 | 22 | 5.00/5.0 |
| Niklas | 1 | $5,591 | 5 | 4.40/5.0 |
| Danica | 1 | $3,362 | 11 | 4.64/5.0 |
Analyzing the strategies of top hosts, such as their property selection, pricing, and guest communication, can offer valuable lessons for optimizing your own Airbnb operations in Windhoek.
Dive Deeper: Advanced Windhoek STR Market Data (2026)
Ready to unlock more insights? AirROI provides access to advanced metrics and comprehensive Airbnb data for Windhoek. Explore detailed analytics beyond this report to refine your investment strategy, optimize pricing, and maximize your vacation rental profits.
Explore Advanced MetricsWindhoek Short-Term Rental Market Composition (2026): Property & Room Types
Room Type Distribution
Property Type Distribution
Market Composition Insights for Windhoek
- The Windhoek Airbnb market composition is heavily skewed towards Entire Home/Apt listings, which make up 77.8% of the 18 active rentals. This indicates strong guest preference for privacy and space.
- Looking at the property type distribution in Windhoek, House properties are the most common (50%), reflecting the local real estate landscape.
- Houses represent a significant 50% portion, catering likely to families or larger groups.
- The presence of 11.1% Hotel/Boutique listings indicates integration with traditional hospitality.
Windhoek Airbnb Room Capacity Analysis (2026): Bedroom Distribution
Distribution of Listings by Number of Bedrooms
Room Capacity Insights for Windhoek
- The dominant room capacity in Windhoek is 1 bedroom listings, making up 38.9% of the market. This suggests a strong demand for properties suitable for couples or solo travelers.
- Together, 1 bedroom and 2 bedrooms properties represent 72.2% of the active Airbnb listings in Windhoek, indicating a high concentration in these sizes.
- A significant 27.8% of listings offer 3+ bedrooms, catering to larger groups and families seeking more space in Windhoek.
Windhoek Vacation Rental Guest Capacity Trends (2026)
Distribution of Listings by Guest Capacity
Guest Capacity Insights for Windhoek
- The most common guest capacity trend in Windhoek vacation rentals is listings accommodating 2 guests (38.9%). This suggests the primary traveler segment is likely couples or solo travelers.
- Properties designed for 2 guests and 4 guests dominate the Windhoek STR market, accounting for 72.2% of listings.
- 27.8% of properties accommodate 6+ guests, serving the market segment for larger families or group travel in Windhoek.
- On average, properties in Windhoek are equipped to host 4.1 guests.
Windhoek Airbnb Booking Patterns (2026): Available vs. Booked Days
Available Days Distribution
Booked Days Distribution
Booking Pattern Insights for Windhoek
- The most common availability pattern in Windhoek falls within the 271-366 days range, representing 44.4% of listings. This suggests many properties have significant open periods on their calendars.
- Approximately 83.3% of listings show high availability (181+ days open annually), indicating potential for increased bookings or specific owner usage patterns.
- For booked days, the 91-180 days range is most frequent in Windhoek (38.9%), reflecting common guest stay durations or potential owner blocking patterns.
- A notable 16.7% of properties secure long booking periods (181+ days booked per year), highlighting successful long-term rental strategies or significant owner usage.
Windhoek Airbnb Minimum Stay Requirements Analysis
Distribution of Listings by Minimum Night Requirement
1 Night
11 listings
68.8% of total
2 Nights
3 listings
18.8% of total
3 Nights
1 listings
6.3% of total
7-29 Nights
1 listings
6.3% of total
Key Insights
- The most prevalent minimum stay requirement in Windhoek is 1 Night, adopted by 68.8% of listings. This highlights the market's preference for shorter, flexible bookings.
- A strong majority (87.6%) of the Windhoek Airbnb data shows acceptance of very short stays (1-2 nights), indicating a dynamic, high-turnover market.
Recommendations
- Align with the market by considering a 1 Night minimum stay, as 68.8% of Windhoek hosts use this setting.
- Adjust minimum nights based on seasonality – potentially shorter during low season and longer during peak demand periods in Windhoek.
Windhoek Airbnb Cancellation Policy Trends Analysis (2026)
Non-refundable
3 listings
30% of total
Flexible
5 listings
50% of total
Moderate
1 listings
10% of total
Firm
1 listings
10% of total
Cancellation Policy Insights for Windhoek
- The prevailing Airbnb cancellation policy trend in Windhoek is Flexible, used by 50% of listings.
- There's a relatively balanced mix between guest-friendly (60.0%) and stricter (10.0%) policies, offering choices for different guest needs.
Recommendations for Hosts
- Consider adopting a Flexible policy to align with the 50% market standard in Windhoek.
- Regularly review your cancellation policy against competitors and market demand shifts in Windhoek.
Windhoek STR Booking Lead Time Analysis (2026)
Average Booking Lead Time by Month
Booking Lead Time Insights for Windhoek
- The overall average booking lead time for vacation rentals in Windhoek is 46 days.
- Guests book furthest in advance for stays during June (average 95 days), likely coinciding with peak travel demand or local events.
- The shortest booking windows occur for stays in July (average 30 days), indicating more last-minute travel plans during this time.
- Seasonally, Fall (61 days avg.) sees the longest lead times, while Summer (52 days avg.) has the shortest, reflecting typical travel planning cycles.
Recommendations for Hosts
- Use the overall average lead time (46 days) as a baseline for your pricing and availability strategy in Windhoek.
- For June stays, consider implementing length-of-stay discounts or slightly higher rates for bookings made less than 95 days out to capitalize on advance planning.
- Target marketing efforts for the Fall season well in advance (at least 61 days) to capture early planners.
- Monitor your own booking lead times against these Windhoek averages to identify opportunities for dynamic pricing adjustments.
Popular & Essential Airbnb Amenities in Windhoek (2026)
Amenity Prevalence
Amenity Insights for Windhoek
- Essential amenities in Windhoek that guests expect include: Essentials. Lacking these (this) could significantly impact bookings.
- Popular amenities like Kitchen, Hot water, BBQ grill are common but not universal. Offering these can provide a competitive edge.
- Warning: Wifi is not universally provided but is considered essential globally. Ensure reliable Wifi is offered.
Recommendations for Hosts
- Ensure your listing includes all essential amenities for Windhoek: Essentials.
- Consider adding popular differentiators like Kitchen or Hot water to increase appeal.
- Highlight unique or less common amenities you offer (e.g., hot tub, dedicated workspace, EV charger) in your listing description and photos.
- Regularly check competitor amenities in Windhoek to stay competitive.
Windhoek Airbnb Guest Demographics & Profile Analysis (2026)
Guest Profile Summary for Windhoek
- The typical guest profile for Airbnb in Windhoek consists of predominantly international visitors (78%), with top international origins including Namibia, typically belonging to the Post-2000s (Gen Z/Alpha) group (50%), primarily speaking English or German.
- Domestic travelers account for 21.8% of guests.
- Key international markets include Germany (25.5%) and Namibia (21.8%).
- Top languages spoken are English (44.9%) followed by German (26.1%).
- A significant demographic segment is the Post-2000s (Gen Z/Alpha) group, representing 50% of guests.
Recommendations for Hosts
- Focus marketing internationally, particularly towards travelers from Namibia.
- Tailor amenities and listing descriptions to appeal to the dominant Post-2000s (Gen Z/Alpha) demographic (e.g., highlight fast WiFi, smart home features, local guides).
- Highlight unique local experiences or amenities relevant to the primary guest profile.
- Consider seasonal promotions aligned with peak travel times for key origin markets.
Nearby Short-Term Rental Market Comparison
How does the Windhoek Airbnb market stack up against its neighbors? Compare key performance metrics like average monthly revenue, ADR, and occupancy rates in surrounding areas to understand the broader regional STR landscape.
| Market | Active Properties | Monthly Revenue | Daily Rate | Avg. Occupancy |
|---|---|---|---|---|
| Windhoek | 422 | $700 | $76.77 | 36% |