Catiri Airbnb Market Analysis 2026: Short Term Rental Data & Vacation Rental Statistics in Aruba, Netherlands
Is Airbnb profitable in Catiri in 2026? Explore comprehensive Airbnb analytics for Catiri, Aruba, Netherlands to uncover income potential. This 2026 STR market report for Catiri, based on AirROI data from February 2025 to January 2026, reveals key trends in the niche market of 45 active listings.
Whether you're considering an Airbnb investment in Catiri, optimizing your existing vacation rental, or exploring rental arbitrage opportunities, understanding the Catiri Airbnb data is crucial. Leveraging the low regulation environment is key to maximizing your short term rental income potential. Let's dive into the specifics.
Key Catiri Airbnb Performance Metrics Overview
Monthly Airbnb Revenue Variations & Income Potential in Catiri (2026)
Understanding the monthly revenue variations for Airbnb listings in Catiri is key to maximizing your short term rental income potential. Seasonality significantly impacts earnings. Our analysis, based on data from the past 12 months, shows that the peak revenue month for STRs in Catiri is typically March, while April often presents the lowest earnings, highlighting opportunities for strategic pricing adjustments during shoulder and low seasons. Explore the typical Airbnb income in Catiri across different performance tiers:
- Best-in-class properties (Top 10%) achieve $12,217+ monthly, often utilizing dynamic pricing and superior guest experiences.
- Strong performing properties (Top 25%) earn $6,476 or more, indicating effective management and desirable locations/amenities.
- Typical properties (Median) generate around $2,395 per month, representing the average market performance.
- Entry-level properties (Bottom 25%) see earnings around $1,481, often with potential for optimization.
Average Monthly Airbnb Earnings Trend in Catiri
Catiri Airbnb Occupancy Rate Trends (2026)
Maximize your bookings by understanding the Catiri STR occupancy trends. Seasonal demand shifts significantly influence how often properties are booked. Typically, Februarysees the highest demand (peak season occupancy), while April experiences the lowest (low season). Effective strategies, like adjusting minimum stays or offering promotions, can boost occupancy during slower periods. Here's how different property tiers perform in Catiri:
- Best-in-class properties (Top 10%) achieve 89%+ occupancy, indicating high desirability and potentially optimized availability.
- Strong performing properties (Top 25%) maintain 81% or higher occupancy, suggesting good market fit and guest satisfaction.
- Typical properties (Median) have an occupancy rate around 65%.
- Entry-level properties (Bottom 25%) average 41% occupancy, potentially facing higher vacancy.
Average Monthly Occupancy Rate Trend in Catiri
Average Daily Rate (ADR) Airbnb Trends in Catiri (2026)
Effective short term rental pricing strategy in Catiri involves understanding monthly ADR fluctuations. The Average Daily Rate (ADR) for Airbnb in Catiri typically peaks in December and dips lowest during September. Leveraging Airbnb dynamic pricing tools or strategies based on this seasonality can significantly boost revenue. Here's a look at the typical nightly rates achieved:
- Best-in-class properties (Top 10%) command rates of $581+ per night, often due to premium features or locations.
- Strong performing properties (Top 25%) achieve nightly rates of $290 or more.
- Typical properties (Median) charge around $133 per night.
- Entry-level properties (Bottom 25%) earn around $86 per night.
Average Daily Rate (ADR) Trend by Month in Catiri
Get Live Catiri Market Intelligence 👇
Explore Real-time Analytics
Airbnb Seasonality Analysis & Trends in Catiri (2026)
Peak Season (March, December, January)
- Revenue averages $5,611 per month
- Occupancy rates average 64.3%
- Daily rates average $280
Shoulder Season
- Revenue averages $4,636 per month
- Occupancy maintains around 60.2%
- Daily rates hold near $245
Low Season (April, September, October)
- Revenue drops to average $3,448 per month
- Occupancy decreases to average 54.6%
- Daily rates adjust to average $219
Seasonality Insights for Catiri
- The Airbnb seasonality in Catiri shows moderate seasonality with distinct peak and low periods. While the sections above show seasonal averages, it's also insightful to look at the extremes:
- During the high season, the absolute peak month showcases Catiri's highest earning potential, with monthly revenues capable of climbing to $5,728, occupancy reaching a high of 73.6%, and ADRs peaking at $293.
- Conversely, the slowest single month of the year, typically falling within the low season, marks the market's lowest point. In this month, revenue might dip to $3,349, occupancy could drop to 50.1%, and ADRs may adjust down to $206.
- Understanding both the seasonal averages and these monthly peaks and troughs in revenue, occupancy, and ADR is crucial for maximizing your Airbnb profit potential in Catiri.
Seasonal Strategies for Maximizing Profit
- Peak Season: Maximize revenue through premium pricing and potentially longer minimum stays. Ensure high availability.
- Low Season: Offer competitive pricing, special promotions (e.g., extended stay discounts), and flexible cancellation policies. Target off-season travelers like remote workers or budget-conscious guests.
- Shoulder Seasons: Implement dynamic pricing that balances peak and low rates. Target weekend travelers or specific events. Offer slightly more flexible terms than peak season.
- Regularly analyze your own performance against these Catiri seasonality benchmarks and adjust your pricing and availability strategy accordingly.
Best Areas for Airbnb Investment in Catiri (2026)
Exploring the top neighborhoods for short-term rentals in Catiri? This section highlights key areas, outlining why they are attractive for hosts and guests, along with notable local attractions. Consider these locations based on your target guest profile and investment strategy.
| Neighborhood / Area | Why Host Here? (Target Guests & Appeal) | Key Attractions & Landmarks |
|---|---|---|
| Palm Beach | Famous for its beautiful beaches, resorts, and vibrant nightlife. A prime tourist destination with a variety of water sports and dining options. | Palm Beach, Eagle Beach, Aruba Butterfly Farm, Palm Beach Plaza Mall, Renaissance Island |
| Oranjestad | The capital city of Aruba with colorful buildings and a rich cultural heritage. Great for tourists interested in shopping, dining, and history. | Aruba's National Museum, Renaissance Marketplace, Fort Zoutman, The Royal Plaza Mall, Wilhelmina Park |
| Noord | A vibrant district known for its local restaurants and proximity to the famous beaches. A great place for families and those seeking a quieter experience. | Boca Catalina, Arashi Beach, Palm Island, Casibari Rock Formations, Local eateries |
| Savaneta | Known for its authentic Aruban charm, this area offers a more local vibe and is close to secluded beaches, perfect for travelers looking for tranquility. | Mangel Halto Beach, Zeerover, Savaneta Beach, Pos Chiquito, Local seafood restaurants |
| San Nicolas | A historic town with a thriving arts scene. Known for its murals and cultural events, appealing to those wanting an off-the-beaten-path experience. | ArtisA Gallery, The San Nicolas Carnival, Sunset Beach, Local street art, Sasha's Beach Bar |
| Baby Beach | An idyllic beach known for its calm waters, ideal for families and snorkelers. Attracts tourists looking for a peaceful beach day. | Baby Beach, Rodger’s Beach, Snorkeling spots, Beachside bars, Relaxation areas |
| Malmok | A quieter area with beautiful beaches and excellent snorkeling opportunities, catering to those seeking a more laid-back island experience. | Malmok Beach, Awesome snorkeling spots, Boca Catalina, Local beach bars, Sunset views |
| Charlotte's Winds | A more secluded part of the island perfect for kite surfers and those looking to escape the crowded tourist spots. | Kite surfing spots, Natural landscapes, Peaceful beach areas, Local fish shacks, Quiet beaches |
Understanding Airbnb License Requirements & STR Laws in Catiri (2026)
While Catiri, Aruba, Netherlands currently shows low STR regulations, specific Airbnb license requirements might still exist or change. Always verify the latest short term rental regulations and Airbnb license requirements directly with local government authorities for Catiri to ensure full compliance before hosting.
(Source: AirROI data, 2026, finding no licensed listings among those analyzed)
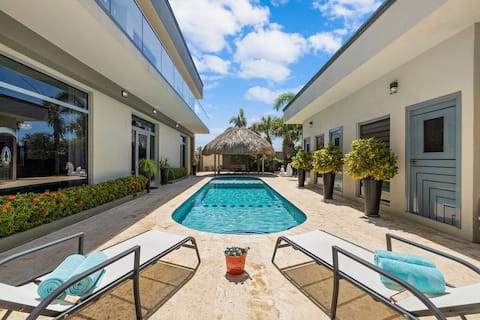
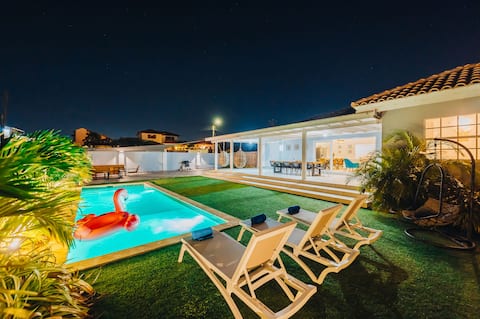
Top Performing Airbnb Properties in Catiri (2026)
Benchmark your potential! Explore examples of top-performing Airbnb properties in Catiribased on Trailing Twelve Month (TTM) revenue. Analyze their characteristics, revenue, occupancy rate, and ADR to understand what drives success in this market.

Luxury Retreat in Nature | Zen Garden by Bocobay
Entire Place • 5 bedrooms

Luxury 5BR Home w/ Pool | Casa Graziano by Bocobay
Entire Place • 5 bedrooms
Magical Designer Oasis ~ Large Pool & Cabana ~View
Entire Place • 6 bedrooms

Private Retreat w/ 5 BR Spa, Pool & Jacuzzi
Entire Place • 5 bedrooms
Local Vibes Villa, Big Pool and Outdoor, 10 sleeps
Entire Place • 5 bedrooms

Tropical Villa w/ Saltwater Pool & Outdoor Kitchen
Entire Place • 3 bedrooms
Note: Performance varies based on location, size, amenities, seasonality, and management quality. Data reflects the past 12 months.
Top Performing Airbnb Hosts in Catiri (2026)
Learn from the best! This table showcases top-performing Airbnb hosts in Catiri based on the number of properties managed and estimated total revenue over the past year. Analyze their scale and performance metrics.
| Host Name | Properties | Grossing Revenue | Stay Reviews | Avg Rating |
|---|---|---|---|---|
| VacationAruba | 7 | $551,518 | 374 | 4.95/5.0 |
| Bocobay Aruba | 2 | $366,195 | 93 | 4.62/5.0 |
| Justin & Sandra | 7 | $179,144 | 491 | 4.81/5.0 |
| Raymond | 1 | $129,639 | 45 | 4.93/5.0 |
| William | 1 | $117,209 | 27 | 4.96/5.0 |
| Jan | 1 | $81,544 | 331 | 4.93/5.0 |
| Manon | 1 | $76,630 | 41 | 4.95/5.0 |
| Jose | 2 | $69,263 | 394 | 4.95/5.0 |
| Erik And Martha | 1 | $68,063 | 42 | 4.90/5.0 |
| Rosana | 1 | $40,346 | 17 | 4.71/5.0 |
Analyzing the strategies of top hosts, such as their property selection, pricing, and guest communication, can offer valuable lessons for optimizing your own Airbnb operations in Catiri.
Dive Deeper: Advanced Catiri STR Market Data (2026)
Ready to unlock more insights? AirROI provides access to advanced metrics and comprehensive Airbnb data for Catiri. Explore detailed analytics beyond this report to refine your investment strategy, optimize pricing, and maximize your vacation rental profits.
Explore Advanced MetricsCatiri Short-Term Rental Market Composition (2026): Property & Room Types
Room Type Distribution
Property Type Distribution
Market Composition Insights for Catiri
- The Catiri Airbnb market composition is heavily skewed towards Entire Home/Apt listings, which make up 95.6% of the 45 active rentals. This indicates strong guest preference for privacy and space.
- Looking at the property type distribution in Catiri, House properties are the most common (48.9%), reflecting the local real estate landscape.
- Houses represent a significant 48.9% portion, catering likely to families or larger groups.
- Smaller segments like hotel/boutique, others, outdoor/unique (combined 6.6%) offer potential for unique stay experiences.
Catiri Airbnb Room Capacity Analysis (2026): Bedroom Distribution
Distribution of Listings by Number of Bedrooms
Room Capacity Insights for Catiri
- The dominant room capacity in Catiri is 1 bedroom listings, making up 40% of the market. This suggests a strong demand for properties suitable for couples or solo travelers.
- Together, 1 bedroom and 2 bedrooms properties represent 60.0% of the active Airbnb listings in Catiri, indicating a high concentration in these sizes.
- A significant 40.0% of listings offer 3+ bedrooms, catering to larger groups and families seeking more space in Catiri.
Catiri Vacation Rental Guest Capacity Trends (2026)
Distribution of Listings by Guest Capacity
Guest Capacity Insights for Catiri
- The most common guest capacity trend in Catiri vacation rentals is listings accommodating 8+ guests (26.7%). This suggests the primary traveler segment is likely larger groups.
- Properties designed for 8+ guests and 2 guests dominate the Catiri STR market, accounting for 53.4% of listings.
- 40.0% of properties accommodate 6+ guests, serving the market segment for larger families or group travel in Catiri.
- On average, properties in Catiri are equipped to host 4.7 guests.
Catiri Airbnb Booking Patterns (2026): Available vs. Booked Days
Available Days Distribution
Booked Days Distribution
Booking Pattern Insights for Catiri
- The most common availability pattern in Catiri falls within the 91-180 days range, representing 31.1% of listings. This suggests many properties have significant open periods on their calendars.
- Approximately 44.4% of listings show high availability (181+ days open annually), indicating potential for increased bookings or specific owner usage patterns.
- For booked days, the 181-270 days range is most frequent in Catiri (31.1%), reflecting common guest stay durations or potential owner blocking patterns.
- A notable 55.5% of properties secure long booking periods (181+ days booked per year), highlighting successful long-term rental strategies or significant owner usage.
Catiri Airbnb Minimum Stay Requirements Analysis
Distribution of Listings by Minimum Night Requirement
1 Night
3 listings
6.7% of total
2 Nights
8 listings
17.8% of total
3 Nights
6 listings
13.3% of total
4-6 Nights
4 listings
8.9% of total
30+ Nights
24 listings
53.3% of total
Key Insights
- The most prevalent minimum stay requirement in Catiri is 30+ Nights, adopted by 53.3% of listings. This highlights the market's preference for longer commitments.
- A significant segment (53.3%) caters to monthly stays (30+ nights) in Catiri, pointing to opportunities in the extended-stay market.
Recommendations
- Align with the market by considering a 30+ Nights minimum stay, as 53.3% of Catiri hosts use this setting.
- If feasible, allowing 1-night stays, especially midweek or during low season, could capture last-minute bookings, as only 6.7% currently do.
- Explore offering discounts for stays of 30+ nights to attract the 53.3% of the market seeking extended stays.
- Adjust minimum nights based on seasonality – potentially shorter during low season and longer during peak demand periods in Catiri.
Catiri Airbnb Cancellation Policy Trends Analysis (2026)
Limited
1 listings
2.2% of total
Super Strict 30 Days
3 listings
6.7% of total
Flexible
11 listings
24.4% of total
Moderate
13 listings
28.9% of total
Firm
15 listings
33.3% of total
Strict
2 listings
4.4% of total
Cancellation Policy Insights for Catiri
- The prevailing Airbnb cancellation policy trend in Catiri is Firm, used by 33.3% of listings.
- There's a relatively balanced mix between guest-friendly (53.3%) and stricter (37.7%) policies, offering choices for different guest needs.
- Strict cancellation policies are quite rare (4.4%), potentially making listings with this policy less competitive unless justified by high demand or property type.
Recommendations for Hosts
- Consider adopting a Firm policy to align with the 33.3% market standard in Catiri.
- Using a Strict policy might deter some guests, as only 4.4% of listings use it. Evaluate if potential revenue protection outweighs possible lower booking rates.
- Regularly review your cancellation policy against competitors and market demand shifts in Catiri.
Catiri STR Booking Lead Time Analysis (2026)
Average Booking Lead Time by Month
Booking Lead Time Insights for Catiri
- The overall average booking lead time for vacation rentals in Catiri is 58 days.
- Guests book furthest in advance for stays during February (average 77 days), likely coinciding with peak travel demand or local events.
- The shortest booking windows occur for stays in May (average 45 days), indicating more last-minute travel plans during this time.
- Seasonally, Winter (75 days avg.) sees the longest lead times, while Summer (56 days avg.) has the shortest, reflecting typical travel planning cycles.
Recommendations for Hosts
- Use the overall average lead time (58 days) as a baseline for your pricing and availability strategy in Catiri.
- For February stays, consider implementing length-of-stay discounts or slightly higher rates for bookings made less than 77 days out to capitalize on advance planning.
- Target marketing efforts for the Winter season well in advance (at least 75 days) to capture early planners.
- Monitor your own booking lead times against these Catiri averages to identify opportunities for dynamic pricing adjustments.
Popular & Essential Airbnb Amenities in Catiri (2026)
Amenity Prevalence
Amenity Insights for Catiri
- Essential amenities in Catiri that guests expect include: Wifi, Air conditioning, TV, Kitchen, Refrigerator, Dishes and silverware, Free parking on premises. Lacking these (any) could significantly impact bookings.
- Popular amenities like Iron, Hangers, Coffee maker are common but not universal. Offering these can provide a competitive edge.
Recommendations for Hosts
- Ensure your listing includes all essential amenities for Catiri: Wifi, Air conditioning, TV, Kitchen, Refrigerator, Dishes and silverware, Free parking on premises.
- Prioritize adding missing essentials: Kitchen, Refrigerator, Dishes and silverware, Free parking on premises.
- Consider adding popular differentiators like Iron or Hangers to increase appeal.
- Highlight unique or less common amenities you offer (e.g., hot tub, dedicated workspace, EV charger) in your listing description and photos.
- Regularly check competitor amenities in Catiri to stay competitive.
Catiri Airbnb Guest Demographics & Profile Analysis (2026)
Guest Profile Summary for Catiri
- The typical guest profile for Airbnb in Catiri consists of predominantly international visitors (95%), with top international origins including Canada, typically belonging to the Post-2000s (Gen Z/Alpha) group (50%), primarily speaking English or Spanish.
- Domestic travelers account for 5.4% of guests.
- Key international markets include United States (51.5%) and Canada (9.2%).
- Top languages spoken are English (48.3%) followed by Spanish (25.3%).
- A significant demographic segment is the Post-2000s (Gen Z/Alpha) group, representing 50% of guests.
Recommendations for Hosts
- Focus marketing internationally, particularly towards travelers from Canada.
- Tailor amenities and listing descriptions to appeal to the dominant Post-2000s (Gen Z/Alpha) demographic (e.g., highlight fast WiFi, smart home features, local guides).
- Highlight unique local experiences or amenities relevant to the primary guest profile.
- Consider seasonal promotions aligned with peak travel times for key origin markets.
Nearby Short-Term Rental Market Comparison
How does the Catiri Airbnb market stack up against its neighbors? Compare key performance metrics like average monthly revenue, ADR, and occupancy rates in surrounding areas to understand the broader regional STR landscape.
| Market | Active Properties | Monthly Revenue | Daily Rate | Avg. Occupancy |
|---|---|---|---|---|
| Malmok Beach | 81 | $11,669 | $702.93 | 56% |
| Punta Brabo | 284 | $6,312 | $434.21 | 57% |
| Savaneta | 61 | $5,596 | $333.99 | 60% |
| Tierra Del Sol | 169 | $4,888 | $355.61 | 54% |
| West Punt | 557 | $4,519 | $327.74 | 51% |
| San Nicolaas | 55 | $4,489 | $273.05 | 50% |
| Bubali | 715 | $4,420 | $309.30 | 56% |
| Sint Willibrordus | 64 | $4,293 | $411.99 | 46% |
| Noord | 567 | $3,681 | $300.19 | 54% |
| Jan Kok | 14 | $3,631 | $318.79 | 47% |