Rutten Airbnb Market Analysis 2026: Short Term Rental Data & Vacation Rental Statistics in Flevoland, Netherlands
Is Airbnb profitable in Rutten in 2026? Explore comprehensive Airbnb analytics for Rutten, Flevoland, Netherlands to uncover income potential. This 2026 STR market report for Rutten, based on AirROI data from January 2025 to December 2025, reveals key trends in the niche market of 19 active listings.
Whether you're considering an Airbnb investment in Rutten, optimizing your existing vacation rental, or exploring rental arbitrage opportunities, understanding the Rutten Airbnb data is crucial. Leveraging the low regulation environment is key to maximizing your short term rental income potential. Let's dive into the specifics.
Key Rutten Airbnb Performance Metrics Overview
Monthly Airbnb Revenue Variations & Income Potential in Rutten (2026)
Understanding the monthly revenue variations for Airbnb listings in Rutten is key to maximizing your short term rental income potential. Seasonality significantly impacts earnings. Our analysis, based on data from the past 12 months, shows that the peak revenue month for STRs in Rutten is typically August, while January often presents the lowest earnings, highlighting opportunities for strategic pricing adjustments during shoulder and low seasons. Explore the typical Airbnb income in Rutten across different performance tiers:
- Best-in-class properties (Top 10%) achieve $3,121+ monthly, often utilizing dynamic pricing and superior guest experiences.
- Strong performing properties (Top 25%) earn $2,106 or more, indicating effective management and desirable locations/amenities.
- Typical properties (Median) generate around $1,392 per month, representing the average market performance.
- Entry-level properties (Bottom 25%) see earnings around $946, often with potential for optimization.
Average Monthly Airbnb Earnings Trend in Rutten
Rutten Airbnb Occupancy Rate Trends (2026)
Maximize your bookings by understanding the Rutten STR occupancy trends. Seasonal demand shifts significantly influence how often properties are booked. Typically, Novembersees the highest demand (peak season occupancy), while January experiences the lowest (low season). Effective strategies, like adjusting minimum stays or offering promotions, can boost occupancy during slower periods. Here's how different property tiers perform in Rutten:
- Best-in-class properties (Top 10%) achieve 86%+ occupancy, indicating high desirability and potentially optimized availability.
- Strong performing properties (Top 25%) maintain 61% or higher occupancy, suggesting good market fit and guest satisfaction.
- Typical properties (Median) have an occupancy rate around 45%.
- Entry-level properties (Bottom 25%) average 34% occupancy, potentially facing higher vacancy.
Average Monthly Occupancy Rate Trend in Rutten
Average Daily Rate (ADR) Airbnb Trends in Rutten (2026)
Effective short term rental pricing strategy in Rutten involves understanding monthly ADR fluctuations. The Average Daily Rate (ADR) for Airbnb in Rutten typically peaks in August and dips lowest during April. Leveraging Airbnb dynamic pricing tools or strategies based on this seasonality can significantly boost revenue. Here's a look at the typical nightly rates achieved:
- Best-in-class properties (Top 10%) command rates of $132+ per night, often due to premium features or locations.
- Strong performing properties (Top 25%) achieve nightly rates of $112 or more.
- Typical properties (Median) charge around $89 per night.
- Entry-level properties (Bottom 25%) earn around $81 per night.
Average Daily Rate (ADR) Trend by Month in Rutten
Get Live Rutten Market Intelligence 👇
Explore Real-time Analytics
Airbnb Seasonality Analysis & Trends in Rutten (2025)
Peak Season (August, November, October)
- Revenue averages $2,394 per month
- Occupancy rates average 69.1%
- Daily rates average $102
Shoulder Season
- Revenue averages $1,696 per month
- Occupancy maintains around 51.4%
- Daily rates hold near $95
Low Season (January, February, September)
- Revenue drops to average $858 per month
- Occupancy decreases to average 27.4%
- Daily rates adjust to average $95
Seasonality Insights for Rutten
- The Airbnb seasonality in Rutten shows highly seasonal trends requiring careful strategy. While the sections above show seasonal averages, it's also insightful to look at the extremes:
- During the high season, the absolute peak month showcases Rutten's highest earning potential, with monthly revenues capable of climbing to $2,556, occupancy reaching a high of 75.6%, and ADRs peaking at $105.
- Conversely, the slowest single month of the year, typically falling within the low season, marks the market's lowest point. In this month, revenue might dip to $689, occupancy could drop to 21.8%, and ADRs may adjust down to $91.
- Understanding both the seasonal averages and these monthly peaks and troughs in revenue, occupancy, and ADR is crucial for maximizing your Airbnb profit potential in Rutten.
Seasonal Strategies for Maximizing Profit
- Peak Season: Maximize revenue through premium pricing and potentially longer minimum stays. Ensure high availability.
- Low Season: Offer competitive pricing, special promotions (e.g., extended stay discounts), and flexible cancellation policies. Target off-season travelers like remote workers or budget-conscious guests.
- Shoulder Seasons: Implement dynamic pricing that balances peak and low rates. Target weekend travelers or specific events. Offer slightly more flexible terms than peak season.
- Regularly analyze your own performance against these Rutten seasonality benchmarks and adjust your pricing and availability strategy accordingly.
Best Areas for Airbnb Investment in Rutten (2026)
Exploring the top neighborhoods for short-term rentals in Rutten? This section highlights key areas, outlining why they are attractive for hosts and guests, along with notable local attractions. Consider these locations based on your target guest profile and investment strategy.
| Neighborhood / Area | Why Host Here? (Target Guests & Appeal) | Key Attractions & Landmarks |
|---|---|---|
| Joure | A picturesque town with beautiful waterways, parks, and a rich history that attracts tourists seeking a peaceful getaway. | Museum Joure, De Fryske Marren, Waterplantsoen, Joure Waterland, Church of St. Vitus |
| Lelystad | The capital of Flevoland offers modern attractions and recreational activities, making it perfect for families and adventure seekers. | Batavia Stad Fashion Outlet, Aviodrome, Lelystad Marina, National Aviation Theme Park, Zeedijk |
| Dronten | Known for its festivals and events, Dronten is an emerging destination for travelers looking for cultural experiences and nature. | Sculpture Garden, De Pole, Old-Harbour Dronten, Dronten City Center, Museum de Burcht |
| Swifterbant | A quiet and scenic village that’s perfect for those wanting to enjoy nature and outdoor activities, near the IJsselmeer. | De Zwarte Meer, Nature Reserve Swifterbant, Local parks and biking trails, Swifterbant Museum, Historic farms |
| Bovenkarspel | A charming village that combines rich cultural heritage with close proximity to larger tourist attractions. | Bovenkarspel Station, Slochteren Castle, Local artisan shops, Historic windmills, Nature reserves |
| Urk | Once an island, this town offers stunning views and a rich maritime history, perfect for tourists looking for authenticity. | Fishing Museum Urk, Urk Lighthouse, Beaches of Urk, Local seafood restaurants, Cycling routes along the coast |
| Emmeloord | A modern town with a variety of amenities, making it suitable for business travelers and families alike. | Landmark 'De Doornkaat', Emmeloord City Center, Local markets, Surrounding nature reserves, Historical sites |
| Nagele | A unique village known for its architecture and quiet atmosphere, appealing to those seeking a retreat from city life. | Nagele's unique architecture, Local community events, Beautiful rural landscapes, Nearby cycling paths, Art installations |
Understanding Airbnb License Requirements & STR Laws in Rutten (2026)
While Rutten, Flevoland, Netherlands currently shows low STR regulations, specific Airbnb license requirements might still exist or change. Always verify the latest short term rental regulations and Airbnb license requirements directly with local government authorities for Rutten to ensure full compliance before hosting.
(Source: AirROI data, 2026, finding no licensed listings among those analyzed)
Top Performing Airbnb Properties in Rutten (2026)
Benchmark your potential! Explore examples of top-performing Airbnb properties in Ruttenbased on Trailing Twelve Month (TTM) revenue. Analyze their characteristics, revenue, occupancy rate, and ADR to understand what drives success in this market.
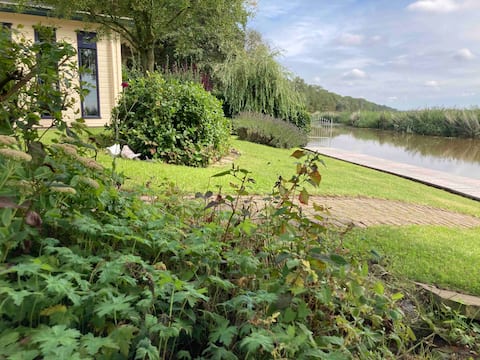
Lovely cottage on fishing water with unobstructed views
Entire Place • 2 bedrooms

Tiny House met privé hottub
Entire Place • 1 bedroom
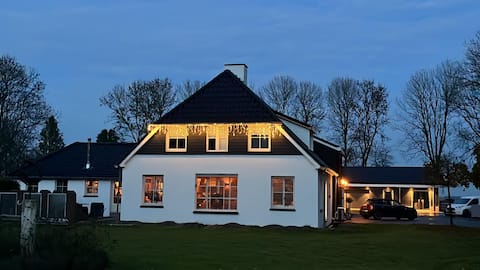
House near Lemmer am Teich
Entire Place • 2 bedrooms
B&B at Jet
Private Room • 1 bedroom

B&B Whanau, near Lemmer
Private Room • N/A
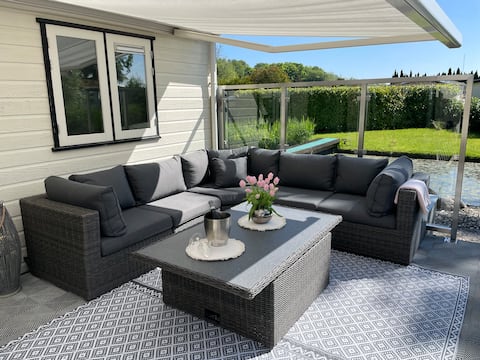
Holiday home with garden on the water near Lemmer
Entire Place • 2 bedrooms
Note: Performance varies based on location, size, amenities, seasonality, and management quality. Data reflects the past 12 months.
Top Performing Airbnb Hosts in Rutten (2026)
Learn from the best! This table showcases top-performing Airbnb hosts in Rutten based on the number of properties managed and estimated total revenue over the past year. Analyze their scale and performance metrics.
| Host Name | Properties | Grossing Revenue | Stay Reviews | Avg Rating |
|---|---|---|---|---|
| Marco | 13 | $128,722 | 540 | 4.93/5.0 |
| Irma | 1 | $30,868 | 105 | 4.88/5.0 |
| Angelika | 1 | $24,676 | 12 | 4.92/5.0 |
| Adriëtte Post-Simonse | 1 | $21,414 | 66 | 4.97/5.0 |
| Roeland | 1 | $16,165 | 26 | 4.81/5.0 |
| Christel | 1 | $12,406 | 13 | 4.92/5.0 |
| Herman | 1 | $11,196 | 24 | 4.58/5.0 |
Analyzing the strategies of top hosts, such as their property selection, pricing, and guest communication, can offer valuable lessons for optimizing your own Airbnb operations in Rutten.
Dive Deeper: Advanced Rutten STR Market Data (2026)
Ready to unlock more insights? AirROI provides access to advanced metrics and comprehensive Airbnb data for Rutten. Explore detailed analytics beyond this report to refine your investment strategy, optimize pricing, and maximize your vacation rental profits.
Explore Advanced MetricsRutten Short-Term Rental Market Composition (2026): Property & Room Types
Room Type Distribution
Property Type Distribution
Market Composition Insights for Rutten
- The Rutten Airbnb market composition is heavily skewed towards Entire Home/Apt listings, which make up 84.2% of the 19 active rentals. This indicates strong guest preference for privacy and space.
- Looking at the property type distribution in Rutten, Outdoor/Unique properties are the most common (57.9%), reflecting the local real estate landscape.
- Houses represent a significant 21.1% portion, catering likely to families or larger groups.
- The presence of 5.3% Hotel/Boutique listings indicates integration with traditional hospitality.
Rutten Airbnb Room Capacity Analysis (2026): Bedroom Distribution
Distribution of Listings by Number of Bedrooms
Room Capacity Insights for Rutten
- The dominant room capacity in Rutten is 1 bedroom listings, making up 73.7% of the market. This suggests a strong demand for properties suitable for couples or solo travelers.
- Together, 1 bedroom and 2 bedrooms properties represent 94.8% of the active Airbnb listings in Rutten, indicating a high concentration in these sizes.
- With over half the market (73.7%) consisting of studios or 1-bedroom units, Rutten is particularly well-suited for individuals or couples.
Rutten Vacation Rental Guest Capacity Trends (2026)
Distribution of Listings by Guest Capacity
Guest Capacity Insights for Rutten
- The most common guest capacity trend in Rutten vacation rentals is listings accommodating 3 guests (52.6%). This suggests the primary traveler segment is likely small families or groups.
- Properties designed for 3 guests and 4 guests dominate the Rutten STR market, accounting for 73.7% of listings.
- On average, properties in Rutten are equipped to host 2.8 guests.
Rutten Airbnb Booking Patterns (2026): Available vs. Booked Days
Available Days Distribution
Booked Days Distribution
Booking Pattern Insights for Rutten
- The most common availability pattern in Rutten falls within the 181-270 days range, representing 57.9% of listings. This suggests many properties have significant open periods on their calendars.
- Approximately 84.2% of listings show high availability (181+ days open annually), indicating potential for increased bookings or specific owner usage patterns.
- For booked days, the 91-180 days range is most frequent in Rutten (57.9%), reflecting common guest stay durations or potential owner blocking patterns.
- A notable 15.8% of properties secure long booking periods (181+ days booked per year), highlighting successful long-term rental strategies or significant owner usage.
Rutten Airbnb Minimum Stay Requirements Analysis
Distribution of Listings by Minimum Night Requirement
1 Night
8 listings
42.1% of total
2 Nights
1 listings
5.3% of total
3 Nights
2 listings
10.5% of total
4-6 Nights
1 listings
5.3% of total
30+ Nights
7 listings
36.8% of total
Key Insights
- The most prevalent minimum stay requirement in Rutten is 1 Night, adopted by 42.1% of listings. This highlights the market's preference for shorter, flexible bookings.
- A significant segment (36.8%) caters to monthly stays (30+ nights) in Rutten, pointing to opportunities in the extended-stay market.
Recommendations
- Align with the market by considering a 1 Night minimum stay, as 42.1% of Rutten hosts use this setting.
- Explore offering discounts for stays of 30+ nights to attract the 36.8% of the market seeking extended stays.
- Adjust minimum nights based on seasonality – potentially shorter during low season and longer during peak demand periods in Rutten.
Rutten Airbnb Cancellation Policy Trends Analysis (2026)
Limited
1 listings
5.3% of total
Flexible
2 listings
10.5% of total
Moderate
16 listings
84.2% of total
Cancellation Policy Insights for Rutten
- The prevailing Airbnb cancellation policy trend in Rutten is Moderate, used by 84.2% of listings.
- The market strongly favors guest-friendly terms, with 94.7% of listings offering Flexible or Moderate policies. This suggests guests in Rutten may expect booking flexibility.
Recommendations for Hosts
- Consider adopting a Moderate policy to align with the 84.2% market standard in Rutten.
- Regularly review your cancellation policy against competitors and market demand shifts in Rutten.
Rutten STR Booking Lead Time Analysis (2026)
Average Booking Lead Time by Month
Booking Lead Time Insights for Rutten
- The overall average booking lead time for vacation rentals in Rutten is 63 days.
- Guests book furthest in advance for stays during October (average 92 days), likely coinciding with peak travel demand or local events.
- The shortest booking windows occur for stays in January (average 10 days), indicating more last-minute travel plans during this time.
- Seasonally, Fall (76 days avg.) sees the longest lead times, while Winter (44 days avg.) has the shortest, reflecting typical travel planning cycles.
Recommendations for Hosts
- Use the overall average lead time (63 days) as a baseline for your pricing and availability strategy in Rutten.
- For October stays, consider implementing length-of-stay discounts or slightly higher rates for bookings made less than 92 days out to capitalize on advance planning.
- During January, focus on last-minute booking availability and promotions, as guests book with very short notice (10 days avg.).
- Target marketing efforts for the Fall season well in advance (at least 76 days) to capture early planners.
- Monitor your own booking lead times against these Rutten averages to identify opportunities for dynamic pricing adjustments.
Popular & Essential Airbnb Amenities in Rutten (2026)
Amenity Prevalence
Amenity Insights for Rutten
- Essential amenities in Rutten that guests expect include: Dishes and silverware, Hot water, Dining table, Coffee maker, Free parking on premises, Refrigerator, Wifi, Hair dryer. Lacking these (any) could significantly impact bookings.
- Popular amenities like Bed linens, Essentials are common but not universal. Offering these can provide a competitive edge.
Recommendations for Hosts
- Ensure your listing includes all essential amenities for Rutten: Dishes and silverware, Hot water, Dining table, Coffee maker, Free parking on premises, Refrigerator, Wifi, Hair dryer.
- Consider adding popular differentiators like Bed linens or Essentials to increase appeal.
- Highlight unique or less common amenities you offer (e.g., hot tub, dedicated workspace, EV charger) in your listing description and photos.
- Regularly check competitor amenities in Rutten to stay competitive.
Rutten Airbnb Guest Demographics & Profile Analysis (2026)
Guest Profile Summary for Rutten
- The typical guest profile for Airbnb in Rutten consists of a mix of domestic (36%) and international guests, with top international origins including Netherlands, typically belonging to the Post-2000s (Gen Z/Alpha) group (50%), primarily speaking English or German.
- Domestic travelers account for 35.9% of guests.
- Key international markets include Germany (49.5%) and Netherlands (35.9%).
- Top languages spoken are English (40.3%) followed by German (25%).
- A significant demographic segment is the Post-2000s (Gen Z/Alpha) group, representing 50% of guests.
Recommendations for Hosts
- Focus marketing internationally, particularly towards travelers from Netherlands.
- Tailor amenities and listing descriptions to appeal to the dominant Post-2000s (Gen Z/Alpha) demographic (e.g., highlight fast WiFi, smart home features, local guides).
- Highlight unique local experiences or amenities relevant to the primary guest profile.
- Consider seasonal promotions aligned with peak travel times for key origin markets.
Nearby Short-Term Rental Market Comparison
How does the Rutten Airbnb market stack up against its neighbors? Compare key performance metrics like average monthly revenue, ADR, and occupancy rates in surrounding areas to understand the broader regional STR landscape.
| Market | Active Properties | Monthly Revenue | Daily Rate | Avg. Occupancy |
|---|---|---|---|---|
| Raamsdonksveer | 16 | $7,996 | $736.98 | 40% |
| Haghorst | 11 | $6,275 | $467.13 | 43% |
| Merksplas | 12 | $5,977 | $357.51 | 44% |
| Kockengen | 12 | $5,925 | $461.19 | 50% |
| Baarlo | 20 | $5,655 | $329.43 | 53% |
| Bentveld | 15 | $4,954 | $510.66 | 50% |
| Wormer | 11 | $4,105 | $226.29 | 60% |
| Zwanenburg | 22 | $4,093 | $260.18 | 62% |
| Roelofarendsveen | 17 | $3,944 | $195.53 | 64% |
| Kortenhoef | 14 | $3,762 | $256.84 | 55% |