Arnhem Airbnb Market Analysis 2026: Short Term Rental Data & Vacation Rental Statistics in Gelderland, Netherlands
Is Airbnb profitable in Arnhem in 2026? Explore comprehensive Airbnb analytics for Arnhem, Gelderland, Netherlands to uncover income potential. This 2026 STR market report for Arnhem, based on AirROI data from February 2025 to January 2026, reveals key trends in the niche market of 159 active listings.
Whether you're considering an Airbnb investment in Arnhem, optimizing your existing vacation rental, or exploring rental arbitrage opportunities, understanding the Arnhem Airbnb data is crucial. Leveraging the low regulation environment is key to maximizing your short term rental income potential. Let's dive into the specifics.
Key Arnhem Airbnb Performance Metrics Overview
Monthly Airbnb Revenue Variations & Income Potential in Arnhem (2026)
Understanding the monthly revenue variations for Airbnb listings in Arnhem is key to maximizing your short term rental income potential. Seasonality significantly impacts earnings. Our analysis, based on data from the past 12 months, shows that the peak revenue month for STRs in Arnhem is typically July, while January often presents the lowest earnings, highlighting opportunities for strategic pricing adjustments during shoulder and low seasons. Explore the typical Airbnb income in Arnhem across different performance tiers:
- Best-in-class properties (Top 10%) achieve $3,856+ monthly, often utilizing dynamic pricing and superior guest experiences.
- Strong performing properties (Top 25%) earn $2,814 or more, indicating effective management and desirable locations/amenities.
- Typical properties (Median) generate around $1,837 per month, representing the average market performance.
- Entry-level properties (Bottom 25%) see earnings around $1,045, often with potential for optimization.
Average Monthly Airbnb Earnings Trend in Arnhem
Arnhem Airbnb Occupancy Rate Trends (2026)
Maximize your bookings by understanding the Arnhem STR occupancy trends. Seasonal demand shifts significantly influence how often properties are booked. Typically, Julysees the highest demand (peak season occupancy), while January experiences the lowest (low season). Effective strategies, like adjusting minimum stays or offering promotions, can boost occupancy during slower periods. Here's how different property tiers perform in Arnhem:
- Best-in-class properties (Top 10%) achieve 80%+ occupancy, indicating high desirability and potentially optimized availability.
- Strong performing properties (Top 25%) maintain 68% or higher occupancy, suggesting good market fit and guest satisfaction.
- Typical properties (Median) have an occupancy rate around 48%.
- Entry-level properties (Bottom 25%) average 27% occupancy, potentially facing higher vacancy.
Average Monthly Occupancy Rate Trend in Arnhem
Average Daily Rate (ADR) Airbnb Trends in Arnhem (2026)
Effective short term rental pricing strategy in Arnhem involves understanding monthly ADR fluctuations. The Average Daily Rate (ADR) for Airbnb in Arnhem typically peaks in October and dips lowest during March. Leveraging Airbnb dynamic pricing tools or strategies based on this seasonality can significantly boost revenue. Here's a look at the typical nightly rates achieved:
- Best-in-class properties (Top 10%) command rates of $253+ per night, often due to premium features or locations.
- Strong performing properties (Top 25%) achieve nightly rates of $196 or more.
- Typical properties (Median) charge around $136 per night.
- Entry-level properties (Bottom 25%) earn around $98 per night.
Average Daily Rate (ADR) Trend by Month in Arnhem
Get Live Arnhem Market Intelligence 👇

Explore Real-time Analytics
Airbnb Seasonality Analysis & Trends in Arnhem (2026)
Peak Season (July, August, October)
- Revenue averages $2,641 per month
- Occupancy rates average 56.0%
- Daily rates average $158
Shoulder Season
- Revenue averages $2,128 per month
- Occupancy maintains around 48.2%
- Daily rates hold near $153
Low Season (January, February, March)
- Revenue drops to average $1,407 per month
- Occupancy decreases to average 35.8%
- Daily rates adjust to average $149
Seasonality Insights for Arnhem
- The Airbnb seasonality in Arnhem shows highly seasonal trends requiring careful strategy. While the sections above show seasonal averages, it's also insightful to look at the extremes:
- During the high season, the absolute peak month showcases Arnhem's highest earning potential, with monthly revenues capable of climbing to $2,703, occupancy reaching a high of 57.7%, and ADRs peaking at $162.
- Conversely, the slowest single month of the year, typically falling within the low season, marks the market's lowest point. In this month, revenue might dip to $1,215, occupancy could drop to 25.0%, and ADRs may adjust down to $143.
- Understanding both the seasonal averages and these monthly peaks and troughs in revenue, occupancy, and ADR is crucial for maximizing your Airbnb profit potential in Arnhem.
Seasonal Strategies for Maximizing Profit
- Peak Season: Maximize revenue through premium pricing and potentially longer minimum stays. Ensure high availability.
- Low Season: Offer competitive pricing, special promotions (e.g., extended stay discounts), and flexible cancellation policies. Target off-season travelers like remote workers or budget-conscious guests.
- Shoulder Seasons: Implement dynamic pricing that balances peak and low rates. Target weekend travelers or specific events. Offer slightly more flexible terms than peak season.
- Regularly analyze your own performance against these Arnhem seasonality benchmarks and adjust your pricing and availability strategy accordingly.
Best Areas for Airbnb Investment in Arnhem (2026)
Exploring the top neighborhoods for short-term rentals in Arnhem? This section highlights key areas, outlining why they are attractive for hosts and guests, along with notable local attractions. Consider these locations based on your target guest profile and investment strategy.
| Neighborhood / Area | Why Host Here? (Target Guests & Appeal) | Key Attractions & Landmarks |
|---|---|---|
| City Center | The heart of Arnhem, offering a vibrant atmosphere with shops, restaurants, and cultural institutions. Ideal for tourists who want to explore the city on foot. | Museum Arnhem, Korenmarkt, Eusebius Church, Schouwburg Arnhem, Huis der Provincie Arnhem |
| Sonus Woonwijk | A peaceful residential area that appeals to families and long-term visitors. Close to nature and local amenities, providing a quieter alternative to the busy city center. | Berenkuil Park, Local parks, Elementary Schools |
| Klarendal | An up-and-coming neighborhood known for its creative vibe, local boutiques, and art scene. Attracts younger generations and artists looking for a community-oriented lifestyle. | Klarendal Market, Art spaces, Affine Gallery |
| Oosterbeek | A picturesque village adjacent to Arnhem, known for its scenic surroundings and historical significance. Great for guests who prefer a tranquil environment close to nature. | Airborne Museum, Oosterbeek Cemetery, Dudokpark |
| Getsewoud | A modern residential area that offers easy access to public transport and the city center. Ideal for short stays and business travelers. | Transport amenities, Local convenience stores |
| Arnhem-Noord | A peaceful district with green spaces and parks. Suitable for families and nature lovers who want a relaxing place to stay. | Sonsbeek Park, Historical Houses, Walking Trails |
| Velperpoort | A vibrant neighborhood close to the city center, known for its eclectic dining options and nightlife. Perfect for young adults and tourists seeking a lively experience. | Restaurants and cafes, Cultural venues, Shopping streets |
| Het Broek | A quieter residential area, popular with business travelers and those seeking a longer stay. Includes local amenities and parks for relaxation. | Local shops, Green spaces, Public transportation |
Understanding Airbnb License Requirements & STR Laws in Arnhem (2026)
While Arnhem, Gelderland, Netherlands currently shows low STR regulations, specific Airbnb license requirements might still exist or change. Always verify the latest short term rental regulations and Airbnb license requirements directly with local government authorities for Arnhem to ensure full compliance before hosting.
(Source: AirROI data, 2026, finding no licensed listings among those analyzed)
Top Performing Airbnb Properties in Arnhem (2026)
Benchmark your potential! Explore examples of top-performing Airbnb properties in Arnhembased on Trailing Twelve Month (TTM) revenue. Analyze their characteristics, revenue, occupancy rate, and ADR to understand what drives success in this market.
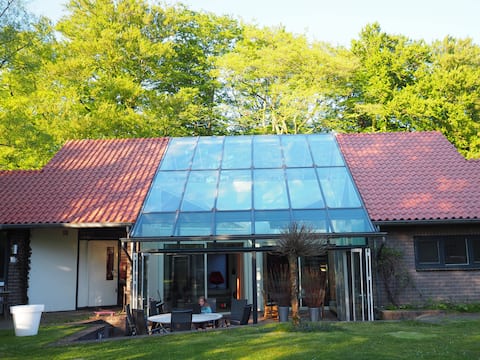
Villa Diepenbrock Arnhem
Entire Place • 5 bedrooms
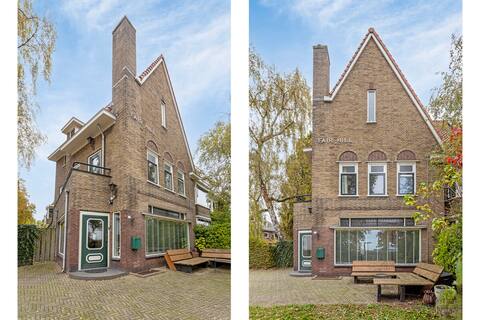
Cozy and bright 1930s house!
Entire Place • 3 bedrooms

New Entire Spacious Green Appartment
Entire Place • 3 bedrooms

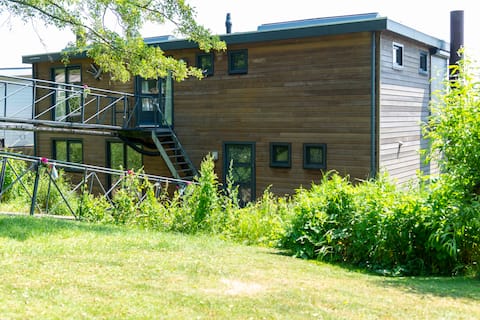
NEST outdoor residence
Entire Place • 1 bedroom
Woonboot Bailey
Entire Place • 2 bedrooms
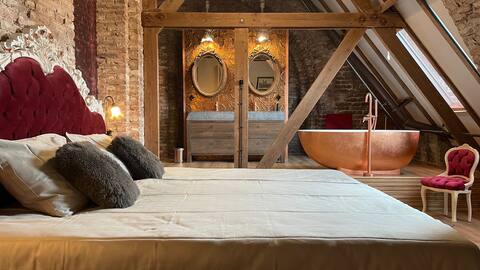
Royal Residence in Medieval Church Tower!
Private Room • 2 bedrooms
Note: Performance varies based on location, size, amenities, seasonality, and management quality. Data reflects the past 12 months.
Top Performing Airbnb Hosts in Arnhem (2026)
Learn from the best! This table showcases top-performing Airbnb hosts in Arnhem based on the number of properties managed and estimated total revenue over the past year. Analyze their scale and performance metrics.
| Host Name | Properties | Grossing Revenue | Stay Reviews | Avg Rating |
|---|---|---|---|---|
| Sonja | 6 | $184,362 | 247 | 4.83/5.0 |
| Daphne | 2 | $107,122 | 217 | 4.79/5.0 |
| Jacqueline | 1 | $86,474 | 235 | 4.76/5.0 |
| Asli | 3 | $77,910 | 84 | 4.91/5.0 |
| Dominique | 4 | $69,415 | 21 | 4.35/5.0 |
| Kasper | 1 | $66,632 | 6 | 5.00/5.0 |
| Edkor En Marco | 2 | $61,957 | 50 | 4.74/5.0 |
| Jaspar | 1 | $60,667 | 13 | 4.77/5.0 |
| Peter | 2 | $60,119 | 693 | 4.82/5.0 |
| Tessa | 1 | $59,946 | 117 | 4.94/5.0 |
Analyzing the strategies of top hosts, such as their property selection, pricing, and guest communication, can offer valuable lessons for optimizing your own Airbnb operations in Arnhem.
Dive Deeper: Advanced Arnhem STR Market Data (2026)
Ready to unlock more insights? AirROI provides access to advanced metrics and comprehensive Airbnb data for Arnhem. Explore detailed analytics beyond this report to refine your investment strategy, optimize pricing, and maximize your vacation rental profits.
Explore Advanced MetricsArnhem Short-Term Rental Market Composition (2026): Property & Room Types
Room Type Distribution
Property Type Distribution
Market Composition Insights for Arnhem
- The Arnhem Airbnb market composition is heavily skewed towards Entire Home/Apt listings, which make up 74.8% of the 159 active rentals. This indicates strong guest preference for privacy and space.
- Looking at the property type distribution in Arnhem, House properties are the most common (45.9%), reflecting the local real estate landscape.
- Houses represent a significant 45.9% portion, catering likely to families or larger groups.
- The presence of 8.2% Hotel/Boutique listings indicates integration with traditional hospitality.
- Smaller segments like others (combined 3.8%) offer potential for unique stay experiences.
Arnhem Airbnb Room Capacity Analysis (2026): Bedroom Distribution
Distribution of Listings by Number of Bedrooms
Room Capacity Insights for Arnhem
- The dominant room capacity in Arnhem is 1 bedroom listings, making up 44% of the market. This suggests a strong demand for properties suitable for couples or solo travelers.
- Together, 1 bedroom and 2 bedrooms properties represent 67.3% of the active Airbnb listings in Arnhem, indicating a high concentration in these sizes.
Arnhem Vacation Rental Guest Capacity Trends (2026)
Distribution of Listings by Guest Capacity
Guest Capacity Insights for Arnhem
- The most common guest capacity trend in Arnhem vacation rentals is listings accommodating 2 guests (36.5%). This suggests the primary traveler segment is likely couples or solo travelers.
- Properties designed for 2 guests and 4 guests dominate the Arnhem STR market, accounting for 62.9% of listings.
- On average, properties in Arnhem are equipped to host 2.9 guests.
Arnhem Airbnb Booking Patterns (2026): Available vs. Booked Days
Available Days Distribution
Booked Days Distribution
Booking Pattern Insights for Arnhem
- The most common availability pattern in Arnhem falls within the 271-366 days range, representing 34% of listings. This suggests many properties have significant open periods on their calendars.
- Approximately 64.8% of listings show high availability (181+ days open annually), indicating potential for increased bookings or specific owner usage patterns.
- For booked days, the 181-270 days range is most frequent in Arnhem (31.4%), reflecting common guest stay durations or potential owner blocking patterns.
- A notable 36.4% of properties secure long booking periods (181+ days booked per year), highlighting successful long-term rental strategies or significant owner usage.
Arnhem Airbnb Minimum Stay Requirements Analysis
Distribution of Listings by Minimum Night Requirement
1 Night
34 listings
21.4% of total
2 Nights
52 listings
32.7% of total
3 Nights
10 listings
6.3% of total
4-6 Nights
5 listings
3.1% of total
7-29 Nights
11 listings
6.9% of total
30+ Nights
47 listings
29.6% of total
Key Insights
- The most prevalent minimum stay requirement in Arnhem is 2 Nights, adopted by 32.7% of listings. This highlights the market's preference for shorter, flexible bookings.
- A significant segment (29.6%) caters to monthly stays (30+ nights) in Arnhem, pointing to opportunities in the extended-stay market.
Recommendations
- Align with the market by considering a 2 Nights minimum stay, as 32.7% of Arnhem hosts use this setting.
- If feasible, allowing 1-night stays, especially midweek or during low season, could capture last-minute bookings, as only 21.4% currently do.
- Explore offering discounts for stays of 30+ nights to attract the 29.6% of the market seeking extended stays.
- Adjust minimum nights based on seasonality – potentially shorter during low season and longer during peak demand periods in Arnhem.
Arnhem Airbnb Cancellation Policy Trends Analysis (2026)
Limited
9 listings
5.7% of total
Super Strict 60 Days
1 listings
0.6% of total
Flexible
42 listings
26.6% of total
Moderate
62 listings
39.2% of total
Firm
41 listings
25.9% of total
Strict
3 listings
1.9% of total
Cancellation Policy Insights for Arnhem
- The prevailing Airbnb cancellation policy trend in Arnhem is Moderate, used by 39.2% of listings.
- There's a relatively balanced mix between guest-friendly (65.8%) and stricter (27.8%) policies, offering choices for different guest needs.
- Strict cancellation policies are quite rare (1.9%), potentially making listings with this policy less competitive unless justified by high demand or property type.
Recommendations for Hosts
- Consider adopting a Moderate policy to align with the 39.2% market standard in Arnhem.
- Using a Strict policy might deter some guests, as only 1.9% of listings use it. Evaluate if potential revenue protection outweighs possible lower booking rates.
- Regularly review your cancellation policy against competitors and market demand shifts in Arnhem.
Arnhem STR Booking Lead Time Analysis (2026)
Average Booking Lead Time by Month
Booking Lead Time Insights for Arnhem
- The overall average booking lead time for vacation rentals in Arnhem is 59 days.
- Guests book furthest in advance for stays during June (average 77 days), likely coinciding with peak travel demand or local events.
- The shortest booking windows occur for stays in February (average 40 days), indicating more last-minute travel plans during this time.
- Seasonally, Summer (70 days avg.) sees the longest lead times, while Winter (44 days avg.) has the shortest, reflecting typical travel planning cycles.
Recommendations for Hosts
- Use the overall average lead time (59 days) as a baseline for your pricing and availability strategy in Arnhem.
- For June stays, consider implementing length-of-stay discounts or slightly higher rates for bookings made less than 77 days out to capitalize on advance planning.
- Target marketing efforts for the Summer season well in advance (at least 70 days) to capture early planners.
- Monitor your own booking lead times against these Arnhem averages to identify opportunities for dynamic pricing adjustments.
Popular & Essential Airbnb Amenities in Arnhem (2026)
Amenity Prevalence
Amenity Insights for Arnhem
- Essential amenities in Arnhem that guests expect include: Wifi. Lacking these (this) could significantly impact bookings.
- Popular amenities like Heating, Hot water, Smoke alarm are common but not universal. Offering these can provide a competitive edge.
Recommendations for Hosts
- Ensure your listing includes all essential amenities for Arnhem: Wifi.
- Prioritize adding missing essentials: Wifi.
- Consider adding popular differentiators like Heating or Hot water to increase appeal.
- Highlight unique or less common amenities you offer (e.g., hot tub, dedicated workspace, EV charger) in your listing description and photos.
- Regularly check competitor amenities in Arnhem to stay competitive.
Arnhem Airbnb Guest Demographics & Profile Analysis (2026)
Guest Profile Summary for Arnhem
- The typical guest profile for Airbnb in Arnhem consists of a mix of domestic (37%) and international guests, with top international origins including Germany, typically belonging to the Post-2000s (Gen Z/Alpha) group (50%), primarily speaking English or German.
- Domestic travelers account for 37.1% of guests.
- Key international markets include Netherlands (37.1%) and Germany (18.3%).
- Top languages spoken are English (39.4%) followed by German (15.9%).
- A significant demographic segment is the Post-2000s (Gen Z/Alpha) group, representing 50% of guests.
Recommendations for Hosts
- Focus marketing internationally, particularly towards travelers from Germany.
- Tailor amenities and listing descriptions to appeal to the dominant Post-2000s (Gen Z/Alpha) demographic (e.g., highlight fast WiFi, smart home features, local guides).
- Highlight unique local experiences or amenities relevant to the primary guest profile.
- Consider seasonal promotions aligned with peak travel times for key origin markets.
Nearby Short-Term Rental Market Comparison
How does the Arnhem Airbnb market stack up against its neighbors? Compare key performance metrics like average monthly revenue, ADR, and occupancy rates in surrounding areas to understand the broader regional STR landscape.
| Market | Active Properties | Monthly Revenue | Daily Rate | Avg. Occupancy |
|---|---|---|---|---|
| Losser | 10 | $7,954 | $1060.34 | 27% |
| Raamsdonksveer | 16 | $7,756 | $736.17 | 38% |
| Kockengen | 11 | $6,027 | $485.77 | 53% |
| Haghorst | 11 | $5,995 | $480.40 | 40% |
| Baarlo | 20 | $5,442 | $332.61 | 51% |
| Merksplas | 12 | $5,367 | $356.64 | 43% |
| Bentveld | 15 | $4,727 | $517.02 | 50% |
| Incourt | 13 | $4,412 | $303.48 | 52% |
| Wellin | 12 | $4,365 | $446.64 | 42% |
| Aubel | 26 | $4,191 | $283.88 | 46% |