Laren Airbnb Market Analysis 2025: Short Term Rental Data & Vacation Rental Statistics in Gelderland, Netherlands
Is Airbnb profitable in Laren in 2025? Explore comprehensive Airbnb analytics for Laren, Gelderland, Netherlands to uncover income potential. This 2025 STR market report for Laren, based on AirROI data from October 2024 to September 2025, reveals key trends in the niche market of 18 active listings.
Whether you're considering an Airbnb investment in Laren, optimizing your existing vacation rental, or exploring rental arbitrage opportunities, understanding the Laren Airbnb data is crucial. Leveraging the low regulation environment is key to maximizing your short term rental income potential. Let's dive into the specifics.
Key Laren Airbnb Performance Metrics Overview
Monthly Airbnb Revenue Variations & Income Potential in Laren (2025)
Understanding the monthly revenue variations for Airbnb listings in Laren is key to maximizing your short term rental income potential. Seasonality significantly impacts earnings. Our analysis, based on data from the past 12 months, shows that the peak revenue month for STRs in Laren is typically August, while November often presents the lowest earnings, highlighting opportunities for strategic pricing adjustments during shoulder and low seasons. Explore the typical Airbnb income in Laren across different performance tiers:
- Best-in-class properties (Top 10%) achieve $3,858+ monthly, often utilizing dynamic pricing and superior guest experiences.
- Strong performing properties (Top 25%) earn $2,640 or more, indicating effective management and desirable locations/amenities.
- Typical properties (Median) generate around $1,727 per month, representing the average market performance.
- Entry-level properties (Bottom 25%) see earnings around $837, often with potential for optimization.
Average Monthly Airbnb Earnings Trend in Laren
Laren Airbnb Occupancy Rate Trends (2025)
Maximize your bookings by understanding the Laren STR occupancy trends. Seasonal demand shifts significantly influence how often properties are booked. Typically, Augustsees the highest demand (peak season occupancy), while January experiences the lowest (low season). Effective strategies, like adjusting minimum stays or offering promotions, can boost occupancy during slower periods. Here's how different property tiers perform in Laren:
- Best-in-class properties (Top 10%) achieve 84%+ occupancy, indicating high desirability and potentially optimized availability.
- Strong performing properties (Top 25%) maintain 74% or higher occupancy, suggesting good market fit and guest satisfaction.
- Typical properties (Median) have an occupancy rate around 55%.
- Entry-level properties (Bottom 25%) average 30% occupancy, potentially facing higher vacancy.
Average Monthly Occupancy Rate Trend in Laren
Average Daily Rate (ADR) Airbnb Trends in Laren (2025)
Effective short term rental pricing strategy in Laren involves understanding monthly ADR fluctuations. The Average Daily Rate (ADR) for Airbnb in Laren typically peaks in September and dips lowest during February. Leveraging Airbnb dynamic pricing tools or strategies based on this seasonality can significantly boost revenue. Here's a look at the typical nightly rates achieved:
- Best-in-class properties (Top 10%) command rates of $205+ per night, often due to premium features or locations.
- Strong performing properties (Top 25%) achieve nightly rates of $126 or more.
- Typical properties (Median) charge around $107 per night.
- Entry-level properties (Bottom 25%) earn around $89 per night.
Average Daily Rate (ADR) Trend by Month in Laren
Get Live Laren Market Intelligence 👇
Explore Real-time Analytics
Airbnb Seasonality Analysis & Trends in Laren (2025)
Peak Season (August, July, April)
- Revenue averages $2,923 per month
- Occupancy rates average 67.3%
- Daily rates average $125
Shoulder Season
- Revenue averages $1,941 per month
- Occupancy maintains around 51.5%
- Daily rates hold near $120
Low Season (January, February, November)
- Revenue drops to average $1,295 per month
- Occupancy decreases to average 39.8%
- Daily rates adjust to average $113
Seasonality Insights for Laren
- The Airbnb seasonality in Laren shows highly seasonal trends requiring careful strategy. While the sections above show seasonal averages, it's also insightful to look at the extremes:
- During the high season, the absolute peak month showcases Laren's highest earning potential, with monthly revenues capable of climbing to $3,422, occupancy reaching a high of 72.6%, and ADRs peaking at $134.
- Conversely, the slowest single month of the year, typically falling within the low season, marks the market's lowest point. In this month, revenue might dip to $1,106, occupancy could drop to 34.3%, and ADRs may adjust down to $111.
- Understanding both the seasonal averages and these monthly peaks and troughs in revenue, occupancy, and ADR is crucial for maximizing your Airbnb profit potential in Laren.
Seasonal Strategies for Maximizing Profit
- Peak Season: Maximize revenue through premium pricing and potentially longer minimum stays. Ensure high availability.
- Low Season: Offer competitive pricing, special promotions (e.g., extended stay discounts), and flexible cancellation policies. Target off-season travelers like remote workers or budget-conscious guests.
- Shoulder Seasons: Implement dynamic pricing that balances peak and low rates. Target weekend travelers or specific events. Offer slightly more flexible terms than peak season.
- Regularly analyze your own performance against these Laren seasonality benchmarks and adjust your pricing and availability strategy accordingly.
Best Areas for Airbnb Investment in Laren (2025)
Exploring the top neighborhoods for short-term rentals in Laren? This section highlights key areas, outlining why they are attractive for hosts and guests, along with notable local attractions. Consider these locations based on your target guest profile and investment strategy.
| Neighborhood / Area | Why Host Here? (Target Guests & Appeal) | Key Attractions & Landmarks |
|---|---|---|
| Laren Village Center | Charming village atmosphere with high-end shops, cafes, and art galleries. Attractive for tourists seeking a quaint Dutch experience combined with local culture and cuisine. | Museum Coda, Singer Laren Museum, De Naald, Laren's Hoofdstraat, Local art galleries |
| Health Resort Area | Known for wellness and relaxation, this area attracts visitors looking for spa treatments and leisure activities. Ideal for a tranquil Airbnb stay. | Landgoed Zonnestraal, Spa facilities, Natural parks, Cycling routes, Walking trails |
| Nature Reserves around Laren | Surrounded by natural beauty, including forests and lakes. Perfect for nature lovers and those looking for outdoor activities, hiking, and cycling. | Laren Forest, Heuvelrug National Park, Local bike paths, Nature walks, Birdwatching spots |
| Historical Buildings Area | Hosts several historical buildings and monuments, attracting tourists interested in Dutch heritage and architecture. A cultural hotspot. | Old Town Hall, Historic Church of St. Vitus, Local heritage sites, Guided tours, Cultural events |
| Nearby Amsterdam | Although slightly outside Laren, the proximity to Amsterdam makes it easy for visitors to enjoy the urban offerings while having a quieter retreat in Laren. | Amsterdam city center, Museums like Rijksmuseum and Van Gogh Museum, Concerts and events in Amsterdam, Canal tours, Food markets |
| Art and Culture Scene | Laren has a thriving art scene with galleries and art events. Attracts art enthusiasts and visitors interested in local and international art. | Local artist studios, Art exhibitions, Community workshops, Cultural festivals, Art fairs |
| Outdoor Recreational Activities | Ideal for guests looking for active stays with options for sports and hobbies, including cycling, running and horseback riding. | Biking routes, Horse riding trails, Sports facilities, Local parks, Outdoor events |
| Culinary Scene | Laren features some excellent dining options ranging from quaint cafes to fine dining, making it attractive for food lovers and culinary tourism. | Local fine dining restaurants, Cafes and bistros, Cooking workshops, Food festivals, Wine tasting events |
Understanding Airbnb License Requirements & STR Laws in Laren (2025)
While Laren, Gelderland, Netherlands currently shows low STR regulations, specific Airbnb license requirements might still exist or change. Always verify the latest short term rental regulations and Airbnb license requirements directly with local government authorities for Laren to ensure full compliance before hosting.
(Source: AirROI data, 2025, finding no licensed listings among those analyzed)
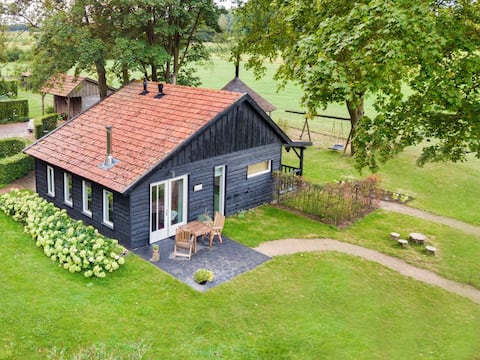
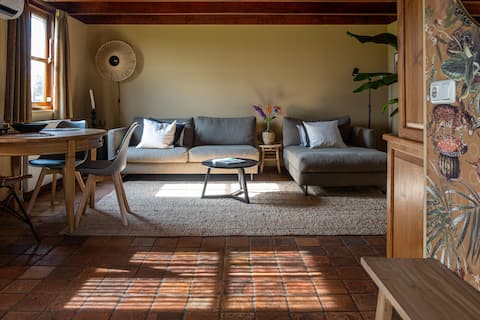
Top Performing Airbnb Properties in Laren (2025)
Benchmark your potential! Explore examples of top-performing Airbnb properties in Larenbased on Trailing Twelve Month (TTM) revenue. Analyze their characteristics, revenue, occupancy rate, and ADR to understand what drives success in this market.
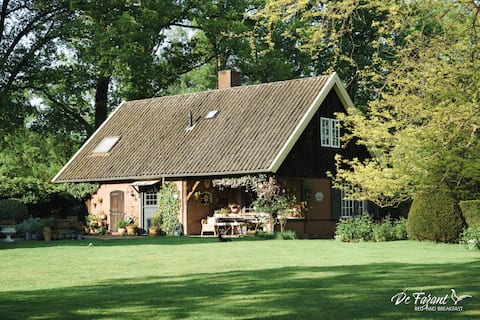
The Fazant is a detached house in nature.
Entire Place • 2 bedrooms

Luxurious stay at the forest with heated private pool!
Entire Place • 2 bedrooms

Enjoy Lush Nature, Sunny Garden, Cozy Farmhouse
Entire Place • 4 bedrooms

Detached cottage with lots of greenery, tranquility and privacy.
Entire Place • 1 bedroom
Flower house; where everything is correct!
Entire Place • 1 bedroom
Het Bakhuisje
Entire Place • 1 bedroom
Note: Performance varies based on location, size, amenities, seasonality, and management quality. Data reflects the past 12 months.
Top Performing Airbnb Hosts in Laren (2025)
Learn from the best! This table showcases top-performing Airbnb hosts in Laren based on the number of properties managed and estimated total revenue over the past year. Analyze their scale and performance metrics.
| Host Name | Properties | Grossing Revenue | Stay Reviews | Avg Rating |
|---|---|---|---|---|
| Annemiek | 2 | $48,085 | 83 | 4.95/5.0 |
| Lex | 1 | $43,670 | 52 | 4.94/5.0 |
| Mark & Judith | 1 | $42,452 | 96 | 4.99/5.0 |
| Mark | 1 | $38,263 | 2 | Not Rated |
| Theo | 1 | $31,562 | 220 | 4.93/5.0 |
| Coco | 1 | $29,178 | 94 | 4.93/5.0 |
| Lotte | 1 | $18,994 | 11 | 4.82/5.0 |
| Mathilde | 3 | $18,562 | 317 | 4.76/5.0 |
| Ana | 1 | $18,015 | 105 | 4.67/5.0 |
| Jordy | 1 | $10,544 | 34 | 4.71/5.0 |
Analyzing the strategies of top hosts, such as their property selection, pricing, and guest communication, can offer valuable lessons for optimizing your own Airbnb operations in Laren.
Dive Deeper: Advanced Laren STR Market Data (2025)
Ready to unlock more insights? AirROI provides access to advanced metrics and comprehensive Airbnb data for Laren. Explore detailed analytics beyond this report to refine your investment strategy, optimize pricing, and maximize your vacation rental profits.
Explore Advanced MetricsLaren Short-Term Rental Market Composition (2025): Property & Room Types
Room Type Distribution
Property Type Distribution
Market Composition Insights for Laren
- The Laren Airbnb market composition is heavily skewed towards Entire Home/Apt listings, which make up 94.4% of the 18 active rentals. This indicates strong guest preference for privacy and space.
- Looking at the property type distribution in Laren, Outdoor/Unique properties are the most common (38.9%), reflecting the local real estate landscape.
- Houses represent a significant 38.9% portion, catering likely to families or larger groups.
- The presence of 5.6% Hotel/Boutique listings indicates integration with traditional hospitality.
Laren Airbnb Room Capacity Analysis (2025): Bedroom Distribution
Distribution of Listings by Number of Bedrooms
Room Capacity Insights for Laren
- The dominant room capacity in Laren is 1 bedroom listings, making up 50% of the market. This suggests a strong demand for properties suitable for couples or solo travelers.
- Together, 1 bedroom and 2 bedrooms properties represent 83.3% of the active Airbnb listings in Laren, indicating a high concentration in these sizes.
Laren Vacation Rental Guest Capacity Trends (2025)
Distribution of Listings by Guest Capacity
Guest Capacity Insights for Laren
- The most common guest capacity trend in Laren vacation rentals is listings accommodating 2 guests (61.1%). This suggests the primary traveler segment is likely couples or solo travelers.
- Properties designed for 2 guests and 4 guests dominate the Laren STR market, accounting for 88.9% of listings.
- A significant 61.1% of listings cater specifically to 1-2 guests, highlighting strong demand from couples and solo travelers in Laren.
- On average, properties in Laren are equipped to host 3.1 guests.
Laren Airbnb Booking Patterns (2025): Available vs. Booked Days
Available Days Distribution
Booked Days Distribution
Booking Pattern Insights for Laren
- The most common availability pattern in Laren falls within the 181-270 days range, representing 33.3% of listings. This suggests many properties have significant open periods on their calendars.
- Approximately 66.6% of listings show high availability (181+ days open annually), indicating potential for increased bookings or specific owner usage patterns.
- For booked days, the 91-180 days range is most frequent in Laren (38.9%), reflecting common guest stay durations or potential owner blocking patterns.
- A notable 33.4% of properties secure long booking periods (181+ days booked per year), highlighting successful long-term rental strategies or significant owner usage.
Laren Airbnb Minimum Stay Requirements Analysis
Distribution of Listings by Minimum Night Requirement
1 Night
4 listings
22.2% of total
2 Nights
8 listings
44.4% of total
7-29 Nights
1 listings
5.6% of total
30+ Nights
5 listings
27.8% of total
Key Insights
- The most prevalent minimum stay requirement in Laren is 2 Nights, adopted by 44.4% of listings. This highlights the market's preference for shorter, flexible bookings.
- A strong majority (66.6%) of the Laren Airbnb data shows acceptance of very short stays (1-2 nights), indicating a dynamic, high-turnover market.
- A significant segment (27.8%) caters to monthly stays (30+ nights) in Laren, pointing to opportunities in the extended-stay market.
Recommendations
- Align with the market by considering a 2 Nights minimum stay, as 44.4% of Laren hosts use this setting.
- If feasible, allowing 1-night stays, especially midweek or during low season, could capture last-minute bookings, as only 22.2% currently do.
- Explore offering discounts for stays of 30+ nights to attract the 27.8% of the market seeking extended stays.
- Adjust minimum nights based on seasonality – potentially shorter during low season and longer during peak demand periods in Laren.
Laren Airbnb Cancellation Policy Trends Analysis (2025)
Flexible
3 listings
16.7% of total
Moderate
11 listings
61.1% of total
Firm
4 listings
22.2% of total
Cancellation Policy Insights for Laren
- The prevailing Airbnb cancellation policy trend in Laren is Moderate, used by 61.1% of listings.
- The market strongly favors guest-friendly terms, with 77.8% of listings offering Flexible or Moderate policies. This suggests guests in Laren may expect booking flexibility.
Recommendations for Hosts
- Consider adopting a Moderate policy to align with the 61.1% market standard in Laren.
- Regularly review your cancellation policy against competitors and market demand shifts in Laren.
Laren STR Booking Lead Time Analysis (2025)
Average Booking Lead Time by Month
Booking Lead Time Insights for Laren
- The overall average booking lead time for vacation rentals in Laren is 73 days.
- Guests book furthest in advance for stays during March (average 117 days), likely coinciding with peak travel demand or local events.
- The shortest booking windows occur for stays in November (average 30 days), indicating more last-minute travel plans during this time.
- Seasonally, Summer (92 days avg.) sees the longest lead times, while Fall (52 days avg.) has the shortest, reflecting typical travel planning cycles.
Recommendations for Hosts
- Use the overall average lead time (73 days) as a baseline for your pricing and availability strategy in Laren.
- For March stays, consider implementing length-of-stay discounts or slightly higher rates for bookings made less than 117 days out to capitalize on advance planning.
- Target marketing efforts for the Summer season well in advance (at least 92 days) to capture early planners.
- Monitor your own booking lead times against these Laren averages to identify opportunities for dynamic pricing adjustments.
Popular & Essential Airbnb Amenities in Laren (2025)
Amenity Prevalence
Amenity Insights for Laren
- Essential amenities in Laren that guests expect include: Wifi, Free parking on premises, Wine glasses, Dishes and silverware, Bed linens. Lacking these (any) could significantly impact bookings.
- Popular amenities like Clothing storage, Cooking basics, Dining table are common but not universal. Offering these can provide a competitive edge.
Recommendations for Hosts
- Ensure your listing includes all essential amenities for Laren: Wifi, Free parking on premises, Wine glasses, Dishes and silverware, Bed linens.
- Consider adding popular differentiators like Clothing storage or Cooking basics to increase appeal.
- Highlight unique or less common amenities you offer (e.g., hot tub, dedicated workspace, EV charger) in your listing description and photos.
- Regularly check competitor amenities in Laren to stay competitive.
Laren Airbnb Guest Demographics & Profile Analysis (2025)
Guest Profile Summary for Laren
- The typical guest profile for Airbnb in Laren consists of primarily domestic travelers (76%), often arriving from nearby Amsterdam, typically belonging to the Post-2000s (Gen Z/Alpha) group (50%), primarily speaking English or Dutch.
- Domestic travelers account for 75.5% of guests.
- Key international markets include Netherlands (75.5%) and Germany (15.1%).
- Top languages spoken are English (38%) followed by Dutch (31.8%).
- A significant demographic segment is the Post-2000s (Gen Z/Alpha) group, representing 50% of guests.
Recommendations for Hosts
- Target domestic marketing efforts towards travelers from Amsterdam and Utrecht.
- Tailor amenities and listing descriptions to appeal to the dominant Post-2000s (Gen Z/Alpha) demographic (e.g., highlight fast WiFi, smart home features, local guides).
- Highlight unique local experiences or amenities relevant to the primary guest profile.
- Consider seasonal promotions aligned with peak travel times for key origin markets.
Nearby Short-Term Rental Market Comparison
How does the Laren Airbnb market stack up against its neighbors? Compare key performance metrics like average monthly revenue, ADR, and occupancy rates in surrounding areas to understand the broader regional STR landscape.
| Market | Active Properties | Monthly Revenue | Daily Rate | Avg. Occupancy |
|---|---|---|---|---|
| Haghorst | 11 | $5,911 | $466.79 | 41% |
| Baarlo | 20 | $5,228 | $316.63 | 51% |
| Kortenhoef | 14 | $3,711 | $261.37 | 55% |
| Kerkdriel | 19 | $3,612 | $355.66 | 42% |
| Zeewolde | 162 | $3,379 | $344.26 | 36% |
| Rijs | 26 | $3,366 | $390.66 | 42% |
| Peer | 22 | $3,243 | $361.21 | 35% |
| Muiden | 32 | $3,182 | $309.70 | 48% |
| Bant | 11 | $3,041 | $497.22 | 23% |
| Heusden-Zolder | 14 | $2,941 | $332.82 | 35% |