Olburgen Airbnb Market Analysis 2025: Short Term Rental Data & Vacation Rental Statistics in Gelderland, Netherlands
Is Airbnb profitable in Olburgen in 2025? Explore comprehensive Airbnb analytics for Olburgen, Gelderland, Netherlands to uncover income potential. This 2025 STR market report for Olburgen, based on AirROI data from July 2024 to June 2025, reveals key trends in the niche market of 18 active listings.
Whether you're considering an Airbnb investment in Olburgen, optimizing your existing vacation rental, or exploring rental arbitrage opportunities, understanding the Olburgen Airbnb data is crucial. Leveraging the low regulation environment is key to maximizing your short term rental income potential. Let's dive into the specifics.
Key Olburgen Airbnb Performance Metrics Overview
Monthly Airbnb Revenue Variations & Income Potential in Olburgen (2025)
Understanding the monthly revenue variations for Airbnb listings in Olburgen is key to maximizing your short term rental income potential. Seasonality significantly impacts earnings. Our analysis, based on data from the past 12 months, shows that the peak revenue month for STRs in Olburgen is typically August, while January often presents the lowest earnings, highlighting opportunities for strategic pricing adjustments during shoulder and low seasons. Explore the typical Airbnb income in Olburgen across different performance tiers:
- Best-in-class properties (Top 10%) achieve $2,355+ monthly, often utilizing dynamic pricing and superior guest experiences.
- Strong performing properties (Top 25%) earn $1,713 or more, indicating effective management and desirable locations/amenities.
- Typical properties (Median) generate around $1,108 per month, representing the average market performance.
- Entry-level properties (Bottom 25%) see earnings around $628, often with potential for optimization.
Average Monthly Airbnb Earnings Trend in Olburgen
Olburgen Airbnb Occupancy Rate Trends (2025)
Maximize your bookings by understanding the Olburgen STR occupancy trends. Seasonal demand shifts significantly influence how often properties are booked. Typically, Aprilsees the highest demand (peak season occupancy), while January experiences the lowest (low season). Effective strategies, like adjusting minimum stays or offering promotions, can boost occupancy during slower periods. Here's how different property tiers perform in Olburgen:
- Best-in-class properties (Top 10%) achieve 52%+ occupancy, indicating high desirability and potentially optimized availability.
- Strong performing properties (Top 25%) maintain 36% or higher occupancy, suggesting good market fit and guest satisfaction.
- Typical properties (Median) have an occupancy rate around 21%.
- Entry-level properties (Bottom 25%) average 12% occupancy, potentially facing higher vacancy.
Average Monthly Occupancy Rate Trend in Olburgen
Average Daily Rate (ADR) Airbnb Trends in Olburgen (2025)
Effective short term rental pricing strategy in Olburgen involves understanding monthly ADR fluctuations. The Average Daily Rate (ADR) for Airbnb in Olburgen typically peaks in August and dips lowest during November. Leveraging Airbnb dynamic pricing tools or strategies based on this seasonality can significantly boost revenue. Here's a look at the typical nightly rates achieved:
- Best-in-class properties (Top 10%) command rates of $310+ per night, often due to premium features or locations.
- Strong performing properties (Top 25%) achieve nightly rates of $232 or more.
- Typical properties (Median) charge around $160 per night.
- Entry-level properties (Bottom 25%) earn around $134 per night.
Average Daily Rate (ADR) Trend by Month in Olburgen
Get Live Olburgen Market Intelligence 👇

Explore Real-time Analytics
Airbnb Seasonality Analysis & Trends in Olburgen (2025)
Peak Season (August, July, April)
- Revenue averages $1,982 per month
- Occupancy rates average 36.3%
- Daily rates average $205
Shoulder Season
- Revenue averages $1,282 per month
- Occupancy maintains around 26.7%
- Daily rates hold near $192
Low Season (January, February, November)
- Revenue drops to average $640 per month
- Occupancy decreases to average 14.1%
- Daily rates adjust to average $183
Seasonality Insights for Olburgen
- The Airbnb seasonality in Olburgen shows highly seasonal trends requiring careful strategy. While the sections above show seasonal averages, it's also insightful to look at the extremes:
- During the high season, the absolute peak month showcases Olburgen's highest earning potential, with monthly revenues capable of climbing to $2,450, occupancy reaching a high of 38.7%, and ADRs peaking at $226.
- Conversely, the slowest single month of the year, typically falling within the low season, marks the market's lowest point. In this month, revenue might dip to $607, occupancy could drop to 12.4%, and ADRs may adjust down to $174.
- Understanding both the seasonal averages and these monthly peaks and troughs in revenue, occupancy, and ADR is crucial for maximizing your Airbnb profit potential in Olburgen.
Seasonal Strategies for Maximizing Profit
- Peak Season: Maximize revenue through premium pricing and potentially longer minimum stays. Ensure high availability.
- Low Season: Offer competitive pricing, special promotions (e.g., extended stay discounts), and flexible cancellation policies. Target off-season travelers like remote workers or budget-conscious guests.
- Shoulder Seasons: Implement dynamic pricing that balances peak and low rates. Target weekend travelers or specific events. Offer slightly more flexible terms than peak season.
- Regularly analyze your own performance against these Olburgen seasonality benchmarks and adjust your pricing and availability strategy accordingly.
Best Areas for Airbnb Investment in Olburgen (2025)
Exploring the top neighborhoods for short-term rentals in Olburgen? This section highlights key areas, outlining why they are attractive for hosts and guests, along with notable local attractions. Consider these locations based on your target guest profile and investment strategy.
| Neighborhood / Area | Why Host Here? (Target Guests & Appeal) | Key Attractions & Landmarks |
|---|---|---|
| Zutphen | Historic city known for its medieval architecture and beautiful canals. A great destination for tourists looking for a blend of history and culture. | Zutphen City Center, Berkel River, Museum Henriette Polak, St. Walburgis Church, De Hanzehof |
| Deventer | A picturesque city with a vibrant cultural scene, attracting visitors to its old town and annual events. | Deventer City Center, Flierderweide Park, Historical Museum Deventer, Lebuinuskerk, Deventer Book Market |
| Bronkhorst | The smallest town in the Netherlands, known for its charming streets and historical significance. Perfect for those seeking a quaint and peaceful getaway. | Bronkhorst Town Center, The Old Town Hall, Bronkhorst Windmill, River IJssel |
| Lochem | A lovely town surrounded by nature, suitable for nature lovers and those who enjoy outdoor activities. | Lochemse Berg, Lochem City Park, Sint Vitus Church, Castles and estates in the area |
| Emst | A quiet village renowned for its inviting atmosphere and accessibility to nearby woodland areas. | Hiking Trails, Local Farms, Scenic Nature Parks |
| Gorssel | Known for its art scene and proximity to the IJssel River, offering a blend of cultural experiences and outdoor activities. | Museum MORE, Gorssel City Center, IJssel River Walks |
| Almen | A small village that provides a peaceful retreat with picturesque views and traditional Dutch charm. | Almen City Center, Local Historical Sites, Nature Trails |
| Olburgen | A charming village located along the river, ideal for guests looking for tranquility and natural beauty while being close to larger cities. | River Walks along the IJssel, Nature Reserves, Local Farms |
Understanding Airbnb License Requirements & STR Laws in Olburgen (2025)
While Olburgen, Gelderland, Netherlands currently shows low STR regulations, specific Airbnb license requirements might still exist or change. Always verify the latest short term rental regulations and Airbnb license requirements directly with local government authorities for Olburgen to ensure full compliance before hosting.
(Source: AirROI data, 2025, finding no licensed listings among those analyzed)
Top Performing Airbnb Properties in Olburgen (2025)
Benchmark your potential! Explore examples of top-performing Airbnb properties in Olburgenbased on Trailing Twelve Month (TTM) revenue. Analyze their characteristics, revenue, occupancy rate, and ADR to understand what drives success in this market.
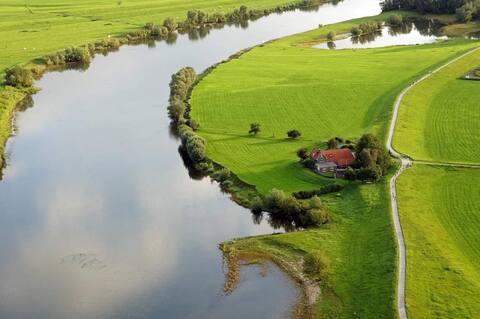
Riverside vacation home: Het Pipeluurtje
Entire Place • 2 bedrooms

Tiny House, great enjoyment.
Entire Place • 3 bedrooms
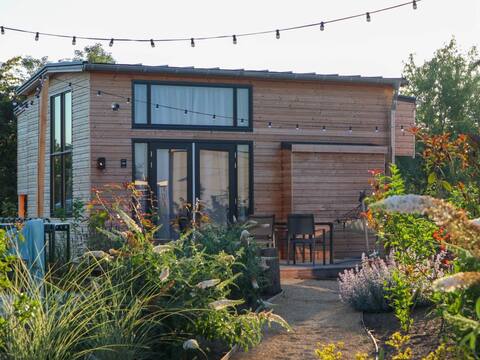
Tiny house with wellness and sports facilities
Entire Place • 2 bedrooms

The Reed - Luxury Waterfront Chalet
Entire Place • 2 bedrooms

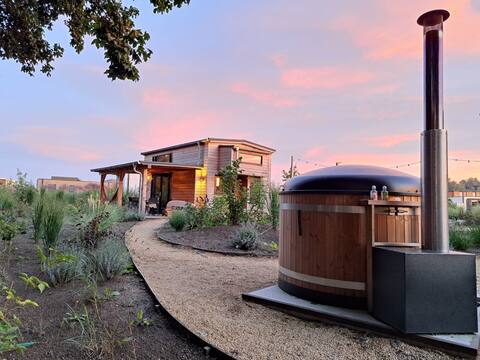
Tiny house with cozy pellet stove and hot tub.
Entire Place • 1 bedroom
Nice tiny house with pellet stove in holiday park
Entire Place • N/A
Note: Performance varies based on location, size, amenities, seasonality, and management quality. Data reflects the past 12 months.
Top Performing Airbnb Hosts in Olburgen (2025)
Learn from the best! This table showcases top-performing Airbnb hosts in Olburgen based on the number of properties managed and estimated total revenue over the past year. Analyze their scale and performance metrics.
| Host Name | Properties | Grossing Revenue | Stay Reviews | Avg Rating |
|---|---|---|---|---|
| Anneliese | 1 | $30,681 | 9 | 4.89/5.0 |
| Diana - BELVILLA | 4 | $28,033 | 9 | 3.80/5.0 |
| Alice En Wijgert | 1 | $23,086 | 68 | 4.50/5.0 |
| Lucinda | 1 | $22,740 | 47 | 4.66/5.0 |
| Michael | 1 | $18,441 | 81 | 4.81/5.0 |
| Janet | 1 | $14,155 | 30 | 4.70/5.0 |
| Athanasia | 1 | $12,829 | 24 | 4.46/5.0 |
| Marijn En Marissa | 1 | $12,443 | 14 | 4.64/5.0 |
| Maureen | 1 | $10,799 | 12 | 5.00/5.0 |
| Erwin | 1 | $10,229 | 7 | 4.57/5.0 |
Analyzing the strategies of top hosts, such as their property selection, pricing, and guest communication, can offer valuable lessons for optimizing your own Airbnb operations in Olburgen.
Dive Deeper: Advanced Olburgen STR Market Data (2025)
Ready to unlock more insights? AirROI provides access to advanced metrics and comprehensive Airbnb data for Olburgen. Explore detailed analytics beyond this report to refine your investment strategy, optimize pricing, and maximize your vacation rental profits.
Explore Advanced MetricsOlburgen Short-Term Rental Market Composition (2025): Property & Room Types
Room Type Distribution
Property Type Distribution
Market Composition Insights for Olburgen
- The Olburgen Airbnb market composition is heavily skewed towards Entire Home/Apt listings, which make up 100% of the 18 active rentals. This indicates strong guest preference for privacy and space.
- Looking at the property type distribution in Olburgen, House properties are the most common (94.4%), reflecting the local real estate landscape.
- Houses represent a significant 94.4% portion, catering likely to families or larger groups.
Olburgen Airbnb Room Capacity Analysis (2025): Bedroom Distribution
Distribution of Listings by Number of Bedrooms
Room Capacity Insights for Olburgen
- The dominant room capacity in Olburgen is 2 bedrooms listings, making up 66.7% of the market. This suggests a strong demand for properties suitable for couples or solo travelers.
- Together, 2 bedrooms and 1 bedroom properties represent 88.9% of the active Airbnb listings in Olburgen, indicating a high concentration in these sizes.
- Listings with 3+ bedrooms (5.6%) represent a smaller niche, potentially indicating an underserved market for larger group accommodations in Olburgen.
Olburgen Vacation Rental Guest Capacity Trends (2025)
Distribution of Listings by Guest Capacity
Guest Capacity Insights for Olburgen
- The most common guest capacity trend in Olburgen vacation rentals is listings accommodating 4 guests (77.8%). This suggests the primary traveler segment is likely small families or groups.
- Properties designed for 4 guests and 2 guests dominate the Olburgen STR market, accounting for 100.0% of listings.
- On average, properties in Olburgen are equipped to host 3.6 guests.
Olburgen Airbnb Booking Patterns (2025): Available vs. Booked Days
Available Days Distribution
Booked Days Distribution
Booking Pattern Insights for Olburgen
- The most common availability pattern in Olburgen falls within the 271-366 days range, representing 61.1% of listings. This suggests many properties have significant open periods on their calendars.
- Approximately 94.4% of listings show high availability (181+ days open annually), indicating potential for increased bookings or specific owner usage patterns.
- For booked days, the 1-30 days range is most frequent in Olburgen (38.9%), reflecting common guest stay durations or potential owner blocking patterns.
- A notable 5.6% of properties secure long booking periods (181+ days booked per year), highlighting successful long-term rental strategies or significant owner usage.
Olburgen Airbnb Minimum Stay Requirements Analysis
Distribution of Listings by Minimum Night Requirement
1 Night
1 listings
7.1% of total
2 Nights
10 listings
71.4% of total
3 Nights
1 listings
7.1% of total
7-29 Nights
1 listings
7.1% of total
30+ Nights
1 listings
7.1% of total
Key Insights
- The most prevalent minimum stay requirement in Olburgen is 2 Nights, adopted by 71.4% of listings. This highlights the market's preference for shorter, flexible bookings.
- A strong majority (78.5%) of the Olburgen Airbnb data shows acceptance of very short stays (1-2 nights), indicating a dynamic, high-turnover market.
Recommendations
- Align with the market by considering a 2 Nights minimum stay, as 71.4% of Olburgen hosts use this setting.
- If feasible, allowing 1-night stays, especially midweek or during low season, could capture last-minute bookings, as only 7.1% currently do.
- A 2-night minimum appears standard (71.4%). Consider this for weekends or peak periods.
- Explore offering discounts for stays of 30+ nights to attract the 7.1% of the market seeking extended stays.
- Adjust minimum nights based on seasonality – potentially shorter during low season and longer during peak demand periods in Olburgen.
Olburgen Airbnb Cancellation Policy Trends Analysis (2025)
Limited
2 listings
14.3% of total
Flexible
3 listings
21.4% of total
Moderate
2 listings
14.3% of total
Firm
6 listings
42.9% of total
Strict
1 listings
7.1% of total
Cancellation Policy Insights for Olburgen
- The prevailing Airbnb cancellation policy trend in Olburgen is Firm, used by 42.9% of listings.
- There's a relatively balanced mix between guest-friendly (35.7%) and stricter (50.0%) policies, offering choices for different guest needs.
- Strict cancellation policies are quite rare (7.1%), potentially making listings with this policy less competitive unless justified by high demand or property type.
Recommendations for Hosts
- Consider adopting a Firm policy to align with the 42.9% market standard in Olburgen.
- Using a Strict policy might deter some guests, as only 7.1% of listings use it. Evaluate if potential revenue protection outweighs possible lower booking rates.
- Regularly review your cancellation policy against competitors and market demand shifts in Olburgen.
Olburgen STR Booking Lead Time Analysis (2025)
Average Booking Lead Time by Month
Booking Lead Time Insights for Olburgen
- The overall average booking lead time for vacation rentals in Olburgen is 44 days.
- Guests book furthest in advance for stays during January (average 103 days), likely coinciding with peak travel demand or local events.
- The shortest booking windows occur for stays in February (average 12 days), indicating more last-minute travel plans during this time.
- Seasonally, Fall (71 days avg.) sees the longest lead times, while Spring (39 days avg.) has the shortest, reflecting typical travel planning cycles.
Recommendations for Hosts
- Use the overall average lead time (44 days) as a baseline for your pricing and availability strategy in Olburgen.
- For January stays, consider implementing length-of-stay discounts or slightly higher rates for bookings made less than 103 days out to capitalize on advance planning.
- During February, focus on last-minute booking availability and promotions, as guests book with very short notice (12 days avg.).
- Target marketing efforts for the Fall season well in advance (at least 71 days) to capture early planners.
- Monitor your own booking lead times against these Olburgen averages to identify opportunities for dynamic pricing adjustments.
Popular & Essential Airbnb Amenities in Olburgen (2025)
Amenity data is currently unavailable for Olburgen.
Olburgen Airbnb Guest Demographics & Profile Analysis (2025)
Guest Profile Summary for Olburgen
- The typical guest profile for Airbnb in Olburgen consists of predominantly international visitors (65%), with top international origins including Netherlands, typically belonging to the Post-2000s (Gen Z/Alpha) group (50%), primarily speaking English or German.
- Domestic travelers account for 34.7% of guests.
- Key international markets include Germany (49%) and Netherlands (34.7%).
- Top languages spoken are English (44.1%) followed by German (29.4%).
- A significant demographic segment is the Post-2000s (Gen Z/Alpha) group, representing 50% of guests.
Recommendations for Hosts
- Focus marketing internationally, particularly towards travelers from Netherlands.
- Tailor amenities and listing descriptions to appeal to the dominant Post-2000s (Gen Z/Alpha) demographic (e.g., highlight fast WiFi, smart home features, local guides).
- Highlight unique local experiences or amenities relevant to the primary guest profile.
- Consider seasonal promotions aligned with peak travel times for key origin markets.
Nearby Short-Term Rental Market Comparison
How does the Olburgen Airbnb market stack up against its neighbors? Compare key performance metrics like average monthly revenue, ADR, and occupancy rates in surrounding areas to understand the broader regional STR landscape.
| Market | Active Properties | Monthly Revenue | Daily Rate | Avg. Occupancy |
|---|---|---|---|---|
| Haghorst | 11 | $5,201 | $456.91 | 39% |
| Baarlo | 21 | $5,167 | $315.28 | 57% |
| Rijs | 28 | $3,372 | $364.94 | 45% |
| Kortenhoef | 15 | $3,370 | $253.22 | 54% |
| Peer | 21 | $3,359 | $360.49 | 37% |
| Kerkdriel | 26 | $3,066 | $331.74 | 37% |
| Haaren | 13 | $3,034 | $261.89 | 46% |
| Zeewolde | 171 | $2,957 | $337.16 | 35% |
| Vierhouten | 15 | $2,888 | $202.35 | 50% |
| Kollumerpomp | 11 | $2,887 | $320.14 | 30% |