Voorthuizen Airbnb Market Analysis 2026: Short Term Rental Data & Vacation Rental Statistics in Gelderland, Netherlands
Is Airbnb profitable in Voorthuizen in 2026? Explore comprehensive Airbnb analytics for Voorthuizen, Gelderland, Netherlands to uncover income potential. This 2026 STR market report for Voorthuizen, based on AirROI data from February 2025 to January 2026, reveals key trends in the niche market of 165 active listings.
Whether you're considering an Airbnb investment in Voorthuizen, optimizing your existing vacation rental, or exploring rental arbitrage opportunities, understanding the Voorthuizen Airbnb data is crucial. Leveraging the low regulation environment is key to maximizing your short term rental income potential. Let's dive into the specifics.
Key Voorthuizen Airbnb Performance Metrics Overview
Monthly Airbnb Revenue Variations & Income Potential in Voorthuizen (2026)
Understanding the monthly revenue variations for Airbnb listings in Voorthuizen is key to maximizing your short term rental income potential. Seasonality significantly impacts earnings. Our analysis, based on data from the past 12 months, shows that the peak revenue month for STRs in Voorthuizen is typically August, while February often presents the lowest earnings, highlighting opportunities for strategic pricing adjustments during shoulder and low seasons. Explore the typical Airbnb income in Voorthuizen across different performance tiers:
- Best-in-class properties (Top 10%) achieve $5,007+ monthly, often utilizing dynamic pricing and superior guest experiences.
- Strong performing properties (Top 25%) earn $3,242 or more, indicating effective management and desirable locations/amenities.
- Typical properties (Median) generate around $2,072 per month, representing the average market performance.
- Entry-level properties (Bottom 25%) see earnings around $1,087, often with potential for optimization.
Average Monthly Airbnb Earnings Trend in Voorthuizen
Voorthuizen Airbnb Occupancy Rate Trends (2026)
Maximize your bookings by understanding the Voorthuizen STR occupancy trends. Seasonal demand shifts significantly influence how often properties are booked. Typically, Augustsees the highest demand (peak season occupancy), while January experiences the lowest (low season). Effective strategies, like adjusting minimum stays or offering promotions, can boost occupancy during slower periods. Here's how different property tiers perform in Voorthuizen:
- Best-in-class properties (Top 10%) achieve 77%+ occupancy, indicating high desirability and potentially optimized availability.
- Strong performing properties (Top 25%) maintain 61% or higher occupancy, suggesting good market fit and guest satisfaction.
- Typical properties (Median) have an occupancy rate around 38%.
- Entry-level properties (Bottom 25%) average 17% occupancy, potentially facing higher vacancy.
Average Monthly Occupancy Rate Trend in Voorthuizen
Average Daily Rate (ADR) Airbnb Trends in Voorthuizen (2026)
Effective short term rental pricing strategy in Voorthuizen involves understanding monthly ADR fluctuations. The Average Daily Rate (ADR) for Airbnb in Voorthuizen typically peaks in December and dips lowest during March. Leveraging Airbnb dynamic pricing tools or strategies based on this seasonality can significantly boost revenue. Here's a look at the typical nightly rates achieved:
- Best-in-class properties (Top 10%) command rates of $420+ per night, often due to premium features or locations.
- Strong performing properties (Top 25%) achieve nightly rates of $268 or more.
- Typical properties (Median) charge around $161 per night.
- Entry-level properties (Bottom 25%) earn around $115 per night.
Average Daily Rate (ADR) Trend by Month in Voorthuizen
Get Live Voorthuizen Market Intelligence 👇

Explore Real-time Analytics
Airbnb Seasonality Analysis & Trends in Voorthuizen (2026)
Peak Season (August, July, October)
- Revenue averages $3,281 per month
- Occupancy rates average 48.6%
- Daily rates average $255
Shoulder Season
- Revenue averages $2,694 per month
- Occupancy maintains around 41.2%
- Daily rates hold near $234
Low Season (January, February, March)
- Revenue drops to average $2,148 per month
- Occupancy decreases to average 31.3%
- Daily rates adjust to average $208
Seasonality Insights for Voorthuizen
- The Airbnb seasonality in Voorthuizen shows moderate seasonality with distinct peak and low periods. While the sections above show seasonal averages, it's also insightful to look at the extremes:
- During the high season, the absolute peak month showcases Voorthuizen's highest earning potential, with monthly revenues capable of climbing to $3,771, occupancy reaching a high of 54.4%, and ADRs peaking at $262.
- Conversely, the slowest single month of the year, typically falling within the low season, marks the market's lowest point. In this month, revenue might dip to $1,883, occupancy could drop to 24.6%, and ADRs may adjust down to $181.
- Understanding both the seasonal averages and these monthly peaks and troughs in revenue, occupancy, and ADR is crucial for maximizing your Airbnb profit potential in Voorthuizen.
Seasonal Strategies for Maximizing Profit
- Peak Season: Maximize revenue through premium pricing and potentially longer minimum stays. Ensure high availability.
- Low Season: Offer competitive pricing, special promotions (e.g., extended stay discounts), and flexible cancellation policies. Target off-season travelers like remote workers or budget-conscious guests.
- Shoulder Seasons: Implement dynamic pricing that balances peak and low rates. Target weekend travelers or specific events. Offer slightly more flexible terms than peak season.
- Regularly analyze your own performance against these Voorthuizen seasonality benchmarks and adjust your pricing and availability strategy accordingly.
Best Areas for Airbnb Investment in Voorthuizen (2026)
Exploring the top neighborhoods for short-term rentals in Voorthuizen? This section highlights key areas, outlining why they are attractive for hosts and guests, along with notable local attractions. Consider these locations based on your target guest profile and investment strategy.
| Neighborhood / Area | Why Host Here? (Target Guests & Appeal) | Key Attractions & Landmarks |
|---|---|---|
| Voorthuizen Center | The heart of Voorthuizen, close to shops, restaurants, and local amenities. Ideal for guests seeking convenience and a central location to explore the village. | Local Market Square, Shops and Cafes, Voorthuizen Church, The Voorthuizen Windmill |
| Veluwe National Park | A short drive from Voorthuizen, this national park offers beautiful landscapes and outdoor activities. Perfect for nature enthusiasts and families looking for adventure. | Hiking Trails, Wildlife Watching, Biking Routes, Scenic Views |
| De Zanden | A tranquil area nearby with a focus on nature and relaxation. Suitable for guests looking to escape the hustle and bustle and enjoy the peaceful surroundings. | Natural Reserves, Walking Paths, Picnic Areas |
| Zuidhuis | A picturesque neighborhood known for its charming architecture and hospitality. Great for guests wanting a quiet, residential experience close to local culture. | Charming Streets, Community Events, Local Art |
| The Veluwe | A beautiful region famous for its sandy hills and forests, ideal for those seeking outdoor recreation and serene landscapes. | Hiking and Biking Trails, Natural Parks, Wildlife |
| Voorthuizen Recreation Park | Offers various recreational facilities, making it an attractive location for families and groups looking for entertainment and leisure activities. | Swimming Pools, Playgrounds, Sport Facilities |
| Nearby Historic Towns | Close proximity to several historic towns that offer rich cultural experiences and sightseeing opportunities. Perfect for history buffs and tourists. | Historical Museums, Old Town Centers, Cultural Festivals |
| Lakes and Beaches | Several beautiful lakes and swimming areas nearby, providing a relaxing getaway for guests looking for water activities and sunny days. | Lake Swimming, Water Sports, Picnic Spots |
Understanding Airbnb License Requirements & STR Laws in Voorthuizen (2026)
While Voorthuizen, Gelderland, Netherlands currently shows low STR regulations, specific Airbnb license requirements might still exist or change. Always verify the latest short term rental regulations and Airbnb license requirements directly with local government authorities for Voorthuizen to ensure full compliance before hosting.
(Source: AirROI data, 2026, based on 1% licensed listings)
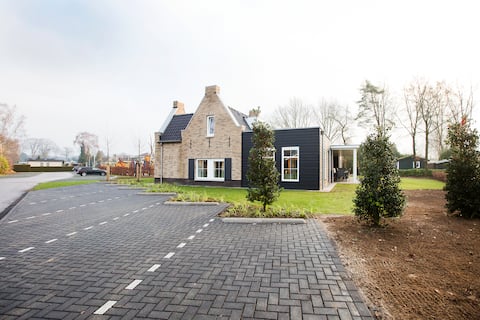
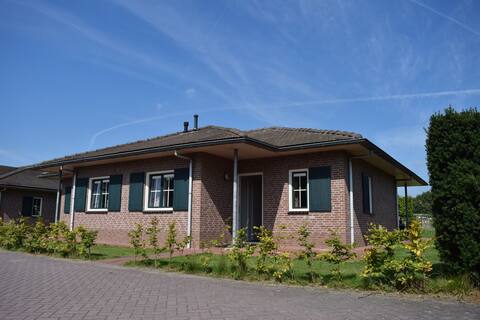
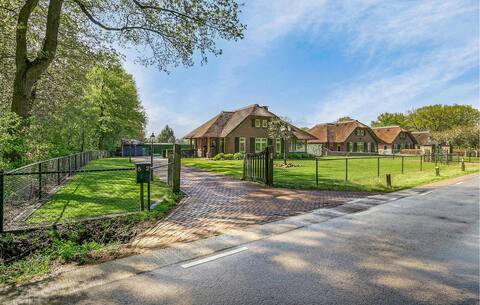
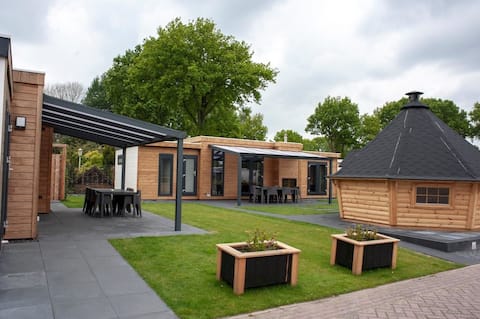
Top Performing Airbnb Properties in Voorthuizen (2026)
Benchmark your potential! Explore examples of top-performing Airbnb properties in Voorthuizenbased on Trailing Twelve Month (TTM) revenue. Analyze their characteristics, revenue, occupancy rate, and ADR to understand what drives success in this market.
Group Villa Extra Accessible | 24 Pers.
Entire Place • 10 bedrooms
Bungalow Voorde | 16 people
Entire Place • 8 bedrooms
3 bedroom cozy home in Voorthuizen
Entire Place • 3 bedrooms
Veluwe Villawijk | 18 people
Entire Place • 9 bedrooms
Group Villa | 24 Pers.
Entire Place • 10 bedrooms

Group villa | 24 people
Entire Place • 11 bedrooms
Note: Performance varies based on location, size, amenities, seasonality, and management quality. Data reflects the past 12 months.
Top Performing Airbnb Hosts in Voorthuizen (2026)
Learn from the best! This table showcases top-performing Airbnb hosts in Voorthuizen based on the number of properties managed and estimated total revenue over the past year. Analyze their scale and performance metrics.
| Host Name | Properties | Grossing Revenue | Stay Reviews | Avg Rating |
|---|---|---|---|---|
| Claudia | 35 | $883,669 | 104 | 4.32/5.0 |
| Mark | 18 | $738,434 | 70 | 4.60/5.0 |
| Roomseller | 6 | $134,715 | 83 | 4.10/5.0 |
| Linde | 4 | $114,188 | 235 | 4.83/5.0 |
| Novasol | 1 | $109,015 | 10 | 4.90/5.0 |
| Tamara - BELVILLA | 9 | $92,791 | 76 | 4.67/5.0 |
| Astrid | 3 | $68,409 | 433 | 4.86/5.0 |
| Ruben | 1 | $55,723 | 110 | 4.70/5.0 |
| Peter En Anouk | 1 | $53,333 | 82 | 4.95/5.0 |
| Dagmar | 1 | $51,619 | 84 | 4.93/5.0 |
Analyzing the strategies of top hosts, such as their property selection, pricing, and guest communication, can offer valuable lessons for optimizing your own Airbnb operations in Voorthuizen.
Dive Deeper: Advanced Voorthuizen STR Market Data (2026)
Ready to unlock more insights? AirROI provides access to advanced metrics and comprehensive Airbnb data for Voorthuizen. Explore detailed analytics beyond this report to refine your investment strategy, optimize pricing, and maximize your vacation rental profits.
Explore Advanced MetricsVoorthuizen Short-Term Rental Market Composition (2026): Property & Room Types
Room Type Distribution
Property Type Distribution
Market Composition Insights for Voorthuizen
- The Voorthuizen Airbnb market composition is heavily skewed towards Entire Home/Apt listings, which make up 99.4% of the 165 active rentals. This indicates strong guest preference for privacy and space.
- Looking at the property type distribution in Voorthuizen, House properties are the most common (89.1%), reflecting the local real estate landscape.
- Houses represent a significant 89.1% portion, catering likely to families or larger groups.
- Smaller segments like hotel/boutique, others, unique stays (combined 3.6%) offer potential for unique stay experiences.
Voorthuizen Airbnb Room Capacity Analysis (2026): Bedroom Distribution
Distribution of Listings by Number of Bedrooms
Room Capacity Insights for Voorthuizen
- The dominant room capacity in Voorthuizen is 2 bedrooms listings, making up 48.5% of the market. This suggests a strong demand for properties suitable for couples or solo travelers.
- Together, 2 bedrooms and 3 bedrooms properties represent 74.6% of the active Airbnb listings in Voorthuizen, indicating a high concentration in these sizes.
- A significant 40.7% of listings offer 3+ bedrooms, catering to larger groups and families seeking more space in Voorthuizen.
Voorthuizen Vacation Rental Guest Capacity Trends (2026)
Distribution of Listings by Guest Capacity
Guest Capacity Insights for Voorthuizen
- The most common guest capacity trend in Voorthuizen vacation rentals is listings accommodating 4 guests (38.8%). This suggests the primary traveler segment is likely small families or groups.
- Properties designed for 4 guests and 6 guests dominate the Voorthuizen STR market, accounting for 63.0% of listings.
- 41.2% of properties accommodate 6+ guests, serving the market segment for larger families or group travel in Voorthuizen.
- On average, properties in Voorthuizen are equipped to host 5.0 guests.
Voorthuizen Airbnb Booking Patterns (2026): Available vs. Booked Days
Available Days Distribution
Booked Days Distribution
Booking Pattern Insights for Voorthuizen
- The most common availability pattern in Voorthuizen falls within the 271-366 days range, representing 50.9% of listings. This suggests many properties have significant open periods on their calendars.
- Approximately 81.2% of listings show high availability (181+ days open annually), indicating potential for increased bookings or specific owner usage patterns.
- For booked days, the 91-180 days range is most frequent in Voorthuizen (32.7%), reflecting common guest stay durations or potential owner blocking patterns.
- A notable 18.8% of properties secure long booking periods (181+ days booked per year), highlighting successful long-term rental strategies or significant owner usage.
Voorthuizen Airbnb Minimum Stay Requirements Analysis
Distribution of Listings by Minimum Night Requirement
1 Night
71 listings
43% of total
2 Nights
23 listings
13.9% of total
3 Nights
11 listings
6.7% of total
4-6 Nights
5 listings
3% of total
7-29 Nights
6 listings
3.6% of total
30+ Nights
49 listings
29.7% of total
Key Insights
- The most prevalent minimum stay requirement in Voorthuizen is 1 Night, adopted by 43% of listings. This highlights the market's preference for shorter, flexible bookings.
- A significant segment (29.7%) caters to monthly stays (30+ nights) in Voorthuizen, pointing to opportunities in the extended-stay market.
Recommendations
- Align with the market by considering a 1 Night minimum stay, as 43% of Voorthuizen hosts use this setting.
- Explore offering discounts for stays of 30+ nights to attract the 29.7% of the market seeking extended stays.
- Adjust minimum nights based on seasonality – potentially shorter during low season and longer during peak demand periods in Voorthuizen.
Voorthuizen Airbnb Cancellation Policy Trends Analysis (2026)
Super Strict 60 Days
8 listings
4.9% of total
Super Strict 30 Days
6 listings
3.7% of total
Limited
17 listings
10.4% of total
Flexible
29 listings
17.7% of total
Moderate
35 listings
21.3% of total
Firm
64 listings
39% of total
Strict
5 listings
3% of total
Cancellation Policy Insights for Voorthuizen
- The prevailing Airbnb cancellation policy trend in Voorthuizen is Firm, used by 39% of listings.
- There's a relatively balanced mix between guest-friendly (39.0%) and stricter (42.0%) policies, offering choices for different guest needs.
- Strict cancellation policies are quite rare (3%), potentially making listings with this policy less competitive unless justified by high demand or property type.
Recommendations for Hosts
- Consider adopting a Firm policy to align with the 39% market standard in Voorthuizen.
- Using a Strict policy might deter some guests, as only 3% of listings use it. Evaluate if potential revenue protection outweighs possible lower booking rates.
- Regularly review your cancellation policy against competitors and market demand shifts in Voorthuizen.
Voorthuizen STR Booking Lead Time Analysis (2026)
Average Booking Lead Time by Month
Booking Lead Time Insights for Voorthuizen
- The overall average booking lead time for vacation rentals in Voorthuizen is 69 days.
- Guests book furthest in advance for stays during September (average 86 days), likely coinciding with peak travel demand or local events.
- The shortest booking windows occur for stays in February (average 36 days), indicating more last-minute travel plans during this time.
- Seasonally, Summer (74 days avg.) sees the longest lead times, while Winter (52 days avg.) has the shortest, reflecting typical travel planning cycles.
Recommendations for Hosts
- Use the overall average lead time (69 days) as a baseline for your pricing and availability strategy in Voorthuizen.
- For September stays, consider implementing length-of-stay discounts or slightly higher rates for bookings made less than 86 days out to capitalize on advance planning.
- Target marketing efforts for the Summer season well in advance (at least 74 days) to capture early planners.
- Monitor your own booking lead times against these Voorthuizen averages to identify opportunities for dynamic pricing adjustments.
Popular & Essential Airbnb Amenities in Voorthuizen (2026)
Amenity Prevalence
Amenity Insights for Voorthuizen
- Essential amenities in Voorthuizen that guests expect include: Kitchen, Coffee maker, Wifi. Lacking these (any) could significantly impact bookings.
- Popular amenities like Heating, Refrigerator, TV are common but not universal. Offering these can provide a competitive edge.
Recommendations for Hosts
- Ensure your listing includes all essential amenities for Voorthuizen: Kitchen, Coffee maker, Wifi.
- Prioritize adding missing essentials: Kitchen, Coffee maker, Wifi.
- Consider adding popular differentiators like Heating or Refrigerator to increase appeal.
- Highlight unique or less common amenities you offer (e.g., hot tub, dedicated workspace, EV charger) in your listing description and photos.
- Regularly check competitor amenities in Voorthuizen to stay competitive.
Voorthuizen Airbnb Guest Demographics & Profile Analysis (2026)
Guest Profile Summary for Voorthuizen
- The typical guest profile for Airbnb in Voorthuizen consists of a mix of domestic (45%) and international guests, with top international origins including Germany, typically belonging to the Post-2000s (Gen Z/Alpha) group (50%), primarily speaking English or German.
- Domestic travelers account for 45.3% of guests.
- Key international markets include Netherlands (45.3%) and Germany (27.6%).
- Top languages spoken are English (38%) followed by German (19.5%).
- A significant demographic segment is the Post-2000s (Gen Z/Alpha) group, representing 50% of guests.
Recommendations for Hosts
- Balance marketing efforts between domestic and international channels based on the guest mix.
- Tailor amenities and listing descriptions to appeal to the dominant Post-2000s (Gen Z/Alpha) demographic (e.g., highlight fast WiFi, smart home features, local guides).
- Highlight unique local experiences or amenities relevant to the primary guest profile.
- Consider seasonal promotions aligned with peak travel times for key origin markets.
Nearby Short-Term Rental Market Comparison
How does the Voorthuizen Airbnb market stack up against its neighbors? Compare key performance metrics like average monthly revenue, ADR, and occupancy rates in surrounding areas to understand the broader regional STR landscape.
| Market | Active Properties | Monthly Revenue | Daily Rate | Avg. Occupancy |
|---|---|---|---|---|
| Losser | 10 | $7,954 | $1060.34 | 27% |
| Raamsdonksveer | 16 | $7,756 | $736.17 | 38% |
| Kockengen | 11 | $6,027 | $485.77 | 53% |
| Haghorst | 11 | $5,995 | $480.40 | 40% |
| Baarlo | 20 | $5,442 | $332.61 | 51% |
| Merksplas | 12 | $5,367 | $356.64 | 43% |
| Bentveld | 15 | $4,727 | $517.02 | 50% |
| Zwanenburg | 22 | $4,111 | $255.87 | 61% |
| Wormer | 11 | $3,997 | $226.69 | 59% |
| Roelofarendsveen | 17 | $3,861 | $194.80 | 63% |