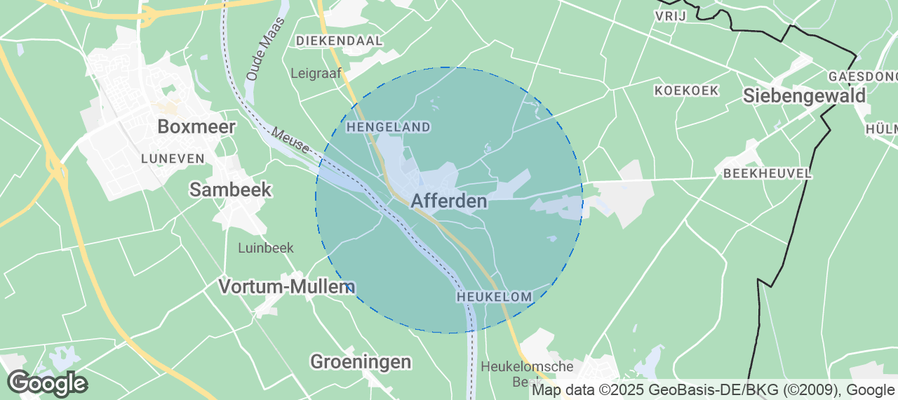
Afferden Airbnb Market Analysis 2026: Short Term Rental Data & Vacation Rental Statistics in Limburg, Netherlands
Is Airbnb profitable in Afferden in 2026? Explore comprehensive Airbnb analytics for Afferden, Limburg, Netherlands to uncover income potential. This 2026 STR market report for Afferden, based on AirROI data from February 2025 to January 2026, reveals key trends in the niche market of 19 active listings.
Whether you're considering an Airbnb investment in Afferden, optimizing your existing vacation rental, or exploring rental arbitrage opportunities, understanding the Afferden Airbnb data is crucial. Leveraging the low regulation environment is key to maximizing your short term rental income potential. Let's dive into the specifics.
Key Afferden Airbnb Performance Metrics Overview
Monthly Airbnb Revenue Variations & Income Potential in Afferden (2026)
Understanding the monthly revenue variations for Airbnb listings in Afferden is key to maximizing your short term rental income potential. Seasonality significantly impacts earnings. Our analysis, based on data from the past 12 months, shows that the peak revenue month for STRs in Afferden is typically September, while February often presents the lowest earnings, highlighting opportunities for strategic pricing adjustments during shoulder and low seasons. Explore the typical Airbnb income in Afferden across different performance tiers:
- Best-in-class properties (Top 10%) achieve $5,282+ monthly, often utilizing dynamic pricing and superior guest experiences.
- Strong performing properties (Top 25%) earn $3,497 or more, indicating effective management and desirable locations/amenities.
- Typical properties (Median) generate around $2,258 per month, representing the average market performance.
- Entry-level properties (Bottom 25%) see earnings around $1,348, often with potential for optimization.
Average Monthly Airbnb Earnings Trend in Afferden
Afferden Airbnb Occupancy Rate Trends (2026)
Maximize your bookings by understanding the Afferden STR occupancy trends. Seasonal demand shifts significantly influence how often properties are booked. Typically, Septembersees the highest demand (peak season occupancy), while January experiences the lowest (low season). Effective strategies, like adjusting minimum stays or offering promotions, can boost occupancy during slower periods. Here's how different property tiers perform in Afferden:
- Best-in-class properties (Top 10%) achieve 79%+ occupancy, indicating high desirability and potentially optimized availability.
- Strong performing properties (Top 25%) maintain 57% or higher occupancy, suggesting good market fit and guest satisfaction.
- Typical properties (Median) have an occupancy rate around 35%.
- Entry-level properties (Bottom 25%) average 21% occupancy, potentially facing higher vacancy.
Average Monthly Occupancy Rate Trend in Afferden
Average Daily Rate (ADR) Airbnb Trends in Afferden (2026)
Effective short term rental pricing strategy in Afferden involves understanding monthly ADR fluctuations. The Average Daily Rate (ADR) for Airbnb in Afferden typically peaks in August and dips lowest during November. Leveraging Airbnb dynamic pricing tools or strategies based on this seasonality can significantly boost revenue. Here's a look at the typical nightly rates achieved:
- Best-in-class properties (Top 10%) command rates of $401+ per night, often due to premium features or locations.
- Strong performing properties (Top 25%) achieve nightly rates of $350 or more.
- Typical properties (Median) charge around $228 per night.
- Entry-level properties (Bottom 25%) earn around $106 per night.
Average Daily Rate (ADR) Trend by Month in Afferden
Get Live Afferden Market Intelligence 👇
Explore Real-time Analytics
Airbnb Seasonality Analysis & Trends in Afferden (2026)
Peak Season (September, June, August)
- Revenue averages $4,101 per month
- Occupancy rates average 49.2%
- Daily rates average $251
Shoulder Season
- Revenue averages $2,652 per month
- Occupancy maintains around 44.7%
- Daily rates hold near $237
Low Season (January, February, May)
- Revenue drops to average $1,387 per month
- Occupancy decreases to average 25.4%
- Daily rates adjust to average $237
Seasonality Insights for Afferden
- The Airbnb seasonality in Afferden shows highly seasonal trends requiring careful strategy. While the sections above show seasonal averages, it's also insightful to look at the extremes:
- During the high season, the absolute peak month showcases Afferden's highest earning potential, with monthly revenues capable of climbing to $4,338, occupancy reaching a high of 53.1%, and ADRs peaking at $255.
- Conversely, the slowest single month of the year, typically falling within the low season, marks the market's lowest point. In this month, revenue might dip to $1,143, occupancy could drop to 22.6%, and ADRs may adjust down to $192.
- Understanding both the seasonal averages and these monthly peaks and troughs in revenue, occupancy, and ADR is crucial for maximizing your Airbnb profit potential in Afferden.
Seasonal Strategies for Maximizing Profit
- Peak Season: Maximize revenue through premium pricing and potentially longer minimum stays. Ensure high availability.
- Low Season: Offer competitive pricing, special promotions (e.g., extended stay discounts), and flexible cancellation policies. Target off-season travelers like remote workers or budget-conscious guests.
- Shoulder Seasons: Implement dynamic pricing that balances peak and low rates. Target weekend travelers or specific events. Offer slightly more flexible terms than peak season.
- Regularly analyze your own performance against these Afferden seasonality benchmarks and adjust your pricing and availability strategy accordingly.
Best Areas for Airbnb Investment in Afferden (2026)
Exploring the top neighborhoods for short-term rentals in Afferden? This section highlights key areas, outlining why they are attractive for hosts and guests, along with notable local attractions. Consider these locations based on your target guest profile and investment strategy.
| Neighborhood / Area | Why Host Here? (Target Guests & Appeal) | Key Attractions & Landmarks |
|---|---|---|
| Susteren | A charming village in the Limburg province offering a peaceful environment with rich history. Attracts visitors looking for a tranquil getaway close to nature and historical sites. | Kasteel Ter Borch, St. Martinus Church, De Maasduinen National Park, Local cycling routes, Peaceful rural landscapes |
| Roermond | A vibrant city with great shopping and culture, known for its outlet center and scenic waterfront. A popular destination for tourists looking for leisure and retail therapy. | Designer Outlet Roermond, Roermond Cathedral, Museum van de Vrouw, Maasplassen, Market Square |
| Venlo | A dynamic city with a mix of cultural offerings and business opportunities. Ideal for visitors interested in both leisure and proximity to the German border. | Venlo's Market Square, Museum van Bommel van Dam, St. Martin's Church, Limburgs Museum, Shopping streets |
| Maastricht | Known for its stunning architecture and vibrant culture, this university city attracts a younger crowd and international tourists. A great spot for weekend getaways. | Vrijthof Square, Maastricht University, St. Pietersberg Caves, Bonnefanten Museum, Shopping and dining in Wyck |
| Eindhoven | A hub of innovation and design, attracting tech enthusiasts and creative individuals. Ideal for business travelers and people attending events or conferences. | Van Abbemuseum, Philips Museum, Eindhoven Design Academy, DAF Museum, Parks and green spaces |
| Asten | A small town with a cozy vibe, favorable for families and those looking for a quiet spot in Limburg, surrounded by nature and ideal for cycling. | Asten's windmill, Nature reserves, Local markets, Bicycle paths, Historic churches |
| Lottum | Known as the rose village of Limburg, perfect for nature lovers and those seeking a rural retreat. Attracts visitors interested in horticulture and agriculture. | Rose Gardens, Lottum Nature Walks, Cycling routes, Local farms, Cultural events |
| Grubbenvorst | A quaint village that offers a laid-back atmosphere with close proximity to larger towns, perfect for those wanting to explore Limburg's countryside. | Local vineyards, Cycling paths, Rural landscapes, Traditional Dutch architecture, Community events |
Understanding Airbnb License Requirements & STR Laws in Afferden (2026)
While Afferden, Limburg, Netherlands currently shows low STR regulations, specific Airbnb license requirements might still exist or change. Always verify the latest short term rental regulations and Airbnb license requirements directly with local government authorities for Afferden to ensure full compliance before hosting.
(Source: AirROI data, 2026, finding no licensed listings among those analyzed)
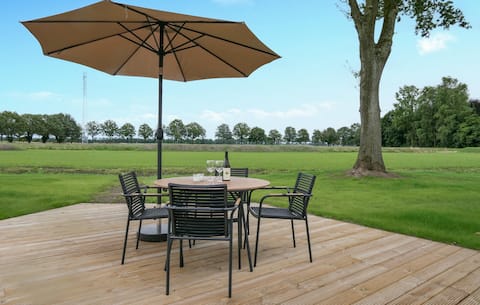
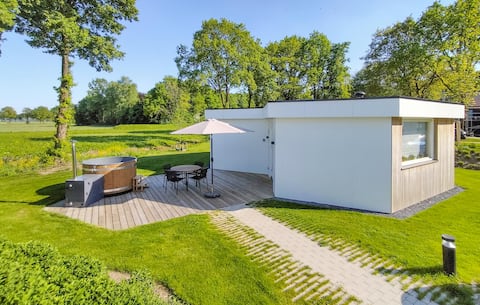
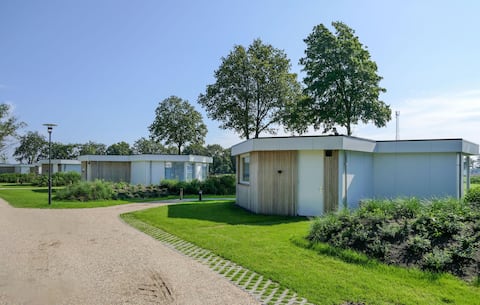
Top Performing Airbnb Properties in Afferden (2026)
Benchmark your potential! Explore examples of top-performing Airbnb properties in Afferdenbased on Trailing Twelve Month (TTM) revenue. Analyze their characteristics, revenue, occupancy rate, and ADR to understand what drives success in this market.
2 bedroom stunning home in Afferden
Entire Place • 2 bedrooms
2 bedroom stunning home in Afferden
Entire Place • 2 bedrooms

Angelbeeck Farm Holiday Apartment
Entire Place • 4 bedrooms
2 bedroom beautiful home in Afferden
Entire Place • 2 bedrooms

Pet friendly home in Afferden with WiFi
Entire Place • 2 bedrooms
2 bedroom pet friendly home in Afferden
Entire Place • 2 bedrooms
Note: Performance varies based on location, size, amenities, seasonality, and management quality. Data reflects the past 12 months.
Top Performing Airbnb Hosts in Afferden (2026)
Learn from the best! This table showcases top-performing Airbnb hosts in Afferden based on the number of properties managed and estimated total revenue over the past year. Analyze their scale and performance metrics.
| Host Name | Properties | Grossing Revenue | Stay Reviews | Avg Rating |
|---|---|---|---|---|
| Novasol | 10 | $310,333 | 35 | 4.77/5.0 |
| Romy | 3 | $66,225 | 108 | 4.91/5.0 |
| Albert | 2 | $39,732 | 109 | 4.93/5.0 |
| Peter & Ingrid | 1 | $22,832 | 305 | 4.86/5.0 |
| Linette | 1 | $18,986 | 197 | 4.92/5.0 |
| Martijntje | 1 | $7,971 | 11 | 4.82/5.0 |
| Christine | 1 | $5,584 | 264 | 4.80/5.0 |
Analyzing the strategies of top hosts, such as their property selection, pricing, and guest communication, can offer valuable lessons for optimizing your own Airbnb operations in Afferden.
Dive Deeper: Advanced Afferden STR Market Data (2026)
Ready to unlock more insights? AirROI provides access to advanced metrics and comprehensive Airbnb data for Afferden. Explore detailed analytics beyond this report to refine your investment strategy, optimize pricing, and maximize your vacation rental profits.
Explore Advanced MetricsAfferden Short-Term Rental Market Composition (2026): Property & Room Types
Room Type Distribution
Property Type Distribution
Market Composition Insights for Afferden
- The Afferden Airbnb market composition is heavily skewed towards Entire Home/Apt listings, which make up 100% of the 19 active rentals. This indicates strong guest preference for privacy and space.
- Looking at the property type distribution in Afferden, House properties are the most common (73.7%), reflecting the local real estate landscape.
- Houses represent a significant 73.7% portion, catering likely to families or larger groups.
Afferden Airbnb Room Capacity Analysis (2026): Bedroom Distribution
Distribution of Listings by Number of Bedrooms
Room Capacity Insights for Afferden
- The dominant room capacity in Afferden is 2 bedrooms listings, making up 63.2% of the market. This suggests a strong demand for properties suitable for couples or solo travelers.
- Together, 2 bedrooms and 1 bedroom properties represent 79.0% of the active Airbnb listings in Afferden, indicating a high concentration in these sizes.
Afferden Vacation Rental Guest Capacity Trends (2026)
Distribution of Listings by Guest Capacity
Guest Capacity Insights for Afferden
- The most common guest capacity trend in Afferden vacation rentals is listings accommodating 4 guests (52.6%). This suggests the primary traveler segment is likely small families or groups.
- Properties designed for 4 guests and 6 guests dominate the Afferden STR market, accounting for 68.4% of listings.
- 21.1% of properties accommodate 6+ guests, serving the market segment for larger families or group travel in Afferden.
- On average, properties in Afferden are equipped to host 4.3 guests.
Afferden Airbnb Booking Patterns (2026): Available vs. Booked Days
Available Days Distribution
Booked Days Distribution
Booking Pattern Insights for Afferden
- The most common availability pattern in Afferden falls within the 181-270 days range, representing 42.1% of listings. This suggests many properties have significant open periods on their calendars.
- Approximately 84.2% of listings show high availability (181+ days open annually), indicating potential for increased bookings or specific owner usage patterns.
- For booked days, the 91-180 days range is most frequent in Afferden (42.1%), reflecting common guest stay durations or potential owner blocking patterns.
- A notable 15.8% of properties secure long booking periods (181+ days booked per year), highlighting successful long-term rental strategies or significant owner usage.
Afferden Airbnb Minimum Stay Requirements Analysis
Distribution of Listings by Minimum Night Requirement
1 Night
5 listings
26.3% of total
2 Nights
3 listings
15.8% of total
30+ Nights
11 listings
57.9% of total
Key Insights
- The most prevalent minimum stay requirement in Afferden is 30+ Nights, adopted by 57.9% of listings. This highlights the market's preference for longer commitments.
- A significant segment (57.9%) caters to monthly stays (30+ nights) in Afferden, pointing to opportunities in the extended-stay market.
Recommendations
- Align with the market by considering a 30+ Nights minimum stay, as 57.9% of Afferden hosts use this setting.
- If feasible, allowing 1-night stays, especially midweek or during low season, could capture last-minute bookings, as only 26.3% currently do.
- Explore offering discounts for stays of 30+ nights to attract the 57.9% of the market seeking extended stays.
- Adjust minimum nights based on seasonality – potentially shorter during low season and longer during peak demand periods in Afferden.
Afferden Airbnb Cancellation Policy Trends Analysis (2026)
Limited
1 listings
5.3% of total
Super Strict 60 Days
10 listings
52.6% of total
Flexible
2 listings
10.5% of total
Moderate
3 listings
15.8% of total
Firm
2 listings
10.5% of total
Strict
1 listings
5.3% of total
Cancellation Policy Insights for Afferden
- The prevailing Airbnb cancellation policy trend in Afferden is Super Strict 60 Days, used by 52.6% of listings.
- There's a relatively balanced mix between guest-friendly (26.3%) and stricter (15.8%) policies, offering choices for different guest needs.
- Strict cancellation policies are quite rare (5.3%), potentially making listings with this policy less competitive unless justified by high demand or property type.
Recommendations for Hosts
- Consider adopting a Super Strict 60 Days policy to align with the 52.6% market standard in Afferden.
- Using a Strict policy might deter some guests, as only 5.3% of listings use it. Evaluate if potential revenue protection outweighs possible lower booking rates.
- Regularly review your cancellation policy against competitors and market demand shifts in Afferden.
Afferden STR Booking Lead Time Analysis (2026)
Average Booking Lead Time by Month
Booking Lead Time Insights for Afferden
- The overall average booking lead time for vacation rentals in Afferden is 50 days.
- Guests book furthest in advance for stays during March (average 88 days), likely coinciding with peak travel demand or local events.
- The shortest booking windows occur for stays in January (average 25 days), indicating more last-minute travel plans during this time.
- Seasonally, Fall (66 days avg.) sees the longest lead times, while Winter (43 days avg.) has the shortest, reflecting typical travel planning cycles.
Recommendations for Hosts
- Use the overall average lead time (50 days) as a baseline for your pricing and availability strategy in Afferden.
- For March stays, consider implementing length-of-stay discounts or slightly higher rates for bookings made less than 88 days out to capitalize on advance planning.
- Target marketing efforts for the Fall season well in advance (at least 66 days) to capture early planners.
- Monitor your own booking lead times against these Afferden averages to identify opportunities for dynamic pricing adjustments.
Popular & Essential Airbnb Amenities in Afferden (2026)
Amenity Prevalence
Amenity Insights for Afferden
- Essential amenities in Afferden that guests expect include: Smoke alarm, Free parking on premises, Kitchen, Stove, Cooking basics, Dishes and silverware. Lacking these (any) could significantly impact bookings.
- Popular amenities like Wifi, Heating, Hangers are common but not universal. Offering these can provide a competitive edge.
- Warning: Wifi is not universally provided but is considered essential globally. Ensure reliable Wifi is offered.
Recommendations for Hosts
- Ensure your listing includes all essential amenities for Afferden: Smoke alarm, Free parking on premises, Kitchen, Stove, Cooking basics, Dishes and silverware.
- Consider adding popular differentiators like Wifi or Heating to increase appeal.
- Highlight unique or less common amenities you offer (e.g., hot tub, dedicated workspace, EV charger) in your listing description and photos.
- Regularly check competitor amenities in Afferden to stay competitive.
Afferden Airbnb Guest Demographics & Profile Analysis (2026)
Guest Profile Summary for Afferden
- The typical guest profile for Airbnb in Afferden consists of a mix of domestic (65%) and international guests, often arriving from nearby Utrecht, typically belonging to the Post-2000s (Gen Z/Alpha) group (50%), primarily speaking English or Dutch.
- Domestic travelers account for 65.0% of guests.
- Key international markets include Netherlands (65%) and Germany (24.8%).
- Top languages spoken are English (39%) followed by Dutch (23.4%).
- A significant demographic segment is the Post-2000s (Gen Z/Alpha) group, representing 50% of guests.
Recommendations for Hosts
- Target domestic marketing efforts towards travelers from Utrecht and Amsterdam.
- Tailor amenities and listing descriptions to appeal to the dominant Post-2000s (Gen Z/Alpha) demographic (e.g., highlight fast WiFi, smart home features, local guides).
- Highlight unique local experiences or amenities relevant to the primary guest profile.
- Consider seasonal promotions aligned with peak travel times for key origin markets.
Nearby Short-Term Rental Market Comparison
How does the Afferden Airbnb market stack up against its neighbors? Compare key performance metrics like average monthly revenue, ADR, and occupancy rates in surrounding areas to understand the broader regional STR landscape.
| Market | Active Properties | Monthly Revenue | Daily Rate | Avg. Occupancy |
|---|---|---|---|---|
| Losser | 10 | $7,954 | $1060.34 | 27% |
| Haghorst | 11 | $5,995 | $480.40 | 40% |
| Baarlo | 20 | $5,442 | $332.61 | 51% |
| Wellin | 12 | $4,365 | $446.64 | 42% |
| Aubel | 26 | $4,191 | $283.88 | 46% |
| Bertogne | 26 | $3,839 | $325.90 | 42% |
| Kortenhoef | 14 | $3,655 | $255.24 | 55% |
| Samrée | 18 | $3,497 | $375.75 | 31% |
| Zeewolde | 157 | $3,494 | $351.76 | 37% |
| Heers | 30 | $3,405 | $294.43 | 39% |