Roggel Airbnb Market Analysis 2026: Short Term Rental Data & Vacation Rental Statistics in Limburg, Netherlands
Is Airbnb profitable in Roggel in 2026? Explore comprehensive Airbnb analytics for Roggel, Limburg, Netherlands to uncover income potential. This 2026 STR market report for Roggel, based on AirROI data from May 2024 to April 2025, reveals key trends in the niche market of 32 active listings.
Whether you're considering an Airbnb investment in Roggel, optimizing your existing vacation rental, or exploring rental arbitrage opportunities, understanding the Roggel Airbnb data is crucial. Leveraging the low regulation environment is key to maximizing your short term rental income potential. Let's dive into the specifics.
Key Roggel Airbnb Performance Metrics Overview
Monthly Airbnb Revenue Variations & Income Potential in Roggel (2026)
Understanding the monthly revenue variations for Airbnb listings in Roggel is key to maximizing your short term rental income potential. Seasonality significantly impacts earnings. Our analysis, based on data from the past 12 months, shows that the peak revenue month for STRs in Roggel is typically April, while January often presents the lowest earnings, highlighting opportunities for strategic pricing adjustments during shoulder and low seasons. Explore the typical Airbnb income in Roggel across different performance tiers:
- Best-in-class properties (Top 10%) achieve $3,086+ monthly, often utilizing dynamic pricing and superior guest experiences.
- Strong performing properties (Top 25%) earn $2,061 or more, indicating effective management and desirable locations/amenities.
- Typical properties (Median) generate around $1,056 per month, representing the average market performance.
- Entry-level properties (Bottom 25%) see earnings around $681, often with potential for optimization.
Average Monthly Airbnb Earnings Trend in Roggel
Roggel Airbnb Occupancy Rate Trends (2026)
Maximize your bookings by understanding the Roggel STR occupancy trends. Seasonal demand shifts significantly influence how often properties are booked. Typically, Aprilsees the highest demand (peak season occupancy), while January experiences the lowest (low season). Effective strategies, like adjusting minimum stays or offering promotions, can boost occupancy during slower periods. Here's how different property tiers perform in Roggel:
- Best-in-class properties (Top 10%) achieve 52%+ occupancy, indicating high desirability and potentially optimized availability.
- Strong performing properties (Top 25%) maintain 35% or higher occupancy, suggesting good market fit and guest satisfaction.
- Typical properties (Median) have an occupancy rate around 15%.
- Entry-level properties (Bottom 25%) average 10% occupancy, potentially facing higher vacancy.
Average Monthly Occupancy Rate Trend in Roggel
Average Daily Rate (ADR) Airbnb Trends in Roggel (2026)
Effective short term rental pricing strategy in Roggel involves understanding monthly ADR fluctuations. The Average Daily Rate (ADR) for Airbnb in Roggel typically peaks in January and dips lowest during November. Leveraging Airbnb dynamic pricing tools or strategies based on this seasonality can significantly boost revenue. Here's a look at the typical nightly rates achieved:
- Best-in-class properties (Top 10%) command rates of $408+ per night, often due to premium features or locations.
- Strong performing properties (Top 25%) achieve nightly rates of $329 or more.
- Typical properties (Median) charge around $263 per night.
- Entry-level properties (Bottom 25%) earn around $226 per night.
Average Daily Rate (ADR) Trend by Month in Roggel
Get Live Roggel Market Intelligence 👇

Explore Real-time Analytics
Airbnb Seasonality Analysis & Trends in Roggel (2025)
Peak Season (April, October, September)
- Revenue averages $2,340 per month
- Occupancy rates average 36.9%
- Daily rates average $265
Shoulder Season
- Revenue averages $1,526 per month
- Occupancy maintains around 21.3%
- Daily rates hold near $265
Low Season (January, February, March)
- Revenue drops to average $646 per month
- Occupancy decreases to average 15.2%
- Daily rates adjust to average $312
Seasonality Insights for Roggel
- The Airbnb seasonality in Roggel shows highly seasonal trends requiring careful strategy. While the sections above show seasonal averages, it's also insightful to look at the extremes:
- During the high season, the absolute peak month showcases Roggel's highest earning potential, with monthly revenues capable of climbing to $2,901, occupancy reaching a high of 57.8%, and ADRs peaking at $324.
- Conversely, the slowest single month of the year, typically falling within the low season, marks the market's lowest point. In this month, revenue might dip to $506, occupancy could drop to 11.3%, and ADRs may adjust down to $221.
- Understanding both the seasonal averages and these monthly peaks and troughs in revenue, occupancy, and ADR is crucial for maximizing your Airbnb profit potential in Roggel.
Seasonal Strategies for Maximizing Profit
- Peak Season: Maximize revenue through premium pricing and potentially longer minimum stays. Ensure high availability.
- Low Season: Offer competitive pricing, special promotions (e.g., extended stay discounts), and flexible cancellation policies. Target off-season travelers like remote workers or budget-conscious guests.
- Shoulder Seasons: Implement dynamic pricing that balances peak and low rates. Target weekend travelers or specific events. Offer slightly more flexible terms than peak season.
- Regularly analyze your own performance against these Roggel seasonality benchmarks and adjust your pricing and availability strategy accordingly.
Best Areas for Airbnb Investment in Roggel (2026)
Exploring the top neighborhoods for short-term rentals in Roggel? This section highlights key areas, outlining why they are attractive for hosts and guests, along with notable local attractions. Consider these locations based on your target guest profile and investment strategy.
| Neighborhood / Area | Why Host Here? (Target Guests & Appeal) | Key Attractions & Landmarks |
|---|---|---|
| Roggel City Center | The heart of Roggel with easy access to local shops, restaurants, and cultural sites. A popular choice for travelers looking for convenience and local experiences. | Local shops, Roggel Museum, Intermarche Roggel, Nearby nature parks, Restaurants |
| Lake Reinders | A picturesque area perfect for outdoor activities, attracting families and nature lovers. Guests enjoy beach access, water sports and scenic views. | Lake Reinders, Water sports activities, Picnic areas, Nature trails, Beach access |
| Roggel Parks | Roggel has several green parks that offer relaxation and outdoor fun, ideal for families and travelers looking for a peaceful retreat. | Park de Kasteeltuin, Playgrounds, Walking paths, Barbecue areas |
| Nearby Towns - Neer and Boxmeer | Charming towns close to Roggel providing unique local experiences, historic sites, and events. Great for guests wanting to explore beyond Roggel itself. | St. Lambertus Church in Neer, Historic town centers, Annual local events, Cultural festivals |
| Dining District | A hub for various dining options in Roggel, attracting food enthusiasts. Offers everything from local cuisine to international flavors. | Local restaurants, Cafes, Bakeries, Food festivals |
| Shopping Zone | The shopping area features a mix of local and brand-name stores, appealing to guests looking to shop during their stay. | Supermarkets, Clothing stores, Local markets, Shopping events |
| Roggel Cycling Routes | This area is known for its excellent cycling routes, attracting active travelers who enjoy exploring the landscape on bicycles. | Cycling paths, Bicycle rental services, Scenic routes |
| Cultural Experience Locations | Roggel offers various cultural experiences, appealing to visitors interested in art, music, and local traditions. | Local theaters, Art galleries, Cultural festivals, Music events |
Understanding Airbnb License Requirements & STR Laws in Roggel (2026)
While Roggel, Limburg, Netherlands currently shows low STR regulations, specific Airbnb license requirements might still exist or change. Always verify the latest short term rental regulations and Airbnb license requirements directly with local government authorities for Roggel to ensure full compliance before hosting.
(Source: AirROI data, 2026, finding no licensed listings among those analyzed)
Top Performing Airbnb Properties in Roggel (2026)
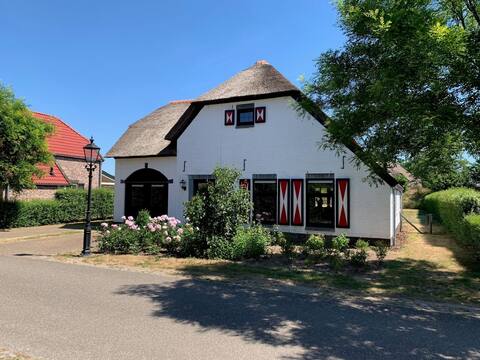
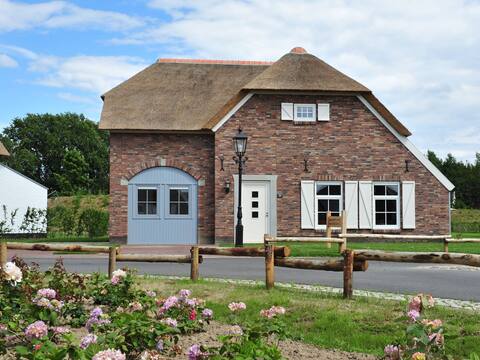
Benchmark your potential! Explore examples of top-performing Airbnb properties in Roggelbased on Trailing Twelve Month (TTM) revenue. Analyze their characteristics, revenue, occupancy rate, and ADR to understand what drives success in this market.
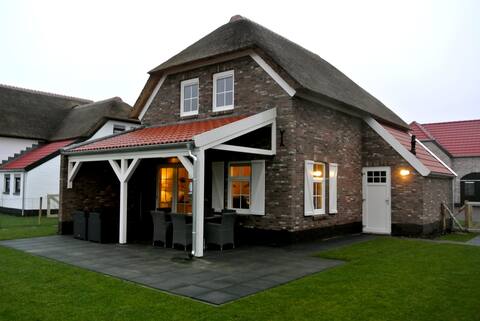
Luxury holiday villa with private sauna in Limburg
Entire Place • 3 bedrooms
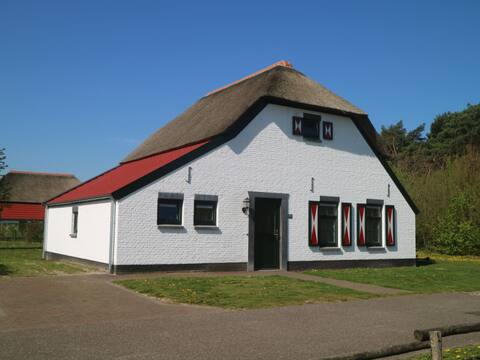
9 persoons Luxe by Interhome
Entire Place • 4 bedrooms
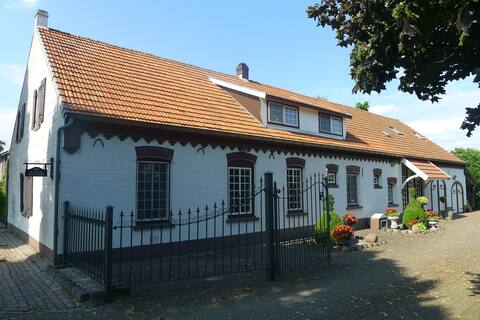
De Kleine Wijngaard, rural and quiet location.
Private Room • 3 bedrooms
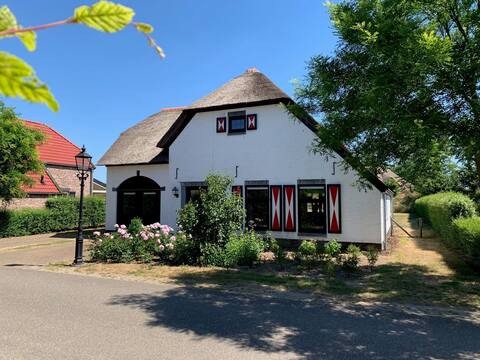
Nice, child-friendly villa with a sauna in Limburg
Entire Place • 6 bedrooms
Nice villa with sauna, whirlpool & steam shower
Entire Place • 5 bedrooms
Villa de luxe with sauna, whirlpool & steam shower
Entire Place • 6 bedrooms
Note: Performance varies based on location, size, amenities, seasonality, and management quality. Data reflects the past 12 months.
Top Performing Airbnb Hosts in Roggel (2026)
Learn from the best! This table showcases top-performing Airbnb hosts in Roggel based on the number of properties managed and estimated total revenue over the past year. Analyze their scale and performance metrics.
| Host Name | Properties | Grossing Revenue | Stay Reviews | Avg Rating |
|---|---|---|---|---|
| Host #124661153 | 26 | $147,442 | 10 | 0.00/5.0 |
| Host #135383379 | 2 | $37,073 | 10 | 4.20/5.0 |
| Jinny | 1 | $34,173 | 115 | 4.65/5.0 |
| Host #270217570 | 2 | $25,108 | 0 | 0.00/5.0 |
| Arthur | 1 | $22,554 | 52 | 4.50/5.0 |
Analyzing the strategies of top hosts, such as their property selection, pricing, and guest communication, can offer valuable lessons for optimizing your own Airbnb operations in Roggel.
Dive Deeper: Advanced Roggel STR Market Data (2026)
Ready to unlock more insights? AirROI provides access to advanced metrics and comprehensive Airbnb data for Roggel. Explore detailed analytics beyond this report to refine your investment strategy, optimize pricing, and maximize your vacation rental profits.
Explore Advanced MetricsRoggel Short-Term Rental Market Composition (2026): Property & Room Types
Room Type Distribution
Property Type Distribution
Market Composition Insights for Roggel
- The Roggel Airbnb market composition is heavily skewed towards Entire Home/Apt listings, which make up 96.9% of the 32 active rentals. This indicates strong guest preference for privacy and space.
- Looking at the property type distribution in Roggel, House properties are the most common (96.9%), reflecting the local real estate landscape.
- Houses represent a significant 96.9% portion, catering likely to families or larger groups.
- Smaller segments like outdoor/unique (combined 3.1%) offer potential for unique stay experiences.
Roggel Airbnb Room Capacity Analysis (2026): Bedroom Distribution
Distribution of Listings by Number of Bedrooms
Room Capacity Insights for Roggel
- The dominant room capacity in Roggel is 3 bedrooms listings, making up 43.8% of the market. This suggests a strong demand for properties suitable for families or small groups.
- Together, 3 bedrooms and 4 bedrooms properties represent 68.8% of the active Airbnb listings in Roggel, indicating a high concentration in these sizes.
- A significant 87.6% of listings offer 3+ bedrooms, catering to larger groups and families seeking more space in Roggel.
Roggel Vacation Rental Guest Capacity Trends (2026)
Distribution of Listings by Guest Capacity
Guest Capacity Insights for Roggel
- The most common guest capacity trend in Roggel vacation rentals is listings accommodating 8+ guests (43.8%). This suggests the primary traveler segment is likely larger groups.
- Properties designed for 8+ guests and 7 guests dominate the Roggel STR market, accounting for 62.6% of listings.
- 75.1% of properties accommodate 6+ guests, serving the market segment for larger families or group travel in Roggel.
- On average, properties in Roggel are equipped to host 6.5 guests.
Roggel Airbnb Booking Patterns (2026): Available vs. Booked Days
Available Days Distribution
Booked Days Distribution
Booking Pattern Insights for Roggel
- The most common availability pattern in Roggel falls within the 271-366 days range, representing 90.6% of listings. This suggests many properties have significant open periods on their calendars.
- Approximately 96.9% of listings show high availability (181+ days open annually), indicating potential for increased bookings or specific owner usage patterns.
- For booked days, the 1-30 days range is most frequent in Roggel (81.3%), reflecting common guest stay durations or potential owner blocking patterns.
- A notable 3.1% of properties secure long booking periods (181+ days booked per year), highlighting successful long-term rental strategies or significant owner usage.
Roggel Airbnb Minimum Stay Requirements Analysis
Distribution of Listings by Minimum Night Requirement
1 Night
3 listings
75% of total
30+ Nights
1 listings
25% of total
Key Insights
- The most prevalent minimum stay requirement in Roggel is 1 Night, adopted by 75% of listings. This highlights the market's preference for shorter, flexible bookings.
- A strong majority (75.0%) of the Roggel Airbnb data shows acceptance of very short stays (1-2 nights), indicating a dynamic, high-turnover market.
- A significant segment (25%) caters to monthly stays (30+ nights) in Roggel, pointing to opportunities in the extended-stay market.
Recommendations
- Align with the market by considering a 1 Night minimum stay, as 75% of Roggel hosts use this setting.
- Explore offering discounts for stays of 30+ nights to attract the 25% of the market seeking extended stays.
- Adjust minimum nights based on seasonality – potentially shorter during low season and longer during peak demand periods in Roggel.
Roggel Airbnb Cancellation Policy Trends Analysis (2026)
Super Strict 30 Days
2 listings
50% of total
Firm
1 listings
25% of total
Strict
1 listings
25% of total
Cancellation Policy Insights for Roggel
- The prevailing Airbnb cancellation policy trend in Roggel is Super Strict 30 Days, used by 50% of listings.
- There's a relatively balanced mix between guest-friendly (0.0%) and stricter (50.0%) policies, offering choices for different guest needs.
Recommendations for Hosts
- Consider adopting a Super Strict 30 Days policy to align with the 50% market standard in Roggel.
- Regularly review your cancellation policy against competitors and market demand shifts in Roggel.
Roggel STR Booking Lead Time Analysis (2026)
Average Booking Lead Time by Month
Booking Lead Time Insights for Roggel
- The overall average booking lead time for vacation rentals in Roggel is 24 days.
- Guests book furthest in advance for stays during May (average 118 days), likely coinciding with peak travel demand or local events.
- The shortest booking windows occur for stays in September (average 17 days), indicating more last-minute travel plans during this time.
- Seasonally, Winter (66 days avg.) sees the longest lead times, while Summer (33 days avg.) has the shortest, reflecting typical travel planning cycles.
Recommendations for Hosts
- Use the overall average lead time (24 days) as a baseline for your pricing and availability strategy in Roggel.
- For May stays, consider implementing length-of-stay discounts or slightly higher rates for bookings made less than 118 days out to capitalize on advance planning.
- Target marketing efforts for the Winter season well in advance (at least 66 days) to capture early planners.
- Monitor your own booking lead times against these Roggel averages to identify opportunities for dynamic pricing adjustments.
Popular & Essential Airbnb Amenities in Roggel (2026)
Amenity Prevalence
Amenity Insights for Roggel
- Essential amenities in Roggel that guests expect include: Washer, Wifi, Kitchen, Hot water, Smoke alarm, TV, Dryer, Heating, Dishwasher, Pool. Lacking these (any) could significantly impact bookings.
Recommendations for Hosts
- Ensure your listing includes all essential amenities for Roggel: Washer, Wifi, Kitchen, Hot water, Smoke alarm, TV, Dryer, Heating, Dishwasher, Pool.
- Prioritize adding missing essentials: Dishwasher, Pool.
- Highlight unique or less common amenities you offer (e.g., hot tub, dedicated workspace, EV charger) in your listing description and photos.
- Regularly check competitor amenities in Roggel to stay competitive.
Roggel Airbnb Guest Demographics & Profile Analysis (2026)
Guest Profile Summary for Roggel
- The typical guest profile for Airbnb in Roggel consists of a mix of domestic (56%) and international guests, often arriving from nearby Leiden, typically belonging to the Post-2000s (Gen Z/Alpha) group (50%), primarily speaking English or German.
- Domestic travelers account for 56.3% of guests.
- Key international markets include Netherlands (56.3%) and Germany (37.5%).
- Top languages spoken are English (35%) followed by German (30%).
- A significant demographic segment is the Post-2000s (Gen Z/Alpha) group, representing 50% of guests.
Recommendations for Hosts
- Balance marketing efforts between domestic and international channels based on the guest mix.
- Tailor amenities and listing descriptions to appeal to the dominant Post-2000s (Gen Z/Alpha) demographic (e.g., highlight fast WiFi, smart home features, local guides).
- Highlight unique local experiences or amenities relevant to the primary guest profile.
- Consider seasonal promotions aligned with peak travel times for key origin markets.
Nearby Short-Term Rental Market Comparison
How does the Roggel Airbnb market stack up against its neighbors? Compare key performance metrics like average monthly revenue, ADR, and occupancy rates in surrounding areas to understand the broader regional STR landscape.
| Market | Active Properties | Monthly Revenue | Daily Rate | Avg. Occupancy |
|---|---|---|---|---|
| Kockengen | 11 | $6,769 | $434.39 | 63% |
| Baarlo | 18 | $5,751 | $321.49 | 61% |
| Bentveld | 13 | $4,833 | $446.35 | 54% |
| Dion | 13 | $4,334 | $258.00 | 58% |
| Aerdenhout | 19 | $3,957 | $654.72 | 49% |
| Halfweg | 17 | $3,801 | $231.77 | 54% |
| Brecht | 10 | $3,697 | $250.45 | 54% |
| Oud Ade | 17 | $3,643 | $278.47 | 54% |
| Zwanenburg | 23 | $3,582 | $232.49 | 64% |
| Incourt | 11 | $3,319 | $293.48 | 41% |