Kralendijk Airbnb Market Analysis 2025: Short Term Rental Data & Vacation Rental Statistics in Netherlands, Netherlands
Is Airbnb profitable in Kralendijk in 2025? Explore comprehensive Airbnb analytics for Kralendijk, Netherlands, Netherlands to uncover income potential. This 2025 STR market report for Kralendijk, based on AirROI data from June 2024 to May 2025, reveals key trends in the market of 374 active listings.
Whether you're considering an Airbnb investment in Kralendijk, optimizing your existing vacation rental, or exploring rental arbitrage opportunities, understanding the Kralendijk Airbnb data is crucial. Leveraging the low regulation environment is key to maximizing your short term rental income potential. Let's dive into the specifics.
Key Kralendijk Airbnb Performance Metrics Overview
Monthly Airbnb Revenue Variations & Income Potential in Kralendijk (2025)
Understanding the monthly revenue variations for Airbnb listings in Kralendijk is key to maximizing your short term rental income potential. Seasonality significantly impacts earnings. Our analysis, based on data from the past 12 months, shows that the peak revenue month for STRs in Kralendijk is typically January, while September often presents the lowest earnings, highlighting opportunities for strategic pricing adjustments during shoulder and low seasons. Explore the typical Airbnb income in Kralendijk across different performance tiers:
- Best-in-class properties (Top 10%) achieve $5,801+ monthly, often utilizing dynamic pricing and superior guest experiences.
- Strong performing properties (Top 25%) earn $3,537 or more, indicating effective management and desirable locations/amenities.
- Typical properties (Median) generate around $2,053 per month, representing the average market performance.
- Entry-level properties (Bottom 25%) see earnings around $1,120, often with potential for optimization.
Average Monthly Airbnb Earnings Trend in Kralendijk
Kralendijk Airbnb Occupancy Rate Trends (2025)
Maximize your bookings by understanding the Kralendijk STR occupancy trends. Seasonal demand shifts significantly influence how often properties are booked. Typically, Februarysees the highest demand (peak season occupancy), while June experiences the lowest (low season). Effective strategies, like adjusting minimum stays or offering promotions, can boost occupancy during slower periods. Here's how different property tiers perform in Kralendijk:
- Best-in-class properties (Top 10%) achieve 78%+ occupancy, indicating high desirability and potentially optimized availability.
- Strong performing properties (Top 25%) maintain 62% or higher occupancy, suggesting good market fit and guest satisfaction.
- Typical properties (Median) have an occupancy rate around 42%.
- Entry-level properties (Bottom 25%) average 25% occupancy, potentially facing higher vacancy.
Average Monthly Occupancy Rate Trend in Kralendijk
Average Daily Rate (ADR) Airbnb Trends in Kralendijk (2025)
Effective short term rental pricing strategy in Kralendijk involves understanding monthly ADR fluctuations. The Average Daily Rate (ADR) for Airbnb in Kralendijk typically peaks in February and dips lowest during September. Leveraging Airbnb dynamic pricing tools or strategies based on this seasonality can significantly boost revenue. Here's a look at the typical nightly rates achieved:
- Best-in-class properties (Top 10%) command rates of $345+ per night, often due to premium features or locations.
- Strong performing properties (Top 25%) achieve nightly rates of $239 or more.
- Typical properties (Median) charge around $161 per night.
- Entry-level properties (Bottom 25%) earn around $108 per night.
Average Daily Rate (ADR) Trend by Month in Kralendijk
Get Live Kralendijk Market Intelligence 👇

Explore Real-time Analytics
Airbnb Seasonality Analysis & Trends in Kralendijk (2025)
Peak Season (January, February, March)
- Revenue averages $4,845 per month
- Occupancy rates average 68.0%
- Daily rates average $246
Shoulder Season
- Revenue averages $2,518 per month
- Occupancy maintains around 39.6%
- Daily rates hold near $213
Low Season (June, August, September)
- Revenue drops to average $1,673 per month
- Occupancy decreases to average 27.7%
- Daily rates adjust to average $198
Seasonality Insights for Kralendijk
- The Airbnb seasonality in Kralendijk shows highly seasonal trends requiring careful strategy. While the sections above show seasonal averages, it's also insightful to look at the extremes:
- During the high season, the absolute peak month showcases Kralendijk's highest earning potential, with monthly revenues capable of climbing to $4,972, occupancy reaching a high of 72.4%, and ADRs peaking at $251.
- Conversely, the slowest single month of the year, typically falling within the low season, marks the market's lowest point. In this month, revenue might dip to $1,610, occupancy could drop to 26.4%, and ADRs may adjust down to $197.
- Understanding both the seasonal averages and these monthly peaks and troughs in revenue, occupancy, and ADR is crucial for maximizing your Airbnb profit potential in Kralendijk.
Seasonal Strategies for Maximizing Profit
- Peak Season: Maximize revenue through premium pricing and potentially longer minimum stays. Ensure high availability.
- Low Season: Offer competitive pricing, special promotions (e.g., extended stay discounts), and flexible cancellation policies. Target off-season travelers like remote workers or budget-conscious guests.
- Shoulder Seasons: Implement dynamic pricing that balances peak and low rates. Target weekend travelers or specific events. Offer slightly more flexible terms than peak season.
- Regularly analyze your own performance against these Kralendijk seasonality benchmarks and adjust your pricing and availability strategy accordingly.
Best Areas for Airbnb Investment in Kralendijk (2025)
Exploring the top neighborhoods for short-term rentals in Kralendijk? This section highlights key areas, outlining why they are attractive for hosts and guests, along with notable local attractions. Consider these locations based on your target guest profile and investment strategy.
| Neighborhood / Area | Why Host Here? (Target Guests & Appeal) | Key Attractions & Landmarks |
|---|---|---|
| Kralendijk City Center | The bustling heart of Kralendijk with restaurants, shops, and beautiful waterfront views. It's an ideal spot for tourists who want easy access to local culture and amenities. | Fort Oranje, Plaza Grande, Kralendijk Harbor, local eateries, Bonaire Arts and Crafts Market |
| Donger | A picturesque area with charming streets and colonial architecture, attracting those interested in history and local culture. | Kralendijk's St. Bernard Church, Bonaire Museum, nearby beaches, local cafes |
| Angel City | Known for its tranquil environment and proximity to the ocean, a popular choice for those seeking a quiet beach retreat. | Dive sites, water sports, casual beachfront restaurants, stunning sunsets |
| Sorobon Beach | This area is famous for its beautiful beach and water sports activities, making it a hotspot for tourists and water enthusiasts. | Kite surfing, Snorkeling spots, Beach bars, Relaxing beach cabins |
| Playa Lechi | A prime beachfront area known for its stunning views and casual vibe, suitable for families and solo travelers. | Beach access, Water activities, Snorkeling, Nearby restaurants |
| Bonaire Marine Park | An eco-tourism hot spot offering world-class diving and snorkeling, attracting nature lovers and underwater adventurers. | Diving spots, Marine life, Guided tours, Nature trails |
| Kralendijk Waterfront | A scenic area perfect for leisurely walks along the waterfront, dining, and enjoying the breathtaking views of the Caribbean Sea. | Dining options, Sunset views, Local art displays, Marina |
| Donkey Sanctuary | A unique attraction that combines nature with animal welfare, making it appealing for families and animal lovers. | Guided tours, Interaction with donkeys, Nature walks |
Understanding Airbnb License Requirements & STR Laws in Kralendijk (2025)
While Kralendijk, Netherlands, Netherlands currently shows low STR regulations, specific Airbnb license requirements might still exist or change. Always verify the latest short term rental regulations and Airbnb license requirements directly with local government authorities for Kralendijk to ensure full compliance before hosting.
(Source: AirROI data, 2025, based on 9% licensed listings)
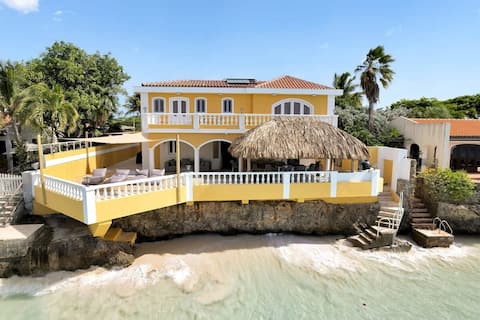
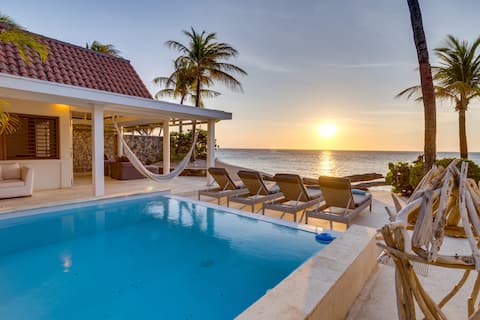
Top Performing Airbnb Properties in Kralendijk (2025)
Benchmark your potential! Explore examples of top-performing Airbnb properties in Kralendijkbased on Trailing Twelve Month (TTM) revenue. Analyze their characteristics, revenue, occupancy rate, and ADR to understand what drives success in this market.

Nirvana Lodge with Private Pool and House Reef
Entire Place • 6 bedrooms

Excellent Oceanfront vacation villa on Bonaire
Entire Place • 5 bedrooms
Casa Mar Azul with Beach and House Reef for Divers
Entire Place • 6 bedrooms

Casa Corazón Oceanfront with its Own House Reef
Entire Place • 3 bedrooms
Luxe leven in Kas Popchi
Entire Place • 4 bedrooms

Villa Dos Hermanos
Entire Place • 4 bedrooms
Note: Performance varies based on location, size, amenities, seasonality, and management quality. Data reflects the past 12 months.
Top Performing Airbnb Hosts in Kralendijk (2025)
Learn from the best! This table showcases top-performing Airbnb hosts in Kralendijk based on the number of properties managed and estimated total revenue over the past year. Analyze their scale and performance metrics.
| Host Name | Properties | Grossing Revenue | Stay Reviews | Avg Rating |
|---|---|---|---|---|
| Host #94776717 | 58 | $1,742,422 | 141 | 4.79/5.0 |
| Host #115305339 | 16 | $569,423 | 158 | 4.81/5.0 |
| Host #10351920 | 12 | $341,422 | 103 | 4.97/5.0 |
| Host #223829407 | 12 | $341,032 | 101 | 4.86/5.0 |
| Host #85873272 | 1 | $188,997 | 19 | 5.00/5.0 |
| Host #411204195 | 41 | $184,743 | 18 | 4.67/5.0 |
| Host #394418152 | 5 | $183,905 | 48 | 4.88/5.0 |
| Host #46364554 | 2 | $180,253 | 83 | 4.98/5.0 |
| Host #292751328 | 2 | $147,907 | 39 | 4.92/5.0 |
| Host #188707211 | 2 | $143,802 | 93 | 4.95/5.0 |
Analyzing the strategies of top hosts, such as their property selection, pricing, and guest communication, can offer valuable lessons for optimizing your own Airbnb operations in Kralendijk.
Dive Deeper: Advanced Kralendijk STR Market Data (2025)
Ready to unlock more insights? AirROI provides access to advanced metrics and comprehensive Airbnb data for Kralendijk. Explore detailed analytics beyond this report to refine your investment strategy, optimize pricing, and maximize your vacation rental profits.
Explore Advanced MetricsKralendijk Short-Term Rental Market Composition (2025): Property & Room Types
Room Type Distribution
Property Type Distribution
Market Composition Insights for Kralendijk
- The Kralendijk Airbnb market composition is heavily skewed towards Entire Home/Apt listings, which make up 93.3% of the 374 active rentals. This indicates strong guest preference for privacy and space.
- Looking at the property type distribution in Kralendijk, Apartment/Condo properties are the most common (65.8%), reflecting the local real estate landscape.
- Houses represent a significant 27.3% portion, catering likely to families or larger groups.
- The presence of 5.6% Hotel/Boutique listings indicates integration with traditional hospitality.
- Smaller segments like outdoor/unique, unique stays (combined 1.4%) offer potential for unique stay experiences.
Kralendijk Airbnb Room Capacity Analysis (2025): Bedroom Distribution
Distribution of Listings by Number of Bedrooms
Room Capacity Insights for Kralendijk
- The dominant room capacity in Kralendijk is 1 bedroom listings, making up 43.9% of the market. This suggests a strong demand for properties suitable for couples or solo travelers.
- Together, 1 bedroom and 2 bedrooms properties represent 79.2% of the active Airbnb listings in Kralendijk, indicating a high concentration in these sizes.
- A significant 20.8% of listings offer 3+ bedrooms, catering to larger groups and families seeking more space in Kralendijk.
Kralendijk Vacation Rental Guest Capacity Trends (2025)
Distribution of Listings by Guest Capacity
Guest Capacity Insights for Kralendijk
- The most common guest capacity trend in Kralendijk vacation rentals is listings accommodating 2 guests (40.6%). This suggests the primary traveler segment is likely couples or solo travelers.
- Properties designed for 2 guests and 4 guests dominate the Kralendijk STR market, accounting for 77.2% of listings.
- A significant 40.6% of listings cater specifically to 1-2 guests, highlighting strong demand from couples and solo travelers in Kralendijk.
- 19.8% of properties accommodate 6+ guests, serving the market segment for larger families or group travel in Kralendijk.
- On average, properties in Kralendijk are equipped to host 3.7 guests.
Kralendijk Airbnb Booking Patterns (2025): Available vs. Booked Days
Available Days Distribution
Booked Days Distribution
Booking Pattern Insights for Kralendijk
- The most common availability pattern in Kralendijk falls within the 271-366 days range, representing 52.4% of listings. This suggests many properties have significant open periods on their calendars.
- Approximately 80.2% of listings show high availability (181+ days open annually), indicating potential for increased bookings or specific owner usage patterns.
- For booked days, the 1-30 days range is most frequent in Kralendijk (29.7%), reflecting common guest stay durations or potential owner blocking patterns.
- A notable 21.1% of properties secure long booking periods (181+ days booked per year), highlighting successful long-term rental strategies or significant owner usage.
Kralendijk Airbnb Minimum Stay Requirements Analysis
Distribution of Listings by Minimum Night Requirement
1 Night
9 listings
2.5% of total
2 Nights
12 listings
3.4% of total
3 Nights
24 listings
6.8% of total
4-6 Nights
197 listings
55.5% of total
7-29 Nights
40 listings
11.3% of total
30+ Nights
73 listings
20.6% of total
Key Insights
- The most prevalent minimum stay requirement in Kralendijk is 4-6 Nights, adopted by 55.5% of listings. This highlights the market's preference for longer commitments.
- Very short stays (1-2 nights) are less common (5.9%), suggesting hosts prefer slightly longer bookings to optimize turnover.
- A significant segment (20.6%) caters to monthly stays (30+ nights) in Kralendijk, pointing to opportunities in the extended-stay market.
Recommendations
- Align with the market by considering a 4-6 Nights minimum stay, as 55.5% of Kralendijk hosts use this setting.
- If feasible, allowing 1-night stays, especially midweek or during low season, could capture last-minute bookings, as only 2.5% currently do.
- Explore offering discounts for stays of 30+ nights to attract the 20.6% of the market seeking extended stays.
- Adjust minimum nights based on seasonality – potentially shorter during low season and longer during peak demand periods in Kralendijk.
Kralendijk Airbnb Cancellation Policy Trends Analysis (2025)
Super Strict 30 Days
1 listings
0.7% of total
Super Strict 60 Days
27 listings
17.8% of total
Flexible
22 listings
14.5% of total
Moderate
26 listings
17.1% of total
Firm
28 listings
18.4% of total
Strict
48 listings
31.6% of total
Cancellation Policy Insights for Kralendijk
- The prevailing Airbnb cancellation policy trend in Kralendijk is Strict, used by 31.6% of listings.
- There's a relatively balanced mix between guest-friendly (31.6%) and stricter (50.0%) policies, offering choices for different guest needs.
Recommendations for Hosts
- Consider adopting a Strict policy to align with the 31.6% market standard in Kralendijk.
- With 31.6% using Strict terms, this is a viable option in Kralendijk, particularly for high-value properties or during peak demand periods.
- Regularly review your cancellation policy against competitors and market demand shifts in Kralendijk.
Kralendijk STR Booking Lead Time Analysis (2025)
Average Booking Lead Time by Month
Booking Lead Time Insights for Kralendijk
- The overall average booking lead time for vacation rentals in Kralendijk is 80 days.
- Guests book furthest in advance for stays during January (average 130 days), likely coinciding with peak travel demand or local events.
- The shortest booking windows occur for stays in July (average 51 days), indicating more last-minute travel plans during this time.
- Seasonally, Winter (124 days avg.) sees the longest lead times, while Summer (66 days avg.) has the shortest, reflecting typical travel planning cycles.
Recommendations for Hosts
- Use the overall average lead time (80 days) as a baseline for your pricing and availability strategy in Kralendijk.
- For January stays, consider implementing length-of-stay discounts or slightly higher rates for bookings made less than 130 days out to capitalize on advance planning.
- Target marketing efforts for the Winter season well in advance (at least 124 days) to capture early planners.
- Monitor your own booking lead times against these Kralendijk averages to identify opportunities for dynamic pricing adjustments.
Popular & Essential Airbnb Amenities in Kralendijk (2025)
Amenity Prevalence
No amenities with partial availability (less than 100%) were found to display in the chart. All essential amenities might be present in all listings. Check insights below.
Amenity Insights for Kralendijk
- Essential amenities in Kralendijk that guests expect include: Kitchen, Wifi, Air conditioning, Essentials, Carbon monoxide alarm, Heating, Washer, Dryer, TV, Smoke alarm. Lacking these (any) could significantly impact bookings.
Recommendations for Hosts
- Ensure your listing includes all essential amenities for Kralendijk: Kitchen, Wifi, Air conditioning, Essentials, Carbon monoxide alarm, Heating, Washer, Dryer, TV, Smoke alarm.
- Highlight unique or less common amenities you offer (e.g., hot tub, dedicated workspace, EV charger) in your listing description and photos.
- Regularly check competitor amenities in Kralendijk to stay competitive.
Kralendijk Airbnb Guest Demographics & Profile Analysis (2025)
Guest Profile Summary for Kralendijk
- The typical guest profile for Airbnb in Kralendijk consists of predominantly international visitors (81%), with top international origins including Netherlands, typically belonging to the Post-2000s (Gen Z/Alpha) group (50%), primarily speaking English or Spanish.
- Domestic travelers account for 19.0% of guests.
- Key international markets include United States (52.8%) and Netherlands (19%).
- Top languages spoken are English (49.2%) followed by Spanish (13%).
- A significant demographic segment is the Post-2000s (Gen Z/Alpha) group, representing 50% of guests.
Recommendations for Hosts
- Focus marketing internationally, particularly towards travelers from Netherlands.
- Tailor amenities and listing descriptions to appeal to the dominant Post-2000s (Gen Z/Alpha) demographic (e.g., highlight fast WiFi, smart home features, local guides).
- Highlight unique local experiences or amenities relevant to the primary guest profile.
- Consider seasonal promotions aligned with peak travel times for key origin markets.
Nearby Short-Term Rental Market Comparison
How does the Kralendijk Airbnb market stack up against its neighbors? Compare key performance metrics like average monthly revenue, ADR, and occupancy rates in surrounding areas to understand the broader regional STR landscape.
| Market | Active Properties | Monthly Revenue | Daily Rate | Avg. Occupancy |
|---|---|---|---|---|
| Savaneta | 64 | $4,711 | $306.43 | 56% |
| Sint Willibrordus | 51 | $4,621 | $396.15 | 50% |
| San Nicolaas | 53 | $3,984 | $234.34 | 52% |
| Westpunt | 10 | $3,983 | $245.06 | 47% |
| Jan Kok | 12 | $3,163 | $337.08 | 42% |
| Jan Thiel | 320 | $3,013 | $268.32 | 47% |
| Sint Michiel | 182 | $2,765 | $220.04 | 50% |
| Piedra Plat | 26 | $2,694 | $170.18 | 57% |
| Bonaire | 137 | $2,513 | $296.44 | 45% |
| Pos Chikito | 84 | $2,335 | $187.60 | 53% |