Alphen aan den Rijn Airbnb Market Analysis 2026: Short Term Rental Data & Vacation Rental Statistics in South Holland, Netherlands
Is Airbnb profitable in Alphen aan den Rijn in 2026? Explore comprehensive Airbnb analytics for Alphen aan den Rijn, South Holland, Netherlands to uncover income potential. This 2026 STR market report for Alphen aan den Rijn, based on AirROI data from February 2025 to January 2026, reveals key trends in the niche market of 23 active listings.
Whether you're considering an Airbnb investment in Alphen aan den Rijn, optimizing your existing vacation rental, or exploring rental arbitrage opportunities, understanding the Alphen aan den Rijn Airbnb data is crucial. Leveraging the low regulation environment is key to maximizing your short term rental income potential. Let's dive into the specifics.
Key Alphen aan den Rijn Airbnb Performance Metrics Overview
Monthly Airbnb Revenue Variations & Income Potential in Alphen aan den Rijn (2026)
Understanding the monthly revenue variations for Airbnb listings in Alphen aan den Rijn is key to maximizing your short term rental income potential. Seasonality significantly impacts earnings. Our analysis, based on data from the past 12 months, shows that the peak revenue month for STRs in Alphen aan den Rijn is typically August, while January often presents the lowest earnings, highlighting opportunities for strategic pricing adjustments during shoulder and low seasons. Explore the typical Airbnb income in Alphen aan den Rijn across different performance tiers:
- Best-in-class properties (Top 10%) achieve $4,106+ monthly, often utilizing dynamic pricing and superior guest experiences.
- Strong performing properties (Top 25%) earn $3,203 or more, indicating effective management and desirable locations/amenities.
- Typical properties (Median) generate around $2,119 per month, representing the average market performance.
- Entry-level properties (Bottom 25%) see earnings around $1,430, often with potential for optimization.
Average Monthly Airbnb Earnings Trend in Alphen aan den Rijn
Alphen aan den Rijn Airbnb Occupancy Rate Trends (2026)
Maximize your bookings by understanding the Alphen aan den Rijn STR occupancy trends. Seasonal demand shifts significantly influence how often properties are booked. Typically, Augustsees the highest demand (peak season occupancy), while January experiences the lowest (low season). Effective strategies, like adjusting minimum stays or offering promotions, can boost occupancy during slower periods. Here's how different property tiers perform in Alphen aan den Rijn:
- Best-in-class properties (Top 10%) achieve 87%+ occupancy, indicating high desirability and potentially optimized availability.
- Strong performing properties (Top 25%) maintain 76% or higher occupancy, suggesting good market fit and guest satisfaction.
- Typical properties (Median) have an occupancy rate around 64%.
- Entry-level properties (Bottom 25%) average 47% occupancy, potentially facing higher vacancy.
Average Monthly Occupancy Rate Trend in Alphen aan den Rijn
Average Daily Rate (ADR) Airbnb Trends in Alphen aan den Rijn (2026)
Effective short term rental pricing strategy in Alphen aan den Rijn involves understanding monthly ADR fluctuations. The Average Daily Rate (ADR) for Airbnb in Alphen aan den Rijn typically peaks in July and dips lowest during March. Leveraging Airbnb dynamic pricing tools or strategies based on this seasonality can significantly boost revenue. Here's a look at the typical nightly rates achieved:
- Best-in-class properties (Top 10%) command rates of $187+ per night, often due to premium features or locations.
- Strong performing properties (Top 25%) achieve nightly rates of $159 or more.
- Typical properties (Median) charge around $129 per night.
- Entry-level properties (Bottom 25%) earn around $90 per night.
Average Daily Rate (ADR) Trend by Month in Alphen aan den Rijn
Get Live Alphen aan den Rijn Market Intelligence 👇

Explore Real-time Analytics
Airbnb Seasonality Analysis & Trends in Alphen aan den Rijn (2026)
Peak Season (August, October, September)
- Revenue averages $3,004 per month
- Occupancy rates average 72.7%
- Daily rates average $137
Shoulder Season
- Revenue averages $2,433 per month
- Occupancy maintains around 61.9%
- Daily rates hold near $133
Low Season (January, February, March)
- Revenue drops to average $1,569 per month
- Occupancy decreases to average 42.6%
- Daily rates adjust to average $126
Seasonality Insights for Alphen aan den Rijn
- The Airbnb seasonality in Alphen aan den Rijn shows highly seasonal trends requiring careful strategy. While the sections above show seasonal averages, it's also insightful to look at the extremes:
- During the high season, the absolute peak month showcases Alphen aan den Rijn's highest earning potential, with monthly revenues capable of climbing to $3,239, occupancy reaching a high of 80.0%, and ADRs peaking at $139.
- Conversely, the slowest single month of the year, typically falling within the low season, marks the market's lowest point. In this month, revenue might dip to $1,085, occupancy could drop to 26.1%, and ADRs may adjust down to $123.
- Understanding both the seasonal averages and these monthly peaks and troughs in revenue, occupancy, and ADR is crucial for maximizing your Airbnb profit potential in Alphen aan den Rijn.
Seasonal Strategies for Maximizing Profit
- Peak Season: Maximize revenue through premium pricing and potentially longer minimum stays. Ensure high availability.
- Low Season: Offer competitive pricing, special promotions (e.g., extended stay discounts), and flexible cancellation policies. Target off-season travelers like remote workers or budget-conscious guests.
- Shoulder Seasons: Implement dynamic pricing that balances peak and low rates. Target weekend travelers or specific events. Offer slightly more flexible terms than peak season.
- Regularly analyze your own performance against these Alphen aan den Rijn seasonality benchmarks and adjust your pricing and availability strategy accordingly.
Best Areas for Airbnb Investment in Alphen aan den Rijn (2026)
Exploring the top neighborhoods for short-term rentals in Alphen aan den Rijn? This section highlights key areas, outlining why they are attractive for hosts and guests, along with notable local attractions. Consider these locations based on your target guest profile and investment strategy.
| Neighborhood / Area | Why Host Here? (Target Guests & Appeal) | Key Attractions & Landmarks |
|---|---|---|
| Centrum | The city center of Alphen aan den Rijn offers a vibrant atmosphere with shopping, dining, and entertainment options. It is easily accessible and attracts both tourists and business travelers. | Alphen Arena, The Bospark, Shopping Center de Baronie, Museum of the History of Science, Alphen aan den Rijn Canal Walk |
| Zegveld | Zegveld is known for its picturesque countryside and tranquility, making it ideal for guests looking for a relaxing getaway. Close proximity to nature and outdoor activities adds to its charm. | Zegveld Windmill, Buitenhof Zegveld, Diverse cycling routes, Nature reserves, Local farms and produce |
| Boskoop | Famous for its horticulture and nurseries, Boskoop attracts visitors interested in gardening and nature. It provides a unique rural experience within reach of urban amenities. | The Royal Boskoop Horticultural Society, Local garden centers, Cycle paths through flower fields, Boskoopse Bos, Nature parks |
| Koudekerk aan den Rijn | A peaceful village located near Alphen, offering a slice of Dutch rural life and is attractive for visitors wanting to escape the hustle and bustle of the city. | Historic churches, Local festivals, River adventures, Scenic walking paths, Traditional markets |
| Noordeinde | A small village near Alphen that provides a cozy atmosphere and access to surrounding nature. A great spot for those interested in quiet living and interactions with local culture. | Historical buildings, Local art, Nature trails, Community events, River excursions |
| Rijnwoude | With its natural landscapes and proximity to waterways, Rijnwoude is ideal for nature lovers and provides opportunities for various outdoor activities. | Recreational areas, Birdwatching spots, Kayaking on the river, Cycling routes, Fishing opportunities |
| Alphen Zuid | This residential area near the southern part of Alphen offers a suburban living experience with easy access to the city center and nearby parks. | Local playgrounds, Alphen parks, Cultural events, Community services, Convenient transportation access |
| Oude Wetering | A charming gem near Alphen known for its water channels and rural vibe, perfect for those looking for a unique holiday experience away from the city. | Picturesque waterside views, Local eateries, Boat rentals, Beautiful walking paths, Artisan shops |
Understanding Airbnb License Requirements & STR Laws in Alphen aan den Rijn (2026)
While Alphen aan den Rijn, South Holland, Netherlands currently shows low STR regulations, specific Airbnb license requirements might still exist or change. Always verify the latest short term rental regulations and Airbnb license requirements directly with local government authorities for Alphen aan den Rijn to ensure full compliance before hosting.
(Source: AirROI data, 2026, finding no licensed listings among those analyzed)
Top Performing Airbnb Properties in Alphen aan den Rijn (2026)
Benchmark your potential! Explore examples of top-performing Airbnb properties in Alphen aan den Rijnbased on Trailing Twelve Month (TTM) revenue. Analyze their characteristics, revenue, occupancy rate, and ADR to understand what drives success in this market.
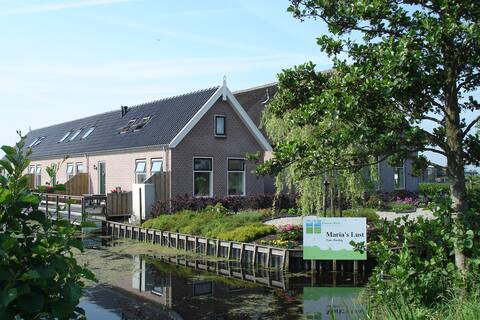
Rural holiday home. Unique location.
Entire Place • 2 bedrooms

Vacation home overlooking the meadows.
Entire Place • 2 bedrooms

Comfortable vacation home in the countryside
Entire Place • 2 bedrooms
Bedandbreakfast_Break18 Tinyhouse!
Entire Place • 1 bedroom

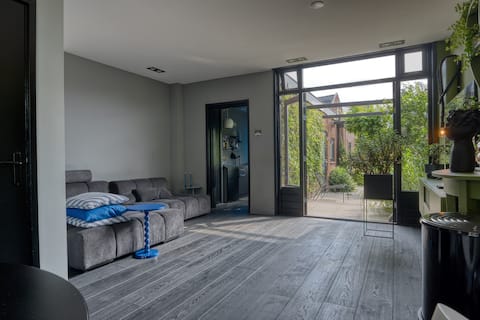
Luxurious residence along the Old Rijn
Entire Place • 2 bedrooms
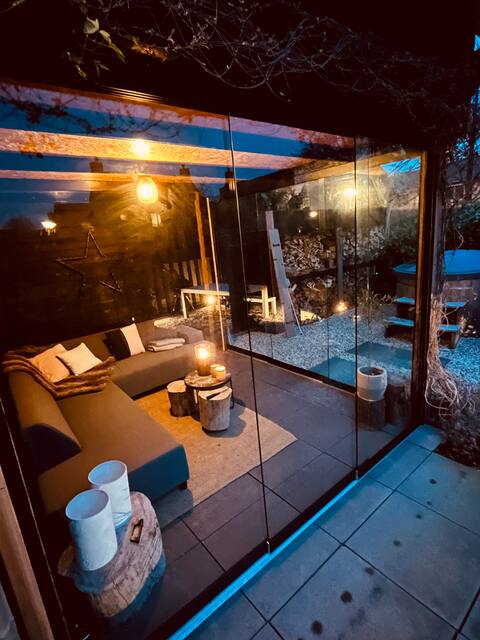
Special town house with a modern private garden.
Entire Place • 1 bedroom
Note: Performance varies based on location, size, amenities, seasonality, and management quality. Data reflects the past 12 months.
Top Performing Airbnb Hosts in Alphen aan den Rijn (2026)
Learn from the best! This table showcases top-performing Airbnb hosts in Alphen aan den Rijn based on the number of properties managed and estimated total revenue over the past year. Analyze their scale and performance metrics.
| Host Name | Properties | Grossing Revenue | Stay Reviews | Avg Rating |
|---|---|---|---|---|
| Petra | 3 | $123,004 | 201 | 4.90/5.0 |
| Madelon | 1 | $37,167 | 104 | 4.96/5.0 |
| Marvin | 1 | $35,122 | 27 | 5.00/5.0 |
| Yvette | 1 | $31,479 | 40 | 4.95/5.0 |
| Kees | 1 | $27,854 | 95 | 4.94/5.0 |
| Christa | 1 | $27,179 | 51 | 4.86/5.0 |
| Irma | 1 | $26,722 | 213 | 4.91/5.0 |
| Iris | 1 | $20,993 | 107 | 4.96/5.0 |
| Jan Vic | 1 | $20,916 | 158 | 4.66/5.0 |
| Kevin | 1 | $19,777 | 35 | 4.94/5.0 |
Analyzing the strategies of top hosts, such as their property selection, pricing, and guest communication, can offer valuable lessons for optimizing your own Airbnb operations in Alphen aan den Rijn.
Dive Deeper: Advanced Alphen aan den Rijn STR Market Data (2026)
Ready to unlock more insights? AirROI provides access to advanced metrics and comprehensive Airbnb data for Alphen aan den Rijn. Explore detailed analytics beyond this report to refine your investment strategy, optimize pricing, and maximize your vacation rental profits.
Explore Advanced MetricsAlphen aan den Rijn Short-Term Rental Market Composition (2026): Property & Room Types
Room Type Distribution
Property Type Distribution
Market Composition Insights for Alphen aan den Rijn
- The Alphen aan den Rijn Airbnb market composition is heavily skewed towards Entire Home/Apt listings, which make up 82.6% of the 23 active rentals. This indicates strong guest preference for privacy and space.
- Looking at the property type distribution in Alphen aan den Rijn, House properties are the most common (52.2%), reflecting the local real estate landscape.
- Houses represent a significant 52.2% portion, catering likely to families or larger groups.
- Smaller segments like others (combined 4.3%) offer potential for unique stay experiences.
Alphen aan den Rijn Airbnb Room Capacity Analysis (2026): Bedroom Distribution
Distribution of Listings by Number of Bedrooms
Room Capacity Insights for Alphen aan den Rijn
- The dominant room capacity in Alphen aan den Rijn is 1 bedroom listings, making up 39.1% of the market. This suggests a strong demand for properties suitable for couples or solo travelers.
- Together, 1 bedroom and 2 bedrooms properties represent 69.5% of the active Airbnb listings in Alphen aan den Rijn, indicating a high concentration in these sizes.
Alphen aan den Rijn Vacation Rental Guest Capacity Trends (2026)
Distribution of Listings by Guest Capacity
Guest Capacity Insights for Alphen aan den Rijn
- The most common guest capacity trend in Alphen aan den Rijn vacation rentals is listings accommodating 2 guests (30.4%). This suggests the primary traveler segment is likely couples or solo travelers.
- Properties designed for 2 guests and 4 guests dominate the Alphen aan den Rijn STR market, accounting for 52.1% of listings.
- On average, properties in Alphen aan den Rijn are equipped to host 2.9 guests.
Alphen aan den Rijn Airbnb Booking Patterns (2026): Available vs. Booked Days
Available Days Distribution
Booked Days Distribution
Booking Pattern Insights for Alphen aan den Rijn
- The most common availability pattern in Alphen aan den Rijn falls within the 91-180 days range, representing 60.9% of listings. This suggests many properties have significant open periods on their calendars.
- Approximately 39.1% of listings show high availability (181+ days open annually), indicating potential for increased bookings or specific owner usage patterns.
- For booked days, the 181-270 days range is most frequent in Alphen aan den Rijn (56.5%), reflecting common guest stay durations or potential owner blocking patterns.
- A notable 60.8% of properties secure long booking periods (181+ days booked per year), highlighting successful long-term rental strategies or significant owner usage.
Alphen aan den Rijn Airbnb Minimum Stay Requirements Analysis
Distribution of Listings by Minimum Night Requirement
1 Night
6 listings
26.1% of total
2 Nights
4 listings
17.4% of total
3 Nights
1 listings
4.3% of total
4-6 Nights
1 listings
4.3% of total
7-29 Nights
5 listings
21.7% of total
30+ Nights
6 listings
26.1% of total
Key Insights
- The most prevalent minimum stay requirement in Alphen aan den Rijn is 1 Night, adopted by 26.1% of listings. This highlights the market's preference for shorter, flexible bookings.
- A significant segment (26.1%) caters to monthly stays (30+ nights) in Alphen aan den Rijn, pointing to opportunities in the extended-stay market.
Recommendations
- Align with the market by considering a 1 Night minimum stay, as 26.1% of Alphen aan den Rijn hosts use this setting.
- If feasible, allowing 1-night stays, especially midweek or during low season, could capture last-minute bookings, as only 26.1% currently do.
- Explore offering discounts for stays of 30+ nights to attract the 26.1% of the market seeking extended stays.
- Adjust minimum nights based on seasonality – potentially shorter during low season and longer during peak demand periods in Alphen aan den Rijn.
Alphen aan den Rijn Airbnb Cancellation Policy Trends Analysis (2026)
Flexible
8 listings
34.8% of total
Moderate
11 listings
47.8% of total
Firm
4 listings
17.4% of total
Cancellation Policy Insights for Alphen aan den Rijn
- The prevailing Airbnb cancellation policy trend in Alphen aan den Rijn is Moderate, used by 47.8% of listings.
- The market strongly favors guest-friendly terms, with 82.6% of listings offering Flexible or Moderate policies. This suggests guests in Alphen aan den Rijn may expect booking flexibility.
Recommendations for Hosts
- Consider adopting a Moderate policy to align with the 47.8% market standard in Alphen aan den Rijn.
- Regularly review your cancellation policy against competitors and market demand shifts in Alphen aan den Rijn.
Alphen aan den Rijn STR Booking Lead Time Analysis (2026)
Average Booking Lead Time by Month
Booking Lead Time Insights for Alphen aan den Rijn
- The overall average booking lead time for vacation rentals in Alphen aan den Rijn is 72 days.
- Guests book furthest in advance for stays during August (average 76 days), likely coinciding with peak travel demand or local events.
- The shortest booking windows occur for stays in January (average 24 days), indicating more last-minute travel plans during this time.
- Seasonally, Summer (67 days avg.) sees the longest lead times, while Winter (33 days avg.) has the shortest, reflecting typical travel planning cycles.
Recommendations for Hosts
- Use the overall average lead time (72 days) as a baseline for your pricing and availability strategy in Alphen aan den Rijn.
- Target marketing efforts for the Summer season well in advance (at least 67 days) to capture early planners.
- Monitor your own booking lead times against these Alphen aan den Rijn averages to identify opportunities for dynamic pricing adjustments.
Popular & Essential Airbnb Amenities in Alphen aan den Rijn (2026)
Amenity Prevalence
Amenity Insights for Alphen aan den Rijn
- Essential amenities in Alphen aan den Rijn that guests expect include: Heating, Wifi, Bed linens. Lacking these (any) could significantly impact bookings.
- Popular amenities like Hot water, Coffee maker, Smoke alarm are common but not universal. Offering these can provide a competitive edge.
Recommendations for Hosts
- Ensure your listing includes all essential amenities for Alphen aan den Rijn: Heating, Wifi, Bed linens.
- Prioritize adding missing essentials: Bed linens.
- Consider adding popular differentiators like Hot water or Coffee maker to increase appeal.
- Highlight unique or less common amenities you offer (e.g., hot tub, dedicated workspace, EV charger) in your listing description and photos.
- Regularly check competitor amenities in Alphen aan den Rijn to stay competitive.
Alphen aan den Rijn Airbnb Guest Demographics & Profile Analysis (2026)
Guest Profile Summary for Alphen aan den Rijn
- The typical guest profile for Airbnb in Alphen aan den Rijn consists of predominantly international visitors (86%), with top international origins including Germany, typically belonging to the Post-2000s (Gen Z/Alpha) group (50%), primarily speaking English or French.
- Domestic travelers account for 13.9% of guests.
- Key international markets include United Kingdom (17.2%) and Germany (16.6%).
- Top languages spoken are English (41.5%) followed by French (14.2%).
- A significant demographic segment is the Post-2000s (Gen Z/Alpha) group, representing 50% of guests.
Recommendations for Hosts
- Focus marketing internationally, particularly towards travelers from Germany.
- Tailor amenities and listing descriptions to appeal to the dominant Post-2000s (Gen Z/Alpha) demographic (e.g., highlight fast WiFi, smart home features, local guides).
- Highlight unique local experiences or amenities relevant to the primary guest profile.
- Consider seasonal promotions aligned with peak travel times for key origin markets.
Nearby Short-Term Rental Market Comparison
How does the Alphen aan den Rijn Airbnb market stack up against its neighbors? Compare key performance metrics like average monthly revenue, ADR, and occupancy rates in surrounding areas to understand the broader regional STR landscape.
| Market | Active Properties | Monthly Revenue | Daily Rate | Avg. Occupancy |
|---|---|---|---|---|
| Raamsdonksveer | 16 | $7,756 | $736.17 | 38% |
| Kockengen | 11 | $6,027 | $485.77 | 53% |
| Haghorst | 11 | $5,995 | $480.40 | 40% |
| Merksplas | 12 | $5,367 | $356.64 | 43% |
| Zerkegem | 10 | $4,846 | $437.71 | 57% |
| Bentveld | 15 | $4,727 | $517.02 | 50% |
| Zwanenburg | 22 | $4,111 | $255.87 | 61% |
| Wormer | 11 | $3,997 | $226.69 | 59% |
| Roelofarendsveen | 17 | $3,861 | $194.80 | 63% |
| Halfweg | 18 | $3,685 | $237.41 | 54% |