Simonshaven Airbnb Market Analysis 2025: Short Term Rental Data & Vacation Rental Statistics in South Holland, Netherlands
Is Airbnb profitable in Simonshaven in 2025? Explore comprehensive Airbnb analytics for Simonshaven, South Holland, Netherlands to uncover income potential. This 2025 STR market report for Simonshaven, based on AirROI data from October 2024 to September 2025, reveals key trends in the niche market of 18 active listings.
Whether you're considering an Airbnb investment in Simonshaven, optimizing your existing vacation rental, or exploring rental arbitrage opportunities, understanding the Simonshaven Airbnb data is crucial. Understanding the local regulations is key to maximizing your short term rental income potential. Let's dive into the specifics.
Key Simonshaven Airbnb Performance Metrics Overview
Monthly Airbnb Revenue Variations & Income Potential in Simonshaven (2025)
Understanding the monthly revenue variations for Airbnb listings in Simonshaven is key to maximizing your short term rental income potential. Seasonality significantly impacts earnings. Our analysis, based on data from the past 12 months, shows that the peak revenue month for STRs in Simonshaven is typically October, while June often presents the lowest earnings, highlighting opportunities for strategic pricing adjustments during shoulder and low seasons. Explore the typical Airbnb income in Simonshaven across different performance tiers:
- Best-in-class properties (Top 10%) achieve $3,722+ monthly, often utilizing dynamic pricing and superior guest experiences.
- Strong performing properties (Top 25%) earn $1,885 or more, indicating effective management and desirable locations/amenities.
- Typical properties (Median) generate around $964 per month, representing the average market performance.
- Entry-level properties (Bottom 25%) see earnings around $573, often with potential for optimization.
Average Monthly Airbnb Earnings Trend in Simonshaven
Simonshaven Airbnb Occupancy Rate Trends (2025)
Maximize your bookings by understanding the Simonshaven STR occupancy trends. Seasonal demand shifts significantly influence how often properties are booked. Typically, Octobersees the highest demand (peak season occupancy), while June experiences the lowest (low season). Effective strategies, like adjusting minimum stays or offering promotions, can boost occupancy during slower periods. Here's how different property tiers perform in Simonshaven:
- Best-in-class properties (Top 10%) achieve 56%+ occupancy, indicating high desirability and potentially optimized availability.
- Strong performing properties (Top 25%) maintain 31% or higher occupancy, suggesting good market fit and guest satisfaction.
- Typical properties (Median) have an occupancy rate around 17%.
- Entry-level properties (Bottom 25%) average 10% occupancy, potentially facing higher vacancy.
Average Monthly Occupancy Rate Trend in Simonshaven
Average Daily Rate (ADR) Airbnb Trends in Simonshaven (2025)
Effective short term rental pricing strategy in Simonshaven involves understanding monthly ADR fluctuations. The Average Daily Rate (ADR) for Airbnb in Simonshaven typically peaks in August and dips lowest during February. Leveraging Airbnb dynamic pricing tools or strategies based on this seasonality can significantly boost revenue. Here's a look at the typical nightly rates achieved:
- Best-in-class properties (Top 10%) command rates of $216+ per night, often due to premium features or locations.
- Strong performing properties (Top 25%) achieve nightly rates of $196 or more.
- Typical properties (Median) charge around $180 per night.
- Entry-level properties (Bottom 25%) earn around $163 per night.
Average Daily Rate (ADR) Trend by Month in Simonshaven
Get Live Simonshaven Market Intelligence 👇
Explore Real-time Analytics
Airbnb Seasonality Analysis & Trends in Simonshaven (2025)
Peak Season (October, March, November)
- Revenue averages $2,251 per month
- Occupancy rates average 33.2%
- Daily rates average $154
Shoulder Season
- Revenue averages $1,441 per month
- Occupancy maintains around 23.6%
- Daily rates hold near $199
Low Season (February, April, June)
- Revenue drops to average $867 per month
- Occupancy decreases to average 16.7%
- Daily rates adjust to average $172
Seasonality Insights for Simonshaven
- The Airbnb seasonality in Simonshaven shows highly seasonal trends requiring careful strategy. While the sections above show seasonal averages, it's also insightful to look at the extremes:
- During the high season, the absolute peak month showcases Simonshaven's highest earning potential, with monthly revenues capable of climbing to $2,744, occupancy reaching a high of 37.7%, and ADRs peaking at $235.
- Conversely, the slowest single month of the year, typically falling within the low season, marks the market's lowest point. In this month, revenue might dip to $685, occupancy could drop to 11.4%, and ADRs may adjust down to $140.
- Understanding both the seasonal averages and these monthly peaks and troughs in revenue, occupancy, and ADR is crucial for maximizing your Airbnb profit potential in Simonshaven.
Seasonal Strategies for Maximizing Profit
- Peak Season: Maximize revenue through premium pricing and potentially longer minimum stays. Ensure high availability.
- Low Season: Offer competitive pricing, special promotions (e.g., extended stay discounts), and flexible cancellation policies. Target off-season travelers like remote workers or budget-conscious guests.
- Shoulder Seasons: Implement dynamic pricing that balances peak and low rates. Target weekend travelers or specific events. Offer slightly more flexible terms than peak season.
- Regularly analyze your own performance against these Simonshaven seasonality benchmarks and adjust your pricing and availability strategy accordingly.
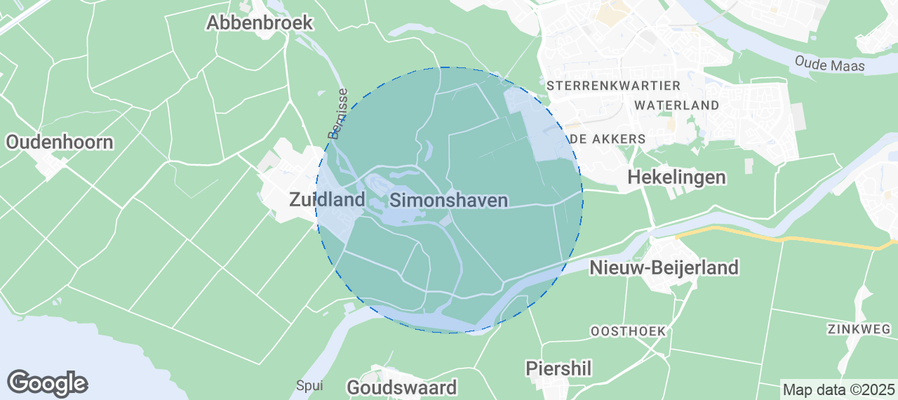
Best Areas for Airbnb Investment in Simonshaven (2025)
Exploring the top neighborhoods for short-term rentals in Simonshaven? This section highlights key areas, outlining why they are attractive for hosts and guests, along with notable local attractions. Consider these locations based on your target guest profile and investment strategy.
| Neighborhood / Area | Why Host Here? (Target Guests & Appeal) | Key Attractions & Landmarks |
|---|---|---|
| Simonshaven Center | Charming village atmosphere with local shops and a close-knit community feel. Ideal for guests looking for a peaceful stay away from the city bustle, while still being close to amenities. | Local cafes, Historic buildings, Community events, Parks, Cycling routes |
| Rotterdam Nearby | Proximity to Rotterdam makes it appealing for those visiting the city for business or leisure. The modern architecture and vibrant city life attract many visitors. | Erasmus Bridge, Markthal Rotterdam, Museum Boijmans Van Beuningen, Rotterdam Zoo, Kunsthal |
| Spijkenisse | Larger neighboring town with more shopping and dining options. Great for travelers looking for a suburban retreat with easy access to Rotterdam and the Port of Rotterdam. | Spijkenisse Shopping Center, Cultural Center, Theater de Stoep, Parks, Local markets |
| Maasvlakte | Unique industrial area close to the Port of Rotterdam, appealing for those visiting the shipping and logistics sectors or attending related conferences. | Port tours, Industrial museums, Logistics expos, Nature reserves nearby |
| Europoort | Another industrial area known for its role in trade and logistics. Ideal for business travelers attending events or meetings in the region. | Business parks, Port-related activities, Transport exhibitions |
| Kleinpolderplein | Family-friendly area with good parks and recreational facilities. Attractive for families on holiday or business travelers with kids. | Playgrounds, Sports fields, Family-friendly restaurants |
| Heinenoord | A quiet residential area with lush greenery, good for guests looking for nature and tranquility while being a short distance from urban amenities. | Nature trails, Lakes, Local wildlife |
| Hellevoetsluis | Historic town with a beautiful harbor and beaches. Ideal for tourists looking for a seaside experience without being far from Rotterdam. | Hellevoetsluis Harbor, Beaches, Historic forts, Museums |
Understanding Airbnb License Requirements & STR Laws in Simonshaven (2025)
With 17% of listings showing registration in 2025, understanding potential Airbnb license requirements is crucial in Simonshaven. Always verify the latest short term rental regulations and Airbnb license requirements directly with local government authorities for Simonshaven to ensure full compliance before hosting.
(Source: AirROI data, 2025, based on 17% licensed listings)
Top Performing Airbnb Properties in Simonshaven (2025)
Benchmark your potential! Explore examples of top-performing Airbnb properties in Simonshavenbased on Trailing Twelve Month (TTM) revenue. Analyze their characteristics, revenue, occupancy rate, and ADR to understand what drives success in this market.
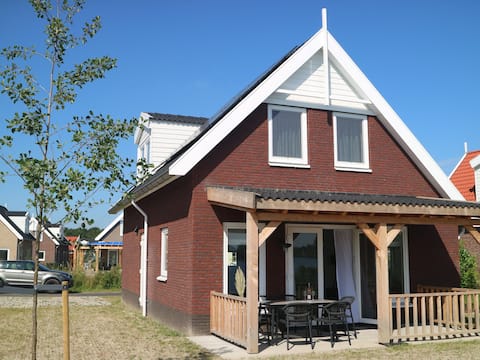
Lakeview villa with swimming and fishing pier
Entire Place • 3 bedrooms
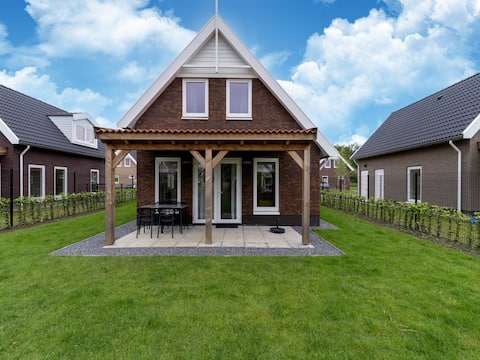
Holiday Home in South Holland by Stompaarde Plas
Entire Place • 2 bedrooms
Holiday Home in Simonshaven near Lake Beach
Entire Place • 2 bedrooms
Lakeside Haven in Simonshaven
Entire Place • 2 bedrooms
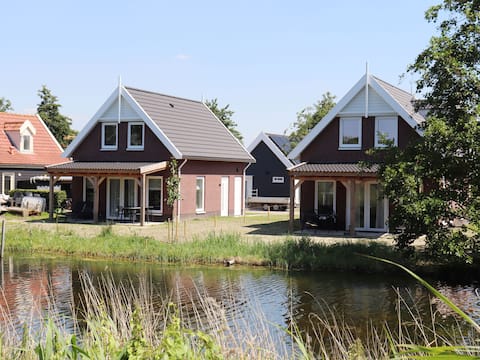
Bungalow in South Holland with Private Jetty
Entire Place • 3 bedrooms
Holiday home with lots of privacy
Entire Place • 3 bedrooms
Note: Performance varies based on location, size, amenities, seasonality, and management quality. Data reflects the past 12 months.
Top Performing Airbnb Hosts in Simonshaven (2025)
Learn from the best! This table showcases top-performing Airbnb hosts in Simonshaven based on the number of properties managed and estimated total revenue over the past year. Analyze their scale and performance metrics.
| Host Name | Properties | Grossing Revenue | Stay Reviews | Avg Rating |
|---|---|---|---|---|
| Tamara - BELVILLA | 17 | $108,650 | 64 | 4.75/5.0 |
| Lesley | 1 | $2,543 | 39 | 4.85/5.0 |
Analyzing the strategies of top hosts, such as their property selection, pricing, and guest communication, can offer valuable lessons for optimizing your own Airbnb operations in Simonshaven.
Dive Deeper: Advanced Simonshaven STR Market Data (2025)
Ready to unlock more insights? AirROI provides access to advanced metrics and comprehensive Airbnb data for Simonshaven. Explore detailed analytics beyond this report to refine your investment strategy, optimize pricing, and maximize your vacation rental profits.
Explore Advanced MetricsSimonshaven Short-Term Rental Market Composition (2025): Property & Room Types
Room Type Distribution
Property Type Distribution
Market Composition Insights for Simonshaven
- The Simonshaven Airbnb market composition is heavily skewed towards Entire Home/Apt listings, which make up 94.4% of the 18 active rentals. This indicates strong guest preference for privacy and space.
- Looking at the property type distribution in Simonshaven, House properties are the most common (100%), reflecting the local real estate landscape.
- Houses represent a significant 100% portion, catering likely to families or larger groups.
Simonshaven Airbnb Room Capacity Analysis (2025): Bedroom Distribution
Distribution of Listings by Number of Bedrooms
Room Capacity Insights for Simonshaven
- The dominant room capacity in Simonshaven is 3 bedrooms listings, making up 66.7% of the market. This suggests a strong demand for properties suitable for families or small groups.
- Together, 3 bedrooms and 2 bedrooms properties represent 94.5% of the active Airbnb listings in Simonshaven, indicating a high concentration in these sizes.
- A significant 66.7% of listings offer 3+ bedrooms, catering to larger groups and families seeking more space in Simonshaven.
Simonshaven Vacation Rental Guest Capacity Trends (2025)
Distribution of Listings by Guest Capacity
Guest Capacity Insights for Simonshaven
- The most common guest capacity trend in Simonshaven vacation rentals is listings accommodating 6 guests (66.7%). This suggests the primary traveler segment is likely larger groups.
- Properties designed for 6 guests and 4 guests dominate the Simonshaven STR market, accounting for 94.5% of listings.
- 66.7% of properties accommodate 6+ guests, serving the market segment for larger families or group travel in Simonshaven.
- On average, properties in Simonshaven are equipped to host 5.1 guests.
Simonshaven Airbnb Booking Patterns (2025): Available vs. Booked Days
Available Days Distribution
Booked Days Distribution
Booking Pattern Insights for Simonshaven
- The most common availability pattern in Simonshaven falls within the 271-366 days range, representing 94.4% of listings. This suggests many properties have significant open periods on their calendars.
- Approximately 100.0% of listings show high availability (181+ days open annually), indicating potential for increased bookings or specific owner usage patterns.
- For booked days, the 1-30 days range is most frequent in Simonshaven (66.7%), reflecting common guest stay durations or potential owner blocking patterns.
Simonshaven Airbnb Minimum Stay Requirements Analysis
Distribution of Listings by Minimum Night Requirement
1 Night
17 listings
94.4% of total
4-6 Nights
1 listings
5.6% of total
Key Insights
- The most prevalent minimum stay requirement in Simonshaven is 1 Night, adopted by 94.4% of listings. This highlights the market's preference for shorter, flexible bookings.
- A strong majority (94.4%) of the Simonshaven Airbnb data shows acceptance of very short stays (1-2 nights), indicating a dynamic, high-turnover market.
Recommendations
- Align with the market by considering a 1 Night minimum stay, as 94.4% of Simonshaven hosts use this setting.
- Adjust minimum nights based on seasonality – potentially shorter during low season and longer during peak demand periods in Simonshaven.
Simonshaven Airbnb Cancellation Policy Trends Analysis (2025)
Moderate
1 listings
5.9% of total
Firm
13 listings
76.5% of total
Strict
3 listings
17.6% of total
Cancellation Policy Insights for Simonshaven
- The prevailing Airbnb cancellation policy trend in Simonshaven is Firm, used by 76.5% of listings.
- A majority (94.1%) of hosts in Simonshaven utilize Firm or Strict policies, indicating a market where hosts prioritize booking security.
Recommendations for Hosts
- Consider adopting a Firm policy to align with the 76.5% market standard in Simonshaven.
- Regularly review your cancellation policy against competitors and market demand shifts in Simonshaven.
Simonshaven STR Booking Lead Time Analysis (2025)
Average Booking Lead Time by Month
Booking Lead Time Insights for Simonshaven
- The overall average booking lead time for vacation rentals in Simonshaven is 38 days.
- Guests book furthest in advance for stays during May (average 72 days), likely coinciding with peak travel demand or local events.
- The shortest booking windows occur for stays in October (average 8 days), indicating more last-minute travel plans during this time.
- Seasonally, Summer (48 days avg.) sees the longest lead times, while Winter (28 days avg.) has the shortest, reflecting typical travel planning cycles.
Recommendations for Hosts
- Use the overall average lead time (38 days) as a baseline for your pricing and availability strategy in Simonshaven.
- For May stays, consider implementing length-of-stay discounts or slightly higher rates for bookings made less than 72 days out to capitalize on advance planning.
- During October, focus on last-minute booking availability and promotions, as guests book with very short notice (8 days avg.).
- Target marketing efforts for the Summer season well in advance (at least 48 days) to capture early planners.
- Monitor your own booking lead times against these Simonshaven averages to identify opportunities for dynamic pricing adjustments.
Popular & Essential Airbnb Amenities in Simonshaven (2025)
Amenity Prevalence
Amenity Insights for Simonshaven
- Essential amenities in Simonshaven that guests expect include: Wifi, Dishwasher, Coffee maker, Kitchen, Heating, Hangers, Refrigerator. Lacking these (any) could significantly impact bookings.
- Popular amenities like Private entrance, TV, Free street parking are common but not universal. Offering these can provide a competitive edge.
Recommendations for Hosts
- Ensure your listing includes all essential amenities for Simonshaven: Wifi, Dishwasher, Coffee maker, Kitchen, Heating, Hangers, Refrigerator.
- Consider adding popular differentiators like Private entrance or TV to increase appeal.
- Highlight unique or less common amenities you offer (e.g., hot tub, dedicated workspace, EV charger) in your listing description and photos.
- Regularly check competitor amenities in Simonshaven to stay competitive.
Simonshaven Airbnb Guest Demographics & Profile Analysis (2025)
Guest Profile Summary for Simonshaven
- The typical guest profile for Airbnb in Simonshaven consists of predominantly international visitors (100%), with top international origins including France, typically belonging to the Post-2000s (Gen Z/Alpha) group (50%), primarily speaking English or German.
- Domestic travelers account for 0.0% of guests.
- Key international markets include Germany (44.8%) and France (24.1%).
- Top languages spoken are English (37%) followed by German (29.6%).
- A significant demographic segment is the Post-2000s (Gen Z/Alpha) group, representing 50% of guests.
Recommendations for Hosts
- Focus marketing internationally, particularly towards travelers from France.
- Tailor amenities and listing descriptions to appeal to the dominant Post-2000s (Gen Z/Alpha) demographic (e.g., highlight fast WiFi, smart home features, local guides).
- Highlight unique local experiences or amenities relevant to the primary guest profile.
- Consider seasonal promotions aligned with peak travel times for key origin markets.
Nearby Short-Term Rental Market Comparison
How does the Simonshaven Airbnb market stack up against its neighbors? Compare key performance metrics like average monthly revenue, ADR, and occupancy rates in surrounding areas to understand the broader regional STR landscape.
| Market | Active Properties | Monthly Revenue | Daily Rate | Avg. Occupancy |
|---|---|---|---|---|
| Raamsdonksveer | 15 | $7,075 | $730.86 | 39% |
| Kockengen | 12 | $6,492 | $442.23 | 54% |
| Mont-de-l'Enclus | 11 | $6,260 | $365.14 | 39% |
| Haghorst | 11 | $5,911 | $466.79 | 41% |
| Merksplas | 12 | $5,250 | $357.99 | 41% |
| Bentveld | 13 | $4,816 | $440.99 | 52% |
| Anzegem | 10 | $4,509 | $443.44 | 39% |
| Oud Ade | 17 | $4,504 | $287.35 | 54% |
| Wormer | 10 | $4,466 | $231.90 | 63% |
| Zerkegem | 10 | $4,412 | $444.54 | 53% |