Lugbe Airbnb Market Analysis 2026: Short Term Rental Data & Vacation Rental Statistics in Federal Capital Territory, Nigeria
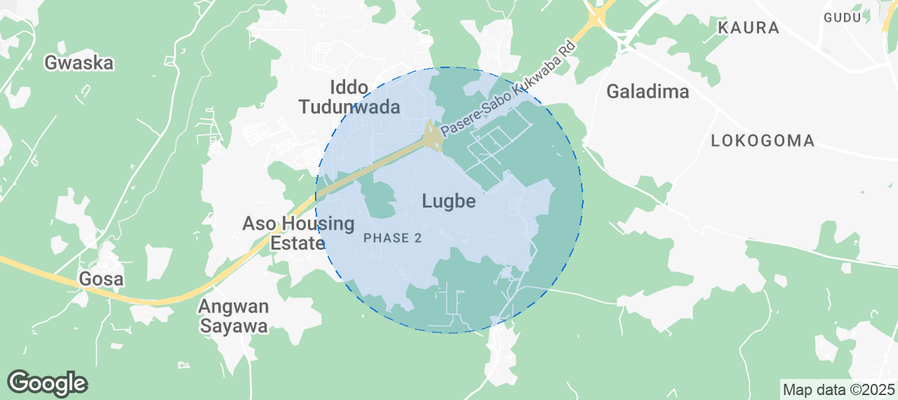
Is Airbnb profitable in Lugbe in 2026? Explore comprehensive Airbnb analytics for Lugbe, Federal Capital Territory, Nigeria to uncover income potential. This 2026 STR market report for Lugbe, based on AirROI data from May 2024 to April 2025, reveals key trends in the niche market of 21 active listings.
Whether you're considering an Airbnb investment in Lugbe, optimizing your existing vacation rental, or exploring rental arbitrage opportunities, understanding the Lugbe Airbnb data is crucial. Leveraging the low regulation environment is key to maximizing your short term rental income potential. Let's dive into the specifics.
Key Lugbe Airbnb Performance Metrics Overview
Monthly Airbnb Revenue Variations & Income Potential in Lugbe (2026)
Understanding the monthly revenue variations for Airbnb listings in Lugbe is key to maximizing your short term rental income potential. Seasonality significantly impacts earnings. Our analysis, based on data from the past 12 months, shows that the peak revenue month for STRs in Lugbe is typically November, while December often presents the lowest earnings, highlighting opportunities for strategic pricing adjustments during shoulder and low seasons. Explore the typical Airbnb income in Lugbe across different performance tiers:
- Best-in-class properties (Top 10%) achieve $3,443+ monthly, often utilizing dynamic pricing and superior guest experiences.
- Strong performing properties (Top 25%) earn $1,286 or more, indicating effective management and desirable locations/amenities.
- Typical properties (Median) generate around $505 per month, representing the average market performance.
- Entry-level properties (Bottom 25%) see earnings around $190, often with potential for optimization.
Average Monthly Airbnb Earnings Trend in Lugbe
Lugbe Airbnb Occupancy Rate Trends (2026)
Maximize your bookings by understanding the Lugbe STR occupancy trends. Seasonal demand shifts significantly influence how often properties are booked. Typically, Junesees the highest demand (peak season occupancy), while January experiences the lowest (low season). Effective strategies, like adjusting minimum stays or offering promotions, can boost occupancy during slower periods. Here's how different property tiers perform in Lugbe:
- Best-in-class properties (Top 10%) achieve 39%+ occupancy, indicating high desirability and potentially optimized availability.
- Strong performing properties (Top 25%) maintain 30% or higher occupancy, suggesting good market fit and guest satisfaction.
- Typical properties (Median) have an occupancy rate around 23%.
- Entry-level properties (Bottom 25%) average 21% occupancy, potentially facing higher vacancy.
Average Monthly Occupancy Rate Trend in Lugbe
Average Daily Rate (ADR) Airbnb Trends in Lugbe (2026)
Effective short term rental pricing strategy in Lugbe involves understanding monthly ADR fluctuations. The Average Daily Rate (ADR) for Airbnb in Lugbe typically peaks in July and dips lowest during April. Leveraging Airbnb dynamic pricing tools or strategies based on this seasonality can significantly boost revenue. Here's a look at the typical nightly rates achieved:
- Best-in-class properties (Top 10%) command rates of $165+ per night, often due to premium features or locations.
- Strong performing properties (Top 25%) achieve nightly rates of $95 or more.
- Typical properties (Median) charge around $49 per night.
- Entry-level properties (Bottom 25%) earn around $20 per night.
Average Daily Rate (ADR) Trend by Month in Lugbe
Get Live Lugbe Market Intelligence 👇
Explore Real-time Analytics
Airbnb Seasonality Analysis & Trends in Lugbe (2025)
Peak Season (November, May, June)
- Revenue averages $1,823 per month
- Occupancy rates average 58.4%
- Daily rates average $76
Shoulder Season
- Revenue averages $1,025 per month
- Occupancy maintains around 15.3%
- Daily rates hold near $65
Low Season (April, July, December)
- Revenue drops to average $554 per month
- Occupancy decreases to average 19.3%
- Daily rates adjust to average $65
Seasonality Insights for Lugbe
- The Airbnb seasonality in Lugbe shows highly seasonal trends requiring careful strategy. While the sections above show seasonal averages, it's also insightful to look at the extremes:
- During the high season, the absolute peak month showcases Lugbe's highest earning potential, with monthly revenues capable of climbing to $1,882, occupancy reaching a high of 76.7%, and ADRs peaking at $77.
- Conversely, the slowest single month of the year, typically falling within the low season, marks the market's lowest point. In this month, revenue might dip to $291, occupancy could drop to 9.0%, and ADRs may adjust down to $53.
- Understanding both the seasonal averages and these monthly peaks and troughs in revenue, occupancy, and ADR is crucial for maximizing your Airbnb profit potential in Lugbe.
Seasonal Strategies for Maximizing Profit
- Peak Season: Maximize revenue through premium pricing and potentially longer minimum stays. Ensure high availability.
- Low Season: Offer competitive pricing, special promotions (e.g., extended stay discounts), and flexible cancellation policies. Target off-season travelers like remote workers or budget-conscious guests.
- Shoulder Seasons: Implement dynamic pricing that balances peak and low rates. Target weekend travelers or specific events. Offer slightly more flexible terms than peak season.
- Regularly analyze your own performance against these Lugbe seasonality benchmarks and adjust your pricing and availability strategy accordingly.
Best Areas for Airbnb Investment in Lugbe (2026)
Exploring the top neighborhoods for short-term rentals in Lugbe? This section highlights key areas, outlining why they are attractive for hosts and guests, along with notable local attractions. Consider these locations based on your target guest profile and investment strategy.
| Neighborhood / Area | Why Host Here? (Target Guests & Appeal) | Key Attractions & Landmarks |
|---|---|---|
| Lugbe District | A rapidly developing area with access to the Abuja International Airport. It's a convenient location for travelers seeking affordable accommodations close to the airport. | Abuja International Airport, Living Faith Church, Wuse Market, Jabi Lake, FCT National Stadium, National Mosque |
| Jabi | A scenic area known for its lake and recreational facilities. Ideal for families and travelers looking for leisure activities and shopping options. | Jabi Lake, Jabi Lake Mall, Art and Craft Market, Jabi Boat Club, National Theatre |
| Gwarinpa | The largest residential estate in West Africa, Gwarinpa is home to many expatriates and offers a variety of housing options for short-term rentals. | Gwarinpa Shopping Mall, Sarius Palace, Novare Mall, Unity Fountain |
| Utako | A busy commercial area with access to markets, restaurants, and public transport. Popular among business travelers and locals. | Utako Market, Silverbird Cinemas, Jabi Lake Mall, Nigerian National Mosque |
| Wuse II | An upscale area with commercial activity, luxury hotels, and embassies. Attracts business travelers and high-end tourists. | Wuse Market, Dunes Center, Sheraton Abuja Hotel, National Library |
| Nyanya | A vibrant area popular with locals, it's a budget-friendly option for travelers looking to experience daily life in Abuja. | Nyanya Market, Wakko Art Market, Aso Rock, National Stadium |
| Bwari | An emerging area with a mix of urban and rural attractions, suitable for travelers looking for a peaceful stay away from city hustle. | Bwari Market, Old Presidential Villa, Julius Berger Bridge, Tarkwa Bay |
| Abuja Central | The heart of Abuja with a mixture of government buildings, offices, and shopping centers. Perfect for short stays near key attractions. | Aso Rock, National Assembly, Central Bank of Nigeria, Unity Fountain, Nigerian National Mosque |
Understanding Airbnb License Requirements & STR Laws in Lugbe (2026)
While Lugbe, Federal Capital Territory, Nigeria currently shows low STR regulations, specific Airbnb license requirements might still exist or change. Always verify the latest short term rental regulations and Airbnb license requirements directly with local government authorities for Lugbe to ensure full compliance before hosting.
(Source: AirROI data, 2026, finding no licensed listings among those analyzed)
Top Performing Airbnb Properties in Lugbe (2026)
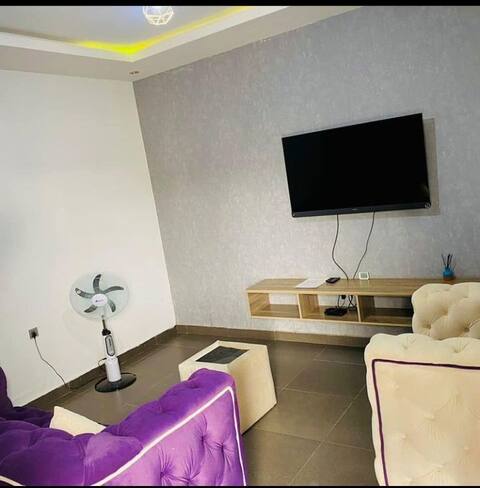
Benchmark your potential! Explore examples of top-performing Airbnb properties in Lugbebased on Trailing Twelve Month (TTM) revenue. Analyze their characteristics, revenue, occupancy rate, and ADR to understand what drives success in this market.

Lovely 2-Bedroom serviced apartment with bathtub
Private Room • 2 bedrooms
Lovely 2bedrooms service apartment,Lugbe AirportRd
Private Room • 2 bedrooms
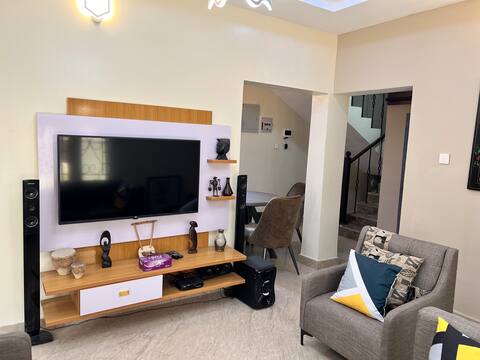
Beautifully Finished 2 Bedrooms
Entire Place • 2 bedrooms

Cozy 3BD Spacious Haven + Open kitchen + Netflix
Entire Place • 3 bedrooms

Specious 2-bedroom flat, free parking on premises.
Entire Place • 2 bedrooms

Gorgeous 4 Bedroom Duplex River Park Estate, Abuja
Entire Place • 4 bedrooms
Note: Performance varies based on location, size, amenities, seasonality, and management quality. Data reflects the past 12 months.
Top Performing Airbnb Hosts in Lugbe (2026)
Learn from the best! This table showcases top-performing Airbnb hosts in Lugbe based on the number of properties managed and estimated total revenue over the past year. Analyze their scale and performance metrics.
| Host Name | Properties | Grossing Revenue | Stay Reviews | Avg Rating |
|---|---|---|---|---|
| Host #287786905 | 2 | $9,259 | 1 | 0.00/5.0 |
| Host #468152441 | 1 | $8,875 | 0 | 0.00/5.0 |
| Host #475961242 | 1 | $8,626 | 0 | 0.00/5.0 |
| Host #353985005 | 1 | $8,460 | 0 | 0.00/5.0 |
| Host #99456964 | 2 | $7,666 | 0 | 0.00/5.0 |
| Host #477235793 | 1 | $6,822 | 0 | 0.00/5.0 |
| Alex | 2 | $6,540 | 5 | 2.38/5.0 |
| Host #483403118 | 1 | $5,799 | 0 | 0.00/5.0 |
| Host #492589143 | 3 | $4,654 | 2 | 0.00/5.0 |
| Host #519586959 | 1 | $3,436 | 0 | 0.00/5.0 |
Analyzing the strategies of top hosts, such as their property selection, pricing, and guest communication, can offer valuable lessons for optimizing your own Airbnb operations in Lugbe.
Dive Deeper: Advanced Lugbe STR Market Data (2026)
Ready to unlock more insights? AirROI provides access to advanced metrics and comprehensive Airbnb data for Lugbe. Explore detailed analytics beyond this report to refine your investment strategy, optimize pricing, and maximize your vacation rental profits.
Explore Advanced MetricsLugbe Short-Term Rental Market Composition (2026): Property & Room Types
Room Type Distribution
Property Type Distribution
Market Composition Insights for Lugbe
- The Lugbe Airbnb market composition is heavily skewed towards Private Room listings, which make up 57.1% of the 21 active rentals. This indicates strong guest preference for privacy and space.
- Looking at the property type distribution in Lugbe, House properties are the most common (52.4%), reflecting the local real estate landscape.
- Houses represent a significant 52.4% portion, catering likely to families or larger groups.
- Smaller segments like hotel/boutique (combined 4.8%) offer potential for unique stay experiences.
Lugbe Airbnb Room Capacity Analysis (2026): Bedroom Distribution
Distribution of Listings by Number of Bedrooms
Room Capacity Insights for Lugbe
- The dominant room capacity in Lugbe is 1 bedroom listings, making up 47.6% of the market. This suggests a strong demand for properties suitable for couples or solo travelers.
- Together, 1 bedroom and 2 bedrooms properties represent 76.2% of the active Airbnb listings in Lugbe, indicating a high concentration in these sizes.
Lugbe Vacation Rental Guest Capacity Trends (2026)
Distribution of Listings by Guest Capacity
Guest Capacity Insights for Lugbe
- The most common guest capacity trend in Lugbe vacation rentals is listings accommodating 2 guests (42.9%). This suggests the primary traveler segment is likely couples or solo travelers.
- Properties designed for 2 guests and 3 guests dominate the Lugbe STR market, accounting for 57.2% of listings.
- A significant 47.7% of listings cater specifically to 1-2 guests, highlighting strong demand from couples and solo travelers in Lugbe.
- 19.0% of properties accommodate 6+ guests, serving the market segment for larger families or group travel in Lugbe.
- On average, properties in Lugbe are equipped to host 3.3 guests.
Lugbe Airbnb Booking Patterns (2026): Available vs. Booked Days
Available Days Distribution
Booked Days Distribution
Booking Pattern Insights for Lugbe
- The most common availability pattern in Lugbe falls within the 271-366 days range, representing 95.2% of listings. This suggests many properties have significant open periods on their calendars.
- Approximately 100.0% of listings show high availability (181+ days open annually), indicating potential for increased bookings or specific owner usage patterns.
- For booked days, the 31-90 days range is most frequent in Lugbe (81%), reflecting common guest stay durations or potential owner blocking patterns.
Lugbe Airbnb Minimum Stay Requirements Analysis
Distribution of Listings by Minimum Night Requirement
1 Night
17 listings
81% of total
2 Nights
2 listings
9.5% of total
30+ Nights
2 listings
9.5% of total
Key Insights
- The most prevalent minimum stay requirement in Lugbe is 1 Night, adopted by 81% of listings. This highlights the market's preference for shorter, flexible bookings.
- A strong majority (90.5%) of the Lugbe Airbnb data shows acceptance of very short stays (1-2 nights), indicating a dynamic, high-turnover market.
Recommendations
- Align with the market by considering a 1 Night minimum stay, as 81% of Lugbe hosts use this setting.
- Explore offering discounts for stays of 30+ nights to attract the 9.5% of the market seeking extended stays.
- Adjust minimum nights based on seasonality – potentially shorter during low season and longer during peak demand periods in Lugbe.
Lugbe Airbnb Cancellation Policy Trends Analysis (2026)
Flexible
1 listings
100% of total
Cancellation Policy Insights for Lugbe
- The prevailing Airbnb cancellation policy trend in Lugbe is Flexible, used by 100% of listings.
- The market strongly favors guest-friendly terms, with 100.0% of listings offering Flexible or Moderate policies. This suggests guests in Lugbe may expect booking flexibility.
Recommendations for Hosts
- Consider adopting a Flexible policy to align with the 100% market standard in Lugbe.
- Given the high prevalence of Flexible policies (100%), offering this can enhance booking appeal, especially during shoulder seasons.
- Regularly review your cancellation policy against competitors and market demand shifts in Lugbe.
Lugbe STR Booking Lead Time Analysis (2026)
Average Booking Lead Time by Month
Booking Lead Time Insights for Lugbe
- The overall average booking lead time for vacation rentals in Lugbe is 11 days.
- Guests book furthest in advance for stays during April (average 43 days), likely coinciding with peak travel demand or local events.
- The shortest booking windows occur for stays in June (average 0 days), indicating more last-minute travel plans during this time.
- Seasonally, Spring (16 days avg.) sees the longest lead times, while Summer (5 days avg.) has the shortest, reflecting typical travel planning cycles.
Recommendations for Hosts
- Use the overall average lead time (11 days) as a baseline for your pricing and availability strategy in Lugbe.
- For April stays, consider implementing length-of-stay discounts or slightly higher rates for bookings made less than 43 days out to capitalize on advance planning.
- During June, focus on last-minute booking availability and promotions, as guests book with very short notice (0 days avg.).
- Target marketing efforts for the Spring season well in advance (at least 16 days) to capture early planners.
- Monitor your own booking lead times against these Lugbe averages to identify opportunities for dynamic pricing adjustments.
Popular & Essential Airbnb Amenities in Lugbe (2026)
Amenity Prevalence
Amenity Insights for Lugbe
- Essential amenities in Lugbe that guests expect include: Essentials, Kitchen, TV, Air conditioning, Carbon monoxide alarm, Wifi, Washer, Smoke alarm, Dryer, Hot water. Lacking these (any) could significantly impact bookings.
Recommendations for Hosts
- Ensure your listing includes all essential amenities for Lugbe: Essentials, Kitchen, TV, Air conditioning, Carbon monoxide alarm, Wifi, Washer, Smoke alarm, Dryer, Hot water.
- Prioritize adding missing essentials: Dryer, Hot water.
- Highlight unique or less common amenities you offer (e.g., hot tub, dedicated workspace, EV charger) in your listing description and photos.
- Regularly check competitor amenities in Lugbe to stay competitive.
Lugbe Airbnb Guest Demographics & Profile Analysis (2026)
Guest Profile Summary for Lugbe
- The typical guest profile for Airbnb in Lugbe consists of predominantly international visitors (100%), with top international origins including Italy, typically belonging to the Post-2000s (Gen Z/Alpha) group (50%), primarily speaking English or Spanish.
- Domestic travelers account for 0.0% of guests.
- Key international markets include United Kingdom (33.3%) and Italy (33.3%).
- Top languages spoken are English (80%) followed by Spanish (20%).
- A significant demographic segment is the Post-2000s (Gen Z/Alpha) group, representing 50% of guests.
Recommendations for Hosts
- Focus marketing internationally, particularly towards travelers from Italy.
- Tailor amenities and listing descriptions to appeal to the dominant Post-2000s (Gen Z/Alpha) demographic (e.g., highlight fast WiFi, smart home features, local guides).
- Highlight unique local experiences or amenities relevant to the primary guest profile.
- Consider seasonal promotions aligned with peak travel times for key origin markets.
Nearby Short-Term Rental Market Comparison
How does the Lugbe Airbnb market stack up against its neighbors? Compare key performance metrics like average monthly revenue, ADR, and occupancy rates in surrounding areas to understand the broader regional STR landscape.
| Market | Active Properties | Monthly Revenue | Daily Rate | Avg. Occupancy |
|---|---|---|---|---|
| Guzape | 10 | $922 | $160.37 | 22% |
| Abuja | 780 | $489 | $84.36 | 23% |
| Kubwa | 31 | $443 | $75.17 | 20% |
| Gwarinpa | 139 | $434 | $72.01 | 22% |
| Jiru | 26 | $427 | $75.16 | 22% |
| Galadimawa | 73 | $407 | $65.77 | 22% |
| Abuja Municipal Area Council | 14 | $399 | $77.15 | 20% |