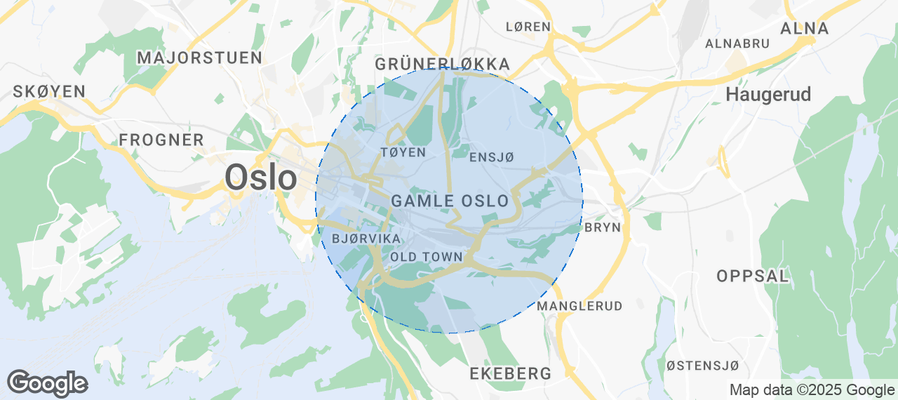
Gamle Oslo Airbnb Market Analysis 2026: Short Term Rental Data & Vacation Rental Statistics in Oslo, Norway
Is Airbnb profitable in Gamle Oslo in 2026? Explore comprehensive Airbnb analytics for Gamle Oslo, Oslo, Norway to uncover income potential. This 2026 STR market report for Gamle Oslo, based on AirROI data from February 2025 to January 2026, reveals key trends in the niche market of 59 active listings.
Whether you're considering an Airbnb investment in Gamle Oslo, optimizing your existing vacation rental, or exploring rental arbitrage opportunities, understanding the Gamle Oslo Airbnb data is crucial. Leveraging the low regulation environment is key to maximizing your short term rental income potential. Let's dive into the specifics.
Key Gamle Oslo Airbnb Performance Metrics Overview
Monthly Airbnb Revenue Variations & Income Potential in Gamle Oslo (2026)
Understanding the monthly revenue variations for Airbnb listings in Gamle Oslo is key to maximizing your short term rental income potential. Seasonality significantly impacts earnings. Our analysis, based on data from the past 12 months, shows that the peak revenue month for STRs in Gamle Oslo is typically June, while May often presents the lowest earnings, highlighting opportunities for strategic pricing adjustments during shoulder and low seasons. Explore the typical Airbnb income in Gamle Oslo across different performance tiers:
- Best-in-class properties (Top 10%) achieve $4,607+ monthly, often utilizing dynamic pricing and superior guest experiences.
- Strong performing properties (Top 25%) earn $3,358 or more, indicating effective management and desirable locations/amenities.
- Typical properties (Median) generate around $1,749 per month, representing the average market performance.
- Entry-level properties (Bottom 25%) see earnings around $849, often with potential for optimization.
Average Monthly Airbnb Earnings Trend in Gamle Oslo
Gamle Oslo Airbnb Occupancy Rate Trends (2026)
Maximize your bookings by understanding the Gamle Oslo STR occupancy trends. Seasonal demand shifts significantly influence how often properties are booked. Typically, Junesees the highest demand (peak season occupancy), while May experiences the lowest (low season). Effective strategies, like adjusting minimum stays or offering promotions, can boost occupancy during slower periods. Here's how different property tiers perform in Gamle Oslo:
- Best-in-class properties (Top 10%) achieve 81%+ occupancy, indicating high desirability and potentially optimized availability.
- Strong performing properties (Top 25%) maintain 69% or higher occupancy, suggesting good market fit and guest satisfaction.
- Typical properties (Median) have an occupancy rate around 47%.
- Entry-level properties (Bottom 25%) average 29% occupancy, potentially facing higher vacancy.
Average Monthly Occupancy Rate Trend in Gamle Oslo
Average Daily Rate (ADR) Airbnb Trends in Gamle Oslo (2026)
Effective short term rental pricing strategy in Gamle Oslo involves understanding monthly ADR fluctuations. The Average Daily Rate (ADR) for Airbnb in Gamle Oslo typically peaks in June and dips lowest during August. Leveraging Airbnb dynamic pricing tools or strategies based on this seasonality can significantly boost revenue. Here's a look at the typical nightly rates achieved:
- Best-in-class properties (Top 10%) command rates of $281+ per night, often due to premium features or locations.
- Strong performing properties (Top 25%) achieve nightly rates of $211 or more.
- Typical properties (Median) charge around $143 per night.
- Entry-level properties (Bottom 25%) earn around $90 per night.
Average Daily Rate (ADR) Trend by Month in Gamle Oslo
Get Live Gamle Oslo Market Intelligence 👇
Explore Real-time Analytics
Airbnb Seasonality Analysis & Trends in Gamle Oslo (2026)
Peak Season (June, August, July)
- Revenue averages $3,146 per month
- Occupancy rates average 63.5%
- Daily rates average $156
Shoulder Season
- Revenue averages $1,870 per month
- Occupancy maintains around 40.8%
- Daily rates hold near $157
Low Season (February, March, April)
- Revenue drops to average $0 per month
- Occupancy decreases to average 0.0%
- Daily rates adjust to average $157
Seasonality Insights for Gamle Oslo
- The Airbnb seasonality in Gamle Oslo shows highly seasonal trends requiring careful strategy. While the sections above show seasonal averages, it's also insightful to look at the extremes:
- During the high season, the absolute peak month showcases Gamle Oslo's highest earning potential, with monthly revenues capable of climbing to $3,773, occupancy reaching a high of 71.8%, and ADRs peaking at $158.
- Conversely, the slowest single month of the year, typically falling within the low season, marks the market's lowest point. In this month, revenue might dip to $0, occupancy could drop to 0.0%, and ADRs may adjust down to $154.
- Understanding both the seasonal averages and these monthly peaks and troughs in revenue, occupancy, and ADR is crucial for maximizing your Airbnb profit potential in Gamle Oslo.
Seasonal Strategies for Maximizing Profit
- Peak Season: Maximize revenue through premium pricing and potentially longer minimum stays. Ensure high availability.
- Low Season: Offer competitive pricing, special promotions (e.g., extended stay discounts), and flexible cancellation policies. Target off-season travelers like remote workers or budget-conscious guests.
- Shoulder Seasons: Implement dynamic pricing that balances peak and low rates. Target weekend travelers or specific events. Offer slightly more flexible terms than peak season.
- Regularly analyze your own performance against these Gamle Oslo seasonality benchmarks and adjust your pricing and availability strategy accordingly.
Best Areas for Airbnb Investment in Gamle Oslo (2026)
Exploring the top neighborhoods for short-term rentals in Gamle Oslo? This section highlights key areas, outlining why they are attractive for hosts and guests, along with notable local attractions. Consider these locations based on your target guest profile and investment strategy.
| Neighborhood / Area | Why Host Here? (Target Guests & Appeal) | Key Attractions & Landmarks |
|---|---|---|
| Grünerløkka | A vibrant, trendy neighborhood known for its artsy atmosphere, cafes, and boutiques. It's popular among young professionals and tourists looking for a lively, cultural experience. | Mathallen Food Hall, Youngstorget, Aker Brygge, Ekebergparken, Oslo Street Art, Oslo's River Akerselva |
| Sentrum | The heart of Oslo, where business meets tourist hotspots. Offers easy access to landmarks, shopping, and dining, making it ideal for short-term rentals. | Oslo Opera House, Aker Brygge, Karl Johans gate, Nobel Peace Center, National Museum, Oslo City Hall |
| Frogner | An upscale residential area known for its historic buildings and proximity to parks. Attracts families and travelers seeking a quiet yet central location with beautiful architecture. | Frogner Park, Vigeland Park, Oslo City Museum, Royal Palace, National Gallery |
| Bislett | A lively neighborhood with a mix of students and young families. It has a number of shops, cafes, and is close to the University of Oslo, appealing to both students and tourists. | Bislett Stadium, St. Hanshaugen Park, University of Oslo, Bjorvika, Oslo's nightlife |
| Majorstuen | A bustling commercial area with shops, restaurants, and easy access to public transport. Ideal for visitors looking to explore Oslo with convenience. | Bogstadveien shopping street, Majorstuen Church, Vigeland Sculpture Park, Ski Museum, Holmenkollen |
| Tjuvholmen | A modern waterfront area known for its contemporary architecture and art scene. Perfect for travelers who appreciate upscale living and cultural experiences. | Astrup Fearnley Museum, Tjuvholmen Beach, Aker Brygge, Restaurants and bars, Marina |
| St. Hanshaugen | A charming district with beautiful parks and a relaxed atmosphere, attracting both locals and tourists. Great for those looking for a serene stay close to the city center. | St. Hanshaugen Park, Oslo's Botanical Garden, Walking trails, Cafes and eateries, Observatory |
| Old Oslo (Gamle Oslo) | A historical part of town that showcases Oslo’s rich history and diversity. Great for cultural tourism and unique local experiences. | The Munch Museum, Akerselva River, Sofienberg Park, Cultural venues, Local markets |
Understanding Airbnb License Requirements & STR Laws in Gamle Oslo (2026)
While Gamle Oslo, Oslo, Norway currently shows low STR regulations, specific Airbnb license requirements might still exist or change. Always verify the latest short term rental regulations and Airbnb license requirements directly with local government authorities for Gamle Oslo to ensure full compliance before hosting.
(Source: AirROI data, 2026, finding no licensed listings among those analyzed)
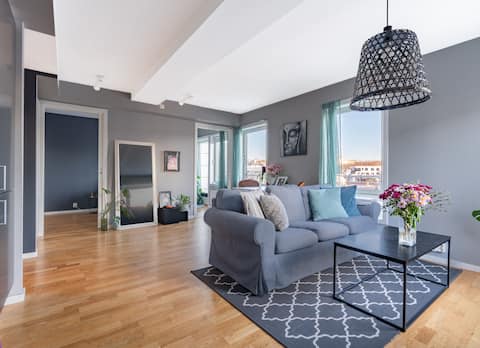
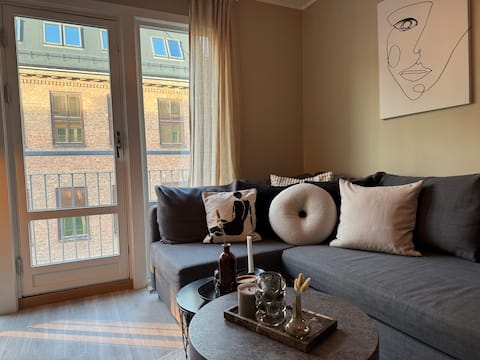
Top Performing Airbnb Properties in Gamle Oslo (2026)
Benchmark your potential! Explore examples of top-performing Airbnb properties in Gamle Oslobased on Trailing Twelve Month (TTM) revenue. Analyze their characteristics, revenue, occupancy rate, and ADR to understand what drives success in this market.
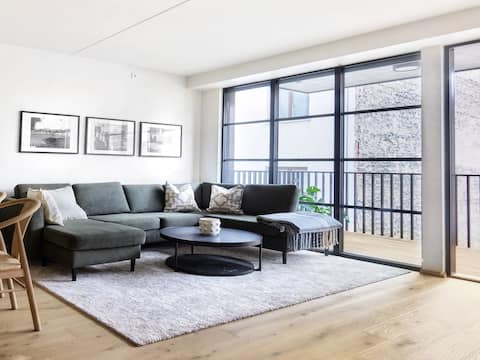
Brand new 3 BR urban condo in central Oslo 970 ft2
Entire Place • 3 bedrooms

Seaside apt with sea view - Balcony - 6 pax
Entire Place • 2 bedrooms
Penthouse for 4 pers. 2 balconies. Central. 40 sqm
Entire Place • 1 bedroom
Modern Oasis Near City Center
Entire Place • 2 bedrooms

Apartment in Central Oslo, Close to Train Station
Entire Place • 1 bedroom

Spacious apartment in the middle of the city center
Entire Place • 2 bedrooms
Note: Performance varies based on location, size, amenities, seasonality, and management quality. Data reflects the past 12 months.
Top Performing Airbnb Hosts in Gamle Oslo (2026)
Learn from the best! This table showcases top-performing Airbnb hosts in Gamle Oslo based on the number of properties managed and estimated total revenue over the past year. Analyze their scale and performance metrics.
| Host Name | Properties | Grossing Revenue | Stay Reviews | Avg Rating |
|---|---|---|---|---|
| Thorbjørn | 1 | $69,515 | 24 | 4.79/5.0 |
| Hans Fabian | 1 | $47,261 | 49 | 4.82/5.0 |
| Tormod | 1 | $36,926 | 118 | 4.71/5.0 |
| Aina | 2 | $35,206 | 4 | Not Rated |
| Tessie | 1 | $33,455 | 69 | 4.93/5.0 |
| Magnus | 1 | $31,324 | 39 | 4.95/5.0 |
| Kawa Eiendom AS | 1 | $30,381 | 47 | 4.49/5.0 |
| WeClean Norge AS | 2 | $29,975 | 8 | 5.00/5.0 |
| Patrick | 2 | $27,791 | 26 | 4.96/5.0 |
| John | 8 | $27,033 | 159 | 4.62/5.0 |
Analyzing the strategies of top hosts, such as their property selection, pricing, and guest communication, can offer valuable lessons for optimizing your own Airbnb operations in Gamle Oslo.
Dive Deeper: Advanced Gamle Oslo STR Market Data (2026)
Ready to unlock more insights? AirROI provides access to advanced metrics and comprehensive Airbnb data for Gamle Oslo. Explore detailed analytics beyond this report to refine your investment strategy, optimize pricing, and maximize your vacation rental profits.
Explore Advanced MetricsGamle Oslo Short-Term Rental Market Composition (2026): Property & Room Types
Room Type Distribution
Property Type Distribution
Market Composition Insights for Gamle Oslo
- The Gamle Oslo Airbnb market composition is heavily skewed towards Entire Home/Apt listings, which make up 69.5% of the 59 active rentals. This indicates strong guest preference for privacy and space.
- However, a notable 16.9% share for Private Rooms suggests opportunities for budget-conscious travelers or hosts renting out spare rooms.
- Looking at the property type distribution in Gamle Oslo, Apartment/Condo properties are the most common (98.3%), reflecting the local real estate landscape.
- Smaller segments like hotel/boutique (combined 1.7%) offer potential for unique stay experiences.
Gamle Oslo Airbnb Room Capacity Analysis (2026): Bedroom Distribution
Distribution of Listings by Number of Bedrooms
Room Capacity Insights for Gamle Oslo
- The dominant room capacity in Gamle Oslo is 1 bedroom listings, making up 25.4% of the market. This suggests a strong demand for properties suitable for couples or solo travelers.
- Together, 1 bedroom and 2 bedrooms properties represent 44.0% of the active Airbnb listings in Gamle Oslo, indicating a high concentration in these sizes.
Gamle Oslo Vacation Rental Guest Capacity Trends (2026)
Distribution of Listings by Guest Capacity
Guest Capacity Insights for Gamle Oslo
- The most common guest capacity trend in Gamle Oslo vacation rentals is listings accommodating 6 guests (22%). This suggests the primary traveler segment is likely larger groups.
- Properties designed for 6 guests and 4 guests dominate the Gamle Oslo STR market, accounting for 40.6% of listings.
- 27.1% of properties accommodate 6+ guests, serving the market segment for larger families or group travel in Gamle Oslo.
- On average, properties in Gamle Oslo are equipped to host 3.1 guests.
Gamle Oslo Airbnb Booking Patterns (2026): Available vs. Booked Days
Available Days Distribution
Booked Days Distribution
Booking Pattern Insights for Gamle Oslo
- The most common availability pattern in Gamle Oslo falls within the 271-366 days range, representing 61% of listings. This suggests many properties have significant open periods on their calendars.
- Approximately 91.5% of listings show high availability (181+ days open annually), indicating potential for increased bookings or specific owner usage patterns.
- For booked days, the 31-90 days range is most frequent in Gamle Oslo (57.6%), reflecting common guest stay durations or potential owner blocking patterns.
- A notable 10.2% of properties secure long booking periods (181+ days booked per year), highlighting successful long-term rental strategies or significant owner usage.
Gamle Oslo Airbnb Minimum Stay Requirements Analysis
Distribution of Listings by Minimum Night Requirement
1 Night
19 listings
32.2% of total
2 Nights
17 listings
28.8% of total
3 Nights
2 listings
3.4% of total
4-6 Nights
4 listings
6.8% of total
7-29 Nights
3 listings
5.1% of total
30+ Nights
14 listings
23.7% of total
Key Insights
- The most prevalent minimum stay requirement in Gamle Oslo is 1 Night, adopted by 32.2% of listings. This highlights the market's preference for shorter, flexible bookings.
- A strong majority (61.0%) of the Gamle Oslo Airbnb data shows acceptance of very short stays (1-2 nights), indicating a dynamic, high-turnover market.
- A significant segment (23.7%) caters to monthly stays (30+ nights) in Gamle Oslo, pointing to opportunities in the extended-stay market.
Recommendations
- Align with the market by considering a 1 Night minimum stay, as 32.2% of Gamle Oslo hosts use this setting.
- Explore offering discounts for stays of 30+ nights to attract the 23.7% of the market seeking extended stays.
- Adjust minimum nights based on seasonality – potentially shorter during low season and longer during peak demand periods in Gamle Oslo.
Gamle Oslo Airbnb Cancellation Policy Trends Analysis (2026)
Limited
1 listings
1.7% of total
Flexible
20 listings
33.9% of total
Moderate
13 listings
22% of total
Firm
12 listings
20.3% of total
Strict
13 listings
22% of total
Cancellation Policy Insights for Gamle Oslo
- The prevailing Airbnb cancellation policy trend in Gamle Oslo is Flexible, used by 33.9% of listings.
- There's a relatively balanced mix between guest-friendly (55.9%) and stricter (42.3%) policies, offering choices for different guest needs.
Recommendations for Hosts
- Consider adopting a Flexible policy to align with the 33.9% market standard in Gamle Oslo.
- Regularly review your cancellation policy against competitors and market demand shifts in Gamle Oslo.
Gamle Oslo STR Booking Lead Time Analysis (2026)
Average Booking Lead Time by Month
Booking Lead Time Insights for Gamle Oslo
- The overall average booking lead time for vacation rentals in Gamle Oslo is 30 days.
- Guests book furthest in advance for stays during October (average 47 days), likely coinciding with peak travel demand or local events.
- The shortest booking windows occur for stays in April (average 0 days), indicating more last-minute travel plans during this time.
- Seasonally, Fall (44 days avg.) sees the longest lead times, while Spring (1 days avg.) has the shortest, reflecting typical travel planning cycles.
Recommendations for Hosts
- Use the overall average lead time (30 days) as a baseline for your pricing and availability strategy in Gamle Oslo.
- For October stays, consider implementing length-of-stay discounts or slightly higher rates for bookings made less than 47 days out to capitalize on advance planning.
- During April, focus on last-minute booking availability and promotions, as guests book with very short notice (0 days avg.).
- Target marketing efforts for the Fall season well in advance (at least 44 days) to capture early planners.
- Monitor your own booking lead times against these Gamle Oslo averages to identify opportunities for dynamic pricing adjustments.
Popular & Essential Airbnb Amenities in Gamle Oslo (2026)
Amenity Prevalence
Amenity Insights for Gamle Oslo
- Essential amenities in Gamle Oslo that guests expect include: Smoke alarm, Wifi. Lacking these (any) could significantly impact bookings.
- Popular amenities like Washer, Fire extinguisher, Kitchen are common but not universal. Offering these can provide a competitive edge.
Recommendations for Hosts
- Ensure your listing includes all essential amenities for Gamle Oslo: Smoke alarm, Wifi.
- Prioritize adding missing essentials: Smoke alarm, Wifi.
- Consider adding popular differentiators like Washer or Fire extinguisher to increase appeal.
- Highlight unique or less common amenities you offer (e.g., hot tub, dedicated workspace, EV charger) in your listing description and photos.
- Regularly check competitor amenities in Gamle Oslo to stay competitive.
Gamle Oslo Airbnb Guest Demographics & Profile Analysis (2026)
Guest Profile Summary for Gamle Oslo
- The typical guest profile for Airbnb in Gamle Oslo consists of predominantly international visitors (85%), with top international origins including United States, typically belonging to the Post-2000s (Gen Z/Alpha) group (50%), primarily speaking English or French.
- Domestic travelers account for 14.8% of guests.
- Key international markets include Norway (14.8%) and United States (14.4%).
- Top languages spoken are English (42.8%) followed by French (7.8%).
- A significant demographic segment is the Post-2000s (Gen Z/Alpha) group, representing 50% of guests.
Recommendations for Hosts
- Focus marketing internationally, particularly towards travelers from United States.
- Tailor amenities and listing descriptions to appeal to the dominant Post-2000s (Gen Z/Alpha) demographic (e.g., highlight fast WiFi, smart home features, local guides).
- Highlight unique local experiences or amenities relevant to the primary guest profile.
- Consider seasonal promotions aligned with peak travel times for key origin markets.
Nearby Short-Term Rental Market Comparison
How does the Gamle Oslo Airbnb market stack up against its neighbors? Compare key performance metrics like average monthly revenue, ADR, and occupancy rates in surrounding areas to understand the broader regional STR landscape.
| Market | Active Properties | Monthly Revenue | Daily Rate | Avg. Occupancy |
|---|---|---|---|---|
| Stange | 69 | $2,219 | $241.89 | 34% |
| Frogner | 12 | $2,195 | $212.41 | 60% |
| Starrkärr och Näs | 13 | $2,078 | $248.34 | 22% |
| Fenstad | 11 | $1,961 | $185.87 | 38% |
| Krødsherad | 88 | $1,912 | $236.11 | 33% |
| Sentrum | 20 | $1,876 | $187.93 | 47% |
| Enebakk | 35 | $1,731 | $149.22 | 46% |
| Modum | 26 | $1,730 | $182.90 | 36% |
| Sundvollen | 13 | $1,683 | $210.56 | 40% |
| Stenungsunds kommun | 29 | $1,665 | $188.53 | 40% |