Kirkenes Airbnb Market Analysis 2025: Short Term Rental Data & Vacation Rental Statistics in Troms og Finnmark, Norway
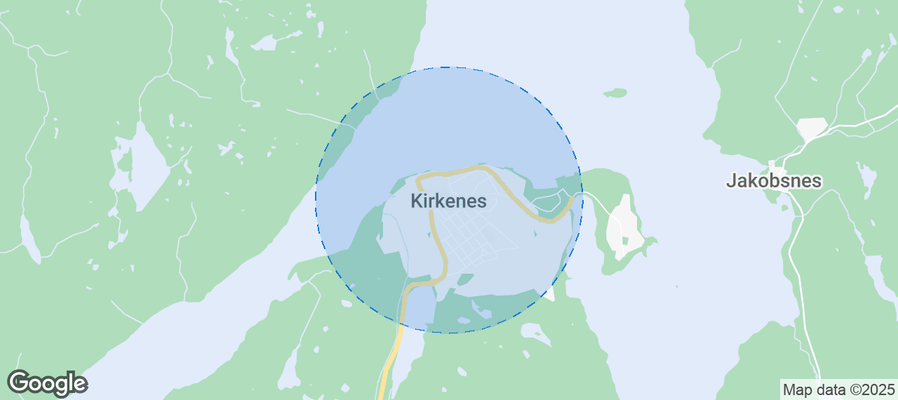
Is Airbnb profitable in Kirkenes in 2025? Explore comprehensive Airbnb analytics for Kirkenes, Troms og Finnmark, Norway to uncover income potential. This 2025 STR market report for Kirkenes, based on AirROI data from December 2024 to November 2025, reveals key trends in the niche market of 19 active listings.
Whether you're considering an Airbnb investment in Kirkenes, optimizing your existing vacation rental, or exploring rental arbitrage opportunities, understanding the Kirkenes Airbnb data is crucial. Leveraging the low regulation environment is key to maximizing your short term rental income potential. Let's dive into the specifics.
Key Kirkenes Airbnb Performance Metrics Overview
Monthly Airbnb Revenue Variations & Income Potential in Kirkenes (2025)
Understanding the monthly revenue variations for Airbnb listings in Kirkenes is key to maximizing your short term rental income potential. Seasonality significantly impacts earnings. Our analysis, based on data from the past 12 months, shows that the peak revenue month for STRs in Kirkenes is typically December, while November often presents the lowest earnings, highlighting opportunities for strategic pricing adjustments during shoulder and low seasons. Explore the typical Airbnb income in Kirkenes across different performance tiers:
- Best-in-class properties (Top 10%) achieve $3,881+ monthly, often utilizing dynamic pricing and superior guest experiences.
- Strong performing properties (Top 25%) earn $2,920 or more, indicating effective management and desirable locations/amenities.
- Typical properties (Median) generate around $2,007 per month, representing the average market performance.
- Entry-level properties (Bottom 25%) see earnings around $1,228, often with potential for optimization.
Average Monthly Airbnb Earnings Trend in Kirkenes
Kirkenes Airbnb Occupancy Rate Trends (2025)
Maximize your bookings by understanding the Kirkenes STR occupancy trends. Seasonal demand shifts significantly influence how often properties are booked. Typically, Decembersees the highest demand (peak season occupancy), while November experiences the lowest (low season). Effective strategies, like adjusting minimum stays or offering promotions, can boost occupancy during slower periods. Here's how different property tiers perform in Kirkenes:
- Best-in-class properties (Top 10%) achieve 85%+ occupancy, indicating high desirability and potentially optimized availability.
- Strong performing properties (Top 25%) maintain 65% or higher occupancy, suggesting good market fit and guest satisfaction.
- Typical properties (Median) have an occupancy rate around 49%.
- Entry-level properties (Bottom 25%) average 29% occupancy, potentially facing higher vacancy.
Average Monthly Occupancy Rate Trend in Kirkenes
Average Daily Rate (ADR) Airbnb Trends in Kirkenes (2025)
Effective short term rental pricing strategy in Kirkenes involves understanding monthly ADR fluctuations. The Average Daily Rate (ADR) for Airbnb in Kirkenes typically peaks in July and dips lowest during March. Leveraging Airbnb dynamic pricing tools or strategies based on this seasonality can significantly boost revenue. Here's a look at the typical nightly rates achieved:
- Best-in-class properties (Top 10%) command rates of $232+ per night, often due to premium features or locations.
- Strong performing properties (Top 25%) achieve nightly rates of $157 or more.
- Typical properties (Median) charge around $117 per night.
- Entry-level properties (Bottom 25%) earn around $101 per night.
Average Daily Rate (ADR) Trend by Month in Kirkenes
Get Live Kirkenes Market Intelligence 👇
Explore Real-time Analytics
Airbnb Seasonality Analysis & Trends in Kirkenes (2025)
Peak Season (December, June, February)
- Revenue averages $2,868 per month
- Occupancy rates average 65.2%
- Daily rates average $138
Shoulder Season
- Revenue averages $2,178 per month
- Occupancy maintains around 46.1%
- Daily rates hold near $140
Low Season (April, September, November)
- Revenue drops to average $1,573 per month
- Occupancy decreases to average 40.7%
- Daily rates adjust to average $141
Seasonality Insights for Kirkenes
- The Airbnb seasonality in Kirkenes shows highly seasonal trends requiring careful strategy. While the sections above show seasonal averages, it's also insightful to look at the extremes:
- During the high season, the absolute peak month showcases Kirkenes's highest earning potential, with monthly revenues capable of climbing to $3,162, occupancy reaching a high of 72.6%, and ADRs peaking at $145.
- Conversely, the slowest single month of the year, typically falling within the low season, marks the market's lowest point. In this month, revenue might dip to $1,287, occupancy could drop to 34.2%, and ADRs may adjust down to $134.
- Understanding both the seasonal averages and these monthly peaks and troughs in revenue, occupancy, and ADR is crucial for maximizing your Airbnb profit potential in Kirkenes.
Seasonal Strategies for Maximizing Profit
- Peak Season: Maximize revenue through premium pricing and potentially longer minimum stays. Ensure high availability.
- Low Season: Offer competitive pricing, special promotions (e.g., extended stay discounts), and flexible cancellation policies. Target off-season travelers like remote workers or budget-conscious guests.
- Shoulder Seasons: Implement dynamic pricing that balances peak and low rates. Target weekend travelers or specific events. Offer slightly more flexible terms than peak season.
- Regularly analyze your own performance against these Kirkenes seasonality benchmarks and adjust your pricing and availability strategy accordingly.
Best Areas for Airbnb Investment in Kirkenes (2025)
Exploring the top neighborhoods for short-term rentals in Kirkenes? This section highlights key areas, outlining why they are attractive for hosts and guests, along with notable local attractions. Consider these locations based on your target guest profile and investment strategy.
| Neighborhood / Area | Why Host Here? (Target Guests & Appeal) | Key Attractions & Landmarks |
|---|---|---|
| Kirkenes Town Center | The heart of Kirkenes, offering easy access to shops, restaurants, and essential services. A great location for tourists looking to explore the cultural and historical aspects of the town. | Kirkenes Snowhotel, Borderland Museum, Varanger Museum, Kongsfjord Tours, Snowmobile Safaris |
| Grenseland | Famous for its location near the Norwegian-Russian border, attracting visitors interested in cross-border tourism and unique experiences. Ideal for those seeking adventures and cultural exchanges. | Pasvik Nature Reserve, The Russian Border, Sør-Varanger Museum, Winter Activities, Cultural Tours |
| Jakobselv | A picturesque area along the river, known for its natural beauty and tranquil landscapes. Perfect for guests looking for relaxation and outdoor activities. | Jakobselva River, Fishing Spots, Hiking Trails, Northern Lights Viewing, Scenic Walks |
| Svanvik | A quiet village offering a peaceful retreat away from the noise of the town. Attractive for families and nature lovers seeking a serene environment. | Svanvik Nature Trails, Fishing and Hunting, Cultural Tours, Local Flora and Fauna, Artisan Shops |
| Bugøynes | A scenic fishing village with beautiful coastal views, known for traditional fishing and local culture. Great for guests interested in authentic local experiences. | Bugøynes Coastal Walks, Local Fishing Tours, Traditional Crafts, Seafood Tasting, Cultural Festivals |
| Nordreisa | An area rich in Sami culture and heritage, appealing to tourists interested in indigenous experiences and nature. Ideal for eco-tourism and cultural education. | Sami Cultural Centers, Wildlife Safaris, Northern Lights Activities, Local Markets, Heritage Festivals |
| Varangerhalvøya National Park | A stunning national park that attracts nature enthusiasts and adventure seekers. Ideal for guests wanting to explore the Arctic wilderness and enjoy wildlife watching. | Hiking Trails, Bird Watching, Scenic Landscapes, Cultural Heritage Sites, Photography Opportunities |
| Bjørnevatn | A small town with a strong community feel, located near Kirkenes. Attractive to visitors looking for a local experience and easy access to Kirkenes attractions. | Bjørnevatn's Local Cuisine, Community Events, Nature Walks, Proximity to Kirkenes |
Understanding Airbnb License Requirements & STR Laws in Kirkenes (2025)
While Kirkenes, Troms og Finnmark, Norway currently shows low STR regulations, specific Airbnb license requirements might still exist or change. Always verify the latest short term rental regulations and Airbnb license requirements directly with local government authorities for Kirkenes to ensure full compliance before hosting.
(Source: AirROI data, 2025, finding no licensed listings among those analyzed)
Top Performing Airbnb Properties in Kirkenes (2025)
Benchmark your potential! Explore examples of top-performing Airbnb properties in Kirkenesbased on Trailing Twelve Month (TTM) revenue. Analyze their characteristics, revenue, occupancy rate, and ADR to understand what drives success in this market.

3 bedrooms, close to the city center, sauna, rental car offered
Entire Place • 3 bedrooms

Big modern seafront apartment in Kirkenes center
Entire Place • 5 bedrooms

Checkpoint Inn Kirkenes
Entire Place • 1 bedroom
70 sqm apartment in housing cooperative
Entire Place • 2 bedrooms

Nice and newly renovated apartment by the city center
Entire Place • 1 bedroom

Good facilities, 2nd floor
Entire Place • 2 bedrooms
Note: Performance varies based on location, size, amenities, seasonality, and management quality. Data reflects the past 12 months.
Top Performing Airbnb Hosts in Kirkenes (2025)
Learn from the best! This table showcases top-performing Airbnb hosts in Kirkenes based on the number of properties managed and estimated total revenue over the past year. Analyze their scale and performance metrics.
| Host Name | Properties | Grossing Revenue | Stay Reviews | Avg Rating |
|---|---|---|---|---|
| Kamilla | 2 | $81,825 | 188 | 4.88/5.0 |
| Lars Petter | 1 | $43,140 | 34 | 4.91/5.0 |
| Atle | 1 | $38,741 | 201 | 4.96/5.0 |
| Hege | 1 | $36,468 | 7 | 4.86/5.0 |
| Tove Irene | 1 | $30,099 | 33 | 4.82/5.0 |
| Nikolay | 1 | $22,509 | 83 | 4.81/5.0 |
| Monika | 1 | $22,037 | 134 | 4.83/5.0 |
| Stein | 1 | $21,462 | 14 | 4.86/5.0 |
| Gunnhild J. | 1 | $19,067 | 124 | 4.85/5.0 |
| Alf Martin | 1 | $17,258 | 18 | 5.00/5.0 |
Analyzing the strategies of top hosts, such as their property selection, pricing, and guest communication, can offer valuable lessons for optimizing your own Airbnb operations in Kirkenes.
Dive Deeper: Advanced Kirkenes STR Market Data (2025)
Ready to unlock more insights? AirROI provides access to advanced metrics and comprehensive Airbnb data for Kirkenes. Explore detailed analytics beyond this report to refine your investment strategy, optimize pricing, and maximize your vacation rental profits.
Explore Advanced MetricsKirkenes Short-Term Rental Market Composition (2025): Property & Room Types
Room Type Distribution
Property Type Distribution
Market Composition Insights for Kirkenes
- The Kirkenes Airbnb market composition is heavily skewed towards Entire Home/Apt listings, which make up 100% of the 19 active rentals. This indicates strong guest preference for privacy and space.
- Looking at the property type distribution in Kirkenes, Apartment/Condo properties are the most common (78.9%), reflecting the local real estate landscape.
- Houses represent a significant 21.1% portion, catering likely to families or larger groups.
Kirkenes Airbnb Room Capacity Analysis (2025): Bedroom Distribution
Distribution of Listings by Number of Bedrooms
Room Capacity Insights for Kirkenes
- The dominant room capacity in Kirkenes is 2 bedrooms listings, making up 47.4% of the market. This suggests a strong demand for properties suitable for couples or solo travelers.
- Together, 2 bedrooms and 1 bedroom properties represent 84.2% of the active Airbnb listings in Kirkenes, indicating a high concentration in these sizes.
Kirkenes Vacation Rental Guest Capacity Trends (2025)
Distribution of Listings by Guest Capacity
Guest Capacity Insights for Kirkenes
- The most common guest capacity trend in Kirkenes vacation rentals is listings accommodating 4 guests (42.1%). This suggests the primary traveler segment is likely small families or groups.
- Properties designed for 4 guests and 3 guests dominate the Kirkenes STR market, accounting for 68.4% of listings.
- 10.6% of properties accommodate 6+ guests, serving the market segment for larger families or group travel in Kirkenes.
- On average, properties in Kirkenes are equipped to host 3.7 guests.
Kirkenes Airbnb Booking Patterns (2025): Available vs. Booked Days
Available Days Distribution
Booked Days Distribution
Booking Pattern Insights for Kirkenes
- The most common availability pattern in Kirkenes falls within the 181-270 days range, representing 42.1% of listings. This suggests many properties have significant open periods on their calendars.
- Approximately 63.2% of listings show high availability (181+ days open annually), indicating potential for increased bookings or specific owner usage patterns.
- For booked days, the 91-180 days range is most frequent in Kirkenes (42.1%), reflecting common guest stay durations or potential owner blocking patterns.
- A notable 36.8% of properties secure long booking periods (181+ days booked per year), highlighting successful long-term rental strategies or significant owner usage.
Kirkenes Airbnb Minimum Stay Requirements Analysis
Distribution of Listings by Minimum Night Requirement
1 Night
8 listings
42.1% of total
2 Nights
6 listings
31.6% of total
30+ Nights
5 listings
26.3% of total
Key Insights
- The most prevalent minimum stay requirement in Kirkenes is 1 Night, adopted by 42.1% of listings. This highlights the market's preference for shorter, flexible bookings.
- A strong majority (73.7%) of the Kirkenes Airbnb data shows acceptance of very short stays (1-2 nights), indicating a dynamic, high-turnover market.
- A significant segment (26.3%) caters to monthly stays (30+ nights) in Kirkenes, pointing to opportunities in the extended-stay market.
Recommendations
- Align with the market by considering a 1 Night minimum stay, as 42.1% of Kirkenes hosts use this setting.
- Explore offering discounts for stays of 30+ nights to attract the 26.3% of the market seeking extended stays.
- Adjust minimum nights based on seasonality – potentially shorter during low season and longer during peak demand periods in Kirkenes.
Kirkenes Airbnb Cancellation Policy Trends Analysis (2025)
Limited
1 listings
5.3% of total
Flexible
10 listings
52.6% of total
Moderate
5 listings
26.3% of total
Firm
3 listings
15.8% of total
Cancellation Policy Insights for Kirkenes
- The prevailing Airbnb cancellation policy trend in Kirkenes is Flexible, used by 52.6% of listings.
- The market strongly favors guest-friendly terms, with 78.9% of listings offering Flexible or Moderate policies. This suggests guests in Kirkenes may expect booking flexibility.
Recommendations for Hosts
- Consider adopting a Flexible policy to align with the 52.6% market standard in Kirkenes.
- Given the high prevalence of Flexible policies (52.6%), offering this can enhance booking appeal, especially during shoulder seasons.
- Regularly review your cancellation policy against competitors and market demand shifts in Kirkenes.
Kirkenes STR Booking Lead Time Analysis (2025)
Average Booking Lead Time by Month
Booking Lead Time Insights for Kirkenes
- The overall average booking lead time for vacation rentals in Kirkenes is 52 days.
- Guests book furthest in advance for stays during July (average 75 days), likely coinciding with peak travel demand or local events.
- The shortest booking windows occur for stays in April (average 31 days), indicating more last-minute travel plans during this time.
- Seasonally, Winter (58 days avg.) sees the longest lead times, while Fall (44 days avg.) has the shortest, reflecting typical travel planning cycles.
Recommendations for Hosts
- Use the overall average lead time (52 days) as a baseline for your pricing and availability strategy in Kirkenes.
- For July stays, consider implementing length-of-stay discounts or slightly higher rates for bookings made less than 75 days out to capitalize on advance planning.
- Target marketing efforts for the Winter season well in advance (at least 58 days) to capture early planners.
- Monitor your own booking lead times against these Kirkenes averages to identify opportunities for dynamic pricing adjustments.
Popular & Essential Airbnb Amenities in Kirkenes (2025)
Amenity Prevalence
Amenity Insights for Kirkenes
- Essential amenities in Kirkenes that guests expect include: Kitchen, Smoke alarm, Wifi, Dishes and silverware, TV. Lacking these (any) could significantly impact bookings.
- Popular amenities like Heating, Fire extinguisher, Refrigerator are common but not universal. Offering these can provide a competitive edge.
Recommendations for Hosts
- Ensure your listing includes all essential amenities for Kirkenes: Kitchen, Smoke alarm, Wifi, Dishes and silverware, TV.
- Consider adding popular differentiators like Heating or Fire extinguisher to increase appeal.
- Highlight unique or less common amenities you offer (e.g., hot tub, dedicated workspace, EV charger) in your listing description and photos.
- Regularly check competitor amenities in Kirkenes to stay competitive.
Kirkenes Airbnb Guest Demographics & Profile Analysis (2025)
Guest Profile Summary for Kirkenes
- The typical guest profile for Airbnb in Kirkenes consists of predominantly international visitors (69%), with top international origins including United States, typically belonging to the Post-2000s (Gen Z/Alpha) group (50%), primarily speaking English or Norwegian.
- Domestic travelers account for 31.0% of guests.
- Key international markets include Norway (31%) and United States (11.2%).
- Top languages spoken are English (39.5%) followed by Norwegian (10.3%).
- A significant demographic segment is the Post-2000s (Gen Z/Alpha) group, representing 50% of guests.
Recommendations for Hosts
- Focus marketing internationally, particularly towards travelers from United States.
- Tailor amenities and listing descriptions to appeal to the dominant Post-2000s (Gen Z/Alpha) demographic (e.g., highlight fast WiFi, smart home features, local guides).
- Highlight unique local experiences or amenities relevant to the primary guest profile.
- Consider seasonal promotions aligned with peak travel times for key origin markets.
Nearby Short-Term Rental Market Comparison
How does the Kirkenes Airbnb market stack up against its neighbors? Compare key performance metrics like average monthly revenue, ADR, and occupancy rates in surrounding areas to understand the broader regional STR landscape.
| Market | Active Properties | Monthly Revenue | Daily Rate | Avg. Occupancy |
|---|---|---|---|---|
| South Varanki | 23 | $794 | $137.48 | 29% |
| Vadsø | 22 | $612 | $107.30 | 34% |
| Vestre Jakobselv - Ánnejohka - Annijoki | 12 | $420 | $104.89 | 24% |