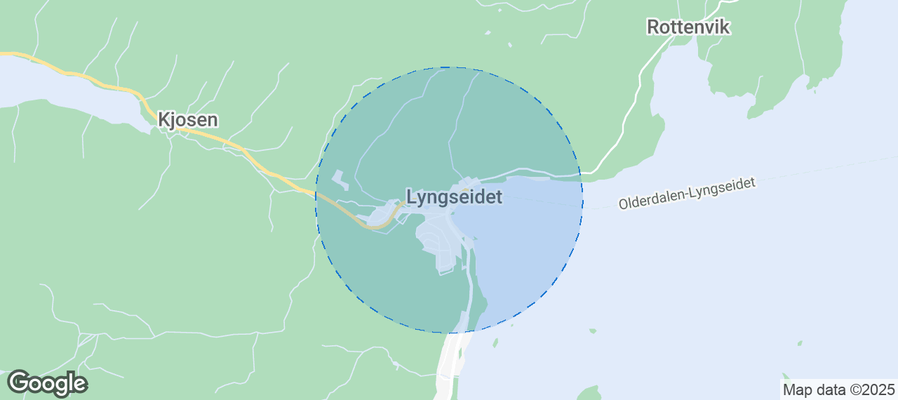
Lyngseidet Airbnb Market Analysis 2026: Short Term Rental Data & Vacation Rental Statistics in Troms og Finnmark, Norway
Is Airbnb profitable in Lyngseidet in 2026? Explore comprehensive Airbnb analytics for Lyngseidet, Troms og Finnmark, Norway to uncover income potential. This 2026 STR market report for Lyngseidet, based on AirROI data from February 2025 to January 2026, reveals key trends in the niche market of 19 active listings.
Whether you're considering an Airbnb investment in Lyngseidet, optimizing your existing vacation rental, or exploring rental arbitrage opportunities, understanding the Lyngseidet Airbnb data is crucial. Leveraging the low regulation environment is key to maximizing your short term rental income potential. Let's dive into the specifics.
Key Lyngseidet Airbnb Performance Metrics Overview
Monthly Airbnb Revenue Variations & Income Potential in Lyngseidet (2026)
Understanding the monthly revenue variations for Airbnb listings in Lyngseidet is key to maximizing your short term rental income potential. Seasonality significantly impacts earnings. Our analysis, based on data from the past 12 months, shows that the peak revenue month for STRs in Lyngseidet is typically March, while June often presents the lowest earnings, highlighting opportunities for strategic pricing adjustments during shoulder and low seasons. Explore the typical Airbnb income in Lyngseidet across different performance tiers:
- Best-in-class properties (Top 10%) achieve $4,998+ monthly, often utilizing dynamic pricing and superior guest experiences.
- Strong performing properties (Top 25%) earn $3,245 or more, indicating effective management and desirable locations/amenities.
- Typical properties (Median) generate around $2,047 per month, representing the average market performance.
- Entry-level properties (Bottom 25%) see earnings around $1,229, often with potential for optimization.
Average Monthly Airbnb Earnings Trend in Lyngseidet
Lyngseidet Airbnb Occupancy Rate Trends (2026)
Maximize your bookings by understanding the Lyngseidet STR occupancy trends. Seasonal demand shifts significantly influence how often properties are booked. Typically, Aprilsees the highest demand (peak season occupancy), while May experiences the lowest (low season). Effective strategies, like adjusting minimum stays or offering promotions, can boost occupancy during slower periods. Here's how different property tiers perform in Lyngseidet:
- Best-in-class properties (Top 10%) achieve 68%+ occupancy, indicating high desirability and potentially optimized availability.
- Strong performing properties (Top 25%) maintain 47% or higher occupancy, suggesting good market fit and guest satisfaction.
- Typical properties (Median) have an occupancy rate around 34%.
- Entry-level properties (Bottom 25%) average 21% occupancy, potentially facing higher vacancy.
Average Monthly Occupancy Rate Trend in Lyngseidet
Average Daily Rate (ADR) Airbnb Trends in Lyngseidet (2026)
Effective short term rental pricing strategy in Lyngseidet involves understanding monthly ADR fluctuations. The Average Daily Rate (ADR) for Airbnb in Lyngseidet typically peaks in December and dips lowest during February. Leveraging Airbnb dynamic pricing tools or strategies based on this seasonality can significantly boost revenue. Here's a look at the typical nightly rates achieved:
- Best-in-class properties (Top 10%) command rates of $375+ per night, often due to premium features or locations.
- Strong performing properties (Top 25%) achieve nightly rates of $247 or more.
- Typical properties (Median) charge around $192 per night.
- Entry-level properties (Bottom 25%) earn around $172 per night.
Average Daily Rate (ADR) Trend by Month in Lyngseidet
Get Live Lyngseidet Market Intelligence 👇
Explore Real-time Analytics
Airbnb Seasonality Analysis & Trends in Lyngseidet (2026)
Peak Season (March, April, July)
- Revenue averages $4,180 per month
- Occupancy rates average 59.4%
- Daily rates average $220
Shoulder Season
- Revenue averages $2,125 per month
- Occupancy maintains around 31.6%
- Daily rates hold near $232
Low Season (May, June, October)
- Revenue drops to average $1,529 per month
- Occupancy decreases to average 24.8%
- Daily rates adjust to average $224
Seasonality Insights for Lyngseidet
- The Airbnb seasonality in Lyngseidet shows highly seasonal trends requiring careful strategy. While the sections above show seasonal averages, it's also insightful to look at the extremes:
- During the high season, the absolute peak month showcases Lyngseidet's highest earning potential, with monthly revenues capable of climbing to $4,821, occupancy reaching a high of 71.8%, and ADRs peaking at $245.
- Conversely, the slowest single month of the year, typically falling within the low season, marks the market's lowest point. In this month, revenue might dip to $1,503, occupancy could drop to 21.4%, and ADRs may adjust down to $209.
- Understanding both the seasonal averages and these monthly peaks and troughs in revenue, occupancy, and ADR is crucial for maximizing your Airbnb profit potential in Lyngseidet.
Seasonal Strategies for Maximizing Profit
- Peak Season: Maximize revenue through premium pricing and potentially longer minimum stays. Ensure high availability.
- Low Season: Offer competitive pricing, special promotions (e.g., extended stay discounts), and flexible cancellation policies. Target off-season travelers like remote workers or budget-conscious guests.
- Shoulder Seasons: Implement dynamic pricing that balances peak and low rates. Target weekend travelers or specific events. Offer slightly more flexible terms than peak season.
- Regularly analyze your own performance against these Lyngseidet seasonality benchmarks and adjust your pricing and availability strategy accordingly.
Best Areas for Airbnb Investment in Lyngseidet (2026)
Exploring the top neighborhoods for short-term rentals in Lyngseidet? This section highlights key areas, outlining why they are attractive for hosts and guests, along with notable local attractions. Consider these locations based on your target guest profile and investment strategy.
| Neighborhood / Area | Why Host Here? (Target Guests & Appeal) | Key Attractions & Landmarks |
|---|---|---|
| Lyngseidet | Lyngseidet is the main village in the Lyngenfjord region, renowned for its breathtaking views of the fjord and surrounding mountains. It serves as a great base for outdoor adventures and attracts tourists year-round, particularly in winter for skiing and in summer for hiking and fishing. | Lyngenfjord, Lyngen Alps, Alpine ski resort at Lyngseidet, Hiking trails, Lyngen Church, Local artisan shops |
| Olden | Olden is famous for its stunning landscapes and proximity to the Briksdal Glacier. Tourists flock to this serene area to experience nature and participate in various outdoor activities, making it a prime location for Airbnb rentals. | Briksdal Glacier, Olden Church, Olden Lake, Fjord cruises, Hiking routes, Waterfalls in the area |
| Trollheimen National Park | This region is known for its rugged terrain, ideal for hikers and nature enthusiasts. Tourists come here to explore the unspoiled nature, making it an attractive location for those looking to host an Airbnb. | Trollheimen Mountains, Hiking trails, Fishing spots, Campgrounds, Scenic viewpoints, Wildlife watching |
| Reisadalen | Reisadalen is known for its dramatic river valley, attracting visitors for both its natural beauty and outdoor activities. The area is perfect for eco-tourism and adventure sports, making it a great place for Airbnb investments. | Reisa National Park, Reisa River, Hiking trails, Canoeing opportunities, Wild salmon fishing, Cultural sites |
| Storfjord | Storfjord offers stunning views and a tranquil atmosphere. It attracts visitors looking for a peaceful retreat, ideal for cabin-style Airbnbs amidst nature. | Storfjord scenery, Fjord tours, Historic farms, Local cuisine, Walking trails, Bird watching |
| Kvaløya | Kvaløya is an island near Tromsø, known for its beautiful landscapes and outdoor activities. It draws tourists for hiking, fishing, and the midnight sun, making it a popular destination for short-term rentals. | Mountains and fjords, Tromsø city access, Fishing villages, Whale watching, Scenic drives, Hiking routes |
| Senja Island | Senja is known as Norway's second largest island, offering diverse landscapes and rich wildlife. It provides an ideal setting for nature lovers and is growing in popularity as a tourist destination, making it ripe for Airbnb opportunities. | Ånderdalen National Park, Senja National Tourist Route, Beaches and fishing spots, Hiking paths, Wildlife viewing, Traditional fishing villages |
| Alta | Alta is known for its impressive rock carvings and the Northern Lights. It attracts history buffs and aurora seekers, making it an interesting location for short-term rentals. | Alta Museum, Northern Lights Cathedral, Rock carvings, Fjord tours, Husky sledding, Cultural experiences |
Understanding Airbnb License Requirements & STR Laws in Lyngseidet (2026)
While Lyngseidet, Troms og Finnmark, Norway currently shows low STR regulations, specific Airbnb license requirements might still exist or change. Always verify the latest short term rental regulations and Airbnb license requirements directly with local government authorities for Lyngseidet to ensure full compliance before hosting.
(Source: AirROI data, 2026, finding no licensed listings among those analyzed)
Top Performing Airbnb Properties in Lyngseidet (2026)
Benchmark your potential! Explore examples of top-performing Airbnb properties in Lyngseidetbased on Trailing Twelve Month (TTM) revenue. Analyze their characteristics, revenue, occupancy rate, and ADR to understand what drives success in this market.

Perfect home for ski tourists! Close to popular mountains
Entire Place • 5 bedrooms

Granny Mary's Home
Entire Place • 4 bedrooms

House with garage in central Lyngen
Entire Place • 5 bedrooms

Lyngen Elements - Larsvoll Gård
Entire Place • 3 bedrooms

Kjosen Lodge, Lyngen.
Entire Place • 3 bedrooms

Lyngen Blue House 4 bedrooms
Entire Place • 5 bedrooms
Note: Performance varies based on location, size, amenities, seasonality, and management quality. Data reflects the past 12 months.
Top Performing Airbnb Hosts in Lyngseidet (2026)
Learn from the best! This table showcases top-performing Airbnb hosts in Lyngseidet based on the number of properties managed and estimated total revenue over the past year. Analyze their scale and performance metrics.
| Host Name | Properties | Grossing Revenue | Stay Reviews | Avg Rating |
|---|---|---|---|---|
| Jim | 1 | $59,121 | 11 | 5.00/5.0 |
| Bente | 1 | $48,013 | 29 | 4.97/5.0 |
| Cato | 1 | $28,611 | 17 | 4.76/5.0 |
| Hanne-Lill | 1 | $28,240 | 49 | 4.96/5.0 |
| Trond | 1 | $28,101 | 74 | 4.99/5.0 |
| Gudrun | 1 | $23,598 | 3 | 5.00/5.0 |
| Anders | 1 | $22,685 | 21 | 4.95/5.0 |
| Øyvind | 1 | $21,731 | 31 | 5.00/5.0 |
| Stig-Arne | 1 | $20,784 | 16 | 4.88/5.0 |
| Victoria | 1 | $20,365 | 6 | 5.00/5.0 |
Analyzing the strategies of top hosts, such as their property selection, pricing, and guest communication, can offer valuable lessons for optimizing your own Airbnb operations in Lyngseidet.
Dive Deeper: Advanced Lyngseidet STR Market Data (2026)
Ready to unlock more insights? AirROI provides access to advanced metrics and comprehensive Airbnb data for Lyngseidet. Explore detailed analytics beyond this report to refine your investment strategy, optimize pricing, and maximize your vacation rental profits.
Explore Advanced MetricsLyngseidet Short-Term Rental Market Composition (2026): Property & Room Types
Room Type Distribution
Property Type Distribution
Market Composition Insights for Lyngseidet
- The Lyngseidet Airbnb market composition is heavily skewed towards Entire Home/Apt listings, which make up 100% of the 19 active rentals. This indicates strong guest preference for privacy and space.
- Looking at the property type distribution in Lyngseidet, House properties are the most common (78.9%), reflecting the local real estate landscape.
- Houses represent a significant 78.9% portion, catering likely to families or larger groups.
Lyngseidet Airbnb Room Capacity Analysis (2026): Bedroom Distribution
Distribution of Listings by Number of Bedrooms
Room Capacity Insights for Lyngseidet
- The dominant room capacity in Lyngseidet is 4 bedrooms listings, making up 36.8% of the market. This suggests a strong demand for properties suitable for families or small groups.
- Together, 4 bedrooms and 5+ bedrooms properties represent 63.1% of the active Airbnb listings in Lyngseidet, indicating a high concentration in these sizes.
- A significant 84.2% of listings offer 3+ bedrooms, catering to larger groups and families seeking more space in Lyngseidet.
Lyngseidet Vacation Rental Guest Capacity Trends (2026)
Distribution of Listings by Guest Capacity
Guest Capacity Insights for Lyngseidet
- The most common guest capacity trend in Lyngseidet vacation rentals is listings accommodating 6 guests (36.8%). This suggests the primary traveler segment is likely larger groups.
- Properties designed for 6 guests and 8+ guests dominate the Lyngseidet STR market, accounting for 68.4% of listings.
- 73.7% of properties accommodate 6+ guests, serving the market segment for larger families or group travel in Lyngseidet.
- On average, properties in Lyngseidet are equipped to host 6.3 guests.
Lyngseidet Airbnb Booking Patterns (2026): Available vs. Booked Days
Available Days Distribution
Booked Days Distribution
Booking Pattern Insights for Lyngseidet
- The most common availability pattern in Lyngseidet falls within the 271-366 days range, representing 52.6% of listings. This suggests many properties have significant open periods on their calendars.
- Approximately 89.4% of listings show high availability (181+ days open annually), indicating potential for increased bookings or specific owner usage patterns.
- For booked days, the 31-90 days range is most frequent in Lyngseidet (42.1%), reflecting common guest stay durations or potential owner blocking patterns.
- A notable 10.5% of properties secure long booking periods (181+ days booked per year), highlighting successful long-term rental strategies or significant owner usage.
Lyngseidet Airbnb Minimum Stay Requirements Analysis
Distribution of Listings by Minimum Night Requirement
1 Night
1 listings
5.3% of total
2 Nights
2 listings
10.5% of total
3 Nights
12 listings
63.2% of total
4-6 Nights
3 listings
15.8% of total
30+ Nights
1 listings
5.3% of total
Key Insights
- The most prevalent minimum stay requirement in Lyngseidet is 3 Nights, adopted by 63.2% of listings. This highlights the market's preference for longer commitments.
- Very short stays (1-2 nights) are less common (15.8%), suggesting hosts prefer slightly longer bookings to optimize turnover.
Recommendations
- Align with the market by considering a 3 Nights minimum stay, as 63.2% of Lyngseidet hosts use this setting.
- If feasible, allowing 1-night stays, especially midweek or during low season, could capture last-minute bookings, as only 5.3% currently do.
- Explore offering discounts for stays of 30+ nights to attract the 5.3% of the market seeking extended stays.
- Adjust minimum nights based on seasonality – potentially shorter during low season and longer during peak demand periods in Lyngseidet.
Lyngseidet Airbnb Cancellation Policy Trends Analysis (2026)
Flexible
2 listings
10.5% of total
Moderate
5 listings
26.3% of total
Firm
7 listings
36.8% of total
Strict
5 listings
26.3% of total
Cancellation Policy Insights for Lyngseidet
- The prevailing Airbnb cancellation policy trend in Lyngseidet is Firm, used by 36.8% of listings.
- A majority (63.1%) of hosts in Lyngseidet utilize Firm or Strict policies, indicating a market where hosts prioritize booking security.
Recommendations for Hosts
- Consider adopting a Firm policy to align with the 36.8% market standard in Lyngseidet.
- Regularly review your cancellation policy against competitors and market demand shifts in Lyngseidet.
Lyngseidet STR Booking Lead Time Analysis (2026)
Average Booking Lead Time by Month
Booking Lead Time Insights for Lyngseidet
- The overall average booking lead time for vacation rentals in Lyngseidet is 75 days.
- Guests book furthest in advance for stays during April (average 112 days), likely coinciding with peak travel demand or local events.
- The shortest booking windows occur for stays in February (average 37 days), indicating more last-minute travel plans during this time.
- Seasonally, Spring (89 days avg.) sees the longest lead times, while Winter (53 days avg.) has the shortest, reflecting typical travel planning cycles.
Recommendations for Hosts
- Use the overall average lead time (75 days) as a baseline for your pricing and availability strategy in Lyngseidet.
- For April stays, consider implementing length-of-stay discounts or slightly higher rates for bookings made less than 112 days out to capitalize on advance planning.
- Target marketing efforts for the Spring season well in advance (at least 89 days) to capture early planners.
- Monitor your own booking lead times against these Lyngseidet averages to identify opportunities for dynamic pricing adjustments.
Popular & Essential Airbnb Amenities in Lyngseidet (2026)
Amenity Prevalence
Amenity Insights for Lyngseidet
- Essential amenities in Lyngseidet that guests expect include: Smoke alarm, Free parking on premises, Cooking basics, Fire extinguisher, Kitchen, Refrigerator, Heating. Lacking these (any) could significantly impact bookings.
- Popular amenities like Oven, Stove, Bed linens are common but not universal. Offering these can provide a competitive edge.
Recommendations for Hosts
- Ensure your listing includes all essential amenities for Lyngseidet: Smoke alarm, Free parking on premises, Cooking basics, Fire extinguisher, Kitchen, Refrigerator, Heating.
- Consider adding popular differentiators like Oven or Stove to increase appeal.
- Highlight unique or less common amenities you offer (e.g., hot tub, dedicated workspace, EV charger) in your listing description and photos.
- Regularly check competitor amenities in Lyngseidet to stay competitive.
Lyngseidet Airbnb Guest Demographics & Profile Analysis (2026)
Guest Profile Summary for Lyngseidet
- The typical guest profile for Airbnb in Lyngseidet consists of predominantly international visitors (99%), with top international origins including Germany, typically belonging to the Post-2000s (Gen Z/Alpha) group (50%), primarily speaking English or German.
- Domestic travelers account for 1.3% of guests.
- Key international markets include Finland (22.4%) and Germany (15.8%).
- Top languages spoken are English (37.8%) followed by German (20%).
- A significant demographic segment is the Post-2000s (Gen Z/Alpha) group, representing 50% of guests.
Recommendations for Hosts
- Focus marketing internationally, particularly towards travelers from Germany.
- Tailor amenities and listing descriptions to appeal to the dominant Post-2000s (Gen Z/Alpha) demographic (e.g., highlight fast WiFi, smart home features, local guides).
- Highlight unique local experiences or amenities relevant to the primary guest profile.
- Consider seasonal promotions aligned with peak travel times for key origin markets.
Nearby Short-Term Rental Market Comparison
How does the Lyngseidet Airbnb market stack up against its neighbors? Compare key performance metrics like average monthly revenue, ADR, and occupancy rates in surrounding areas to understand the broader regional STR landscape.