Bø Airbnb Market Analysis 2026: Short Term Rental Data & Vacation Rental Statistics in Vestfold og Telemark, Norway
Is Airbnb profitable in Bø in 2026? Explore comprehensive Airbnb analytics for Bø, Vestfold og Telemark, Norway to uncover income potential. This 2026 STR market report for Bø, based on AirROI data from February 2025 to January 2026, reveals key trends in the niche market of 25 active listings.
Whether you're considering an Airbnb investment in Bø, optimizing your existing vacation rental, or exploring rental arbitrage opportunities, understanding the Bø Airbnb data is crucial. Leveraging the low regulation environment is key to maximizing your short term rental income potential. Let's dive into the specifics.
Key Bø Airbnb Performance Metrics Overview
Monthly Airbnb Revenue Variations & Income Potential in Bø (2026)
Understanding the monthly revenue variations for Airbnb listings in Bø is key to maximizing your short term rental income potential. Seasonality significantly impacts earnings. Our analysis, based on data from the past 12 months, shows that the peak revenue month for STRs in Bø is typically July, while November often presents the lowest earnings, highlighting opportunities for strategic pricing adjustments during shoulder and low seasons. Explore the typical Airbnb income in Bø across different performance tiers:
- Best-in-class properties (Top 10%) achieve $3,212+ monthly, often utilizing dynamic pricing and superior guest experiences.
- Strong performing properties (Top 25%) earn $1,967 or more, indicating effective management and desirable locations/amenities.
- Typical properties (Median) generate around $1,129 per month, representing the average market performance.
- Entry-level properties (Bottom 25%) see earnings around $482, often with potential for optimization.
Average Monthly Airbnb Earnings Trend in Bø
Bø Airbnb Occupancy Rate Trends (2026)
Maximize your bookings by understanding the Bø STR occupancy trends. Seasonal demand shifts significantly influence how often properties are booked. Typically, Julysees the highest demand (peak season occupancy), while January experiences the lowest (low season). Effective strategies, like adjusting minimum stays or offering promotions, can boost occupancy during slower periods. Here's how different property tiers perform in Bø:
- Best-in-class properties (Top 10%) achieve 54%+ occupancy, indicating high desirability and potentially optimized availability.
- Strong performing properties (Top 25%) maintain 39% or higher occupancy, suggesting good market fit and guest satisfaction.
- Typical properties (Median) have an occupancy rate around 20%.
- Entry-level properties (Bottom 25%) average 10% occupancy, potentially facing higher vacancy.
Average Monthly Occupancy Rate Trend in Bø
Average Daily Rate (ADR) Airbnb Trends in Bø (2026)
Effective short term rental pricing strategy in Bø involves understanding monthly ADR fluctuations. The Average Daily Rate (ADR) for Airbnb in Bø typically peaks in October and dips lowest during March. Leveraging Airbnb dynamic pricing tools or strategies based on this seasonality can significantly boost revenue. Here's a look at the typical nightly rates achieved:
- Best-in-class properties (Top 10%) command rates of $262+ per night, often due to premium features or locations.
- Strong performing properties (Top 25%) achieve nightly rates of $204 or more.
- Typical properties (Median) charge around $156 per night.
- Entry-level properties (Bottom 25%) earn around $121 per night.
Average Daily Rate (ADR) Trend by Month in Bø
Get Live Bø Market Intelligence 👇

Explore Real-time Analytics
Airbnb Seasonality Analysis & Trends in Bø (2026)
Peak Season (July, June, August)
- Revenue averages $2,501 per month
- Occupancy rates average 41.4%
- Daily rates average $166
Shoulder Season
- Revenue averages $1,250 per month
- Occupancy maintains around 24.6%
- Daily rates hold near $164
Low Season (January, September, November)
- Revenue drops to average $602 per month
- Occupancy decreases to average 13.9%
- Daily rates adjust to average $179
Seasonality Insights for Bø
- The Airbnb seasonality in Bø shows highly seasonal trends requiring careful strategy. While the sections above show seasonal averages, it's also insightful to look at the extremes:
- During the high season, the absolute peak month showcases Bø's highest earning potential, with monthly revenues capable of climbing to $2,793, occupancy reaching a high of 45.2%, and ADRs peaking at $180.
- Conversely, the slowest single month of the year, typically falling within the low season, marks the market's lowest point. In this month, revenue might dip to $440, occupancy could drop to 10.8%, and ADRs may adjust down to $155.
- Understanding both the seasonal averages and these monthly peaks and troughs in revenue, occupancy, and ADR is crucial for maximizing your Airbnb profit potential in Bø.
Seasonal Strategies for Maximizing Profit
- Peak Season: Maximize revenue through premium pricing and potentially longer minimum stays. Ensure high availability.
- Low Season: Offer competitive pricing, special promotions (e.g., extended stay discounts), and flexible cancellation policies. Target off-season travelers like remote workers or budget-conscious guests.
- Shoulder Seasons: Implement dynamic pricing that balances peak and low rates. Target weekend travelers or specific events. Offer slightly more flexible terms than peak season.
- Regularly analyze your own performance against these Bø seasonality benchmarks and adjust your pricing and availability strategy accordingly.
Best Areas for Airbnb Investment in Bø (2026)
Exploring the top neighborhoods for short-term rentals in Bø? This section highlights key areas, outlining why they are attractive for hosts and guests, along with notable local attractions. Consider these locations based on your target guest profile and investment strategy.
| Neighborhood / Area | Why Host Here? (Target Guests & Appeal) | Key Attractions & Landmarks |
|---|---|---|
| Bø Town Center | The vibrant heart of Bø, offering a mix of culture, dining, and shopping. Ideal for tourists looking for convenience and local experiences. | Telemark Museum, Bø Library, Bø Church, local cafes and restaurants, Bø Market |
| Lake Bø | A scenic spot perfect for outdoor enthusiasts. Attracts visitors for fishing, boating, and relaxation amidst nature. | Bø Lake, fishing spots, hiking trails, picnic areas, water sports activities |
| Bø Sommarland | Norway's largest water park draws families seeking fun and adventure. A prime spot for summer vacation rentals. | Water slides and pools, Amusement rides, Mini-golf, Playgrounds, Food stalls |
| Norsjø | Beautiful lakeside area offering a tranquil getaway for those looking to escape the hustle and bustle. | Norsjø Marina, boating and fishing, lakeside walking paths, camping areas, scenic views |
| Seljord | Nearby Seljord is famous for its stunning scenery and Seljord Lake, making it a great spot for a nature getaway. | Seljord Lake, hiking trails, local folklore and history, Seljord Stadfest, beautiful landscapes |
| Gvarv | A charming village known for its fruit farms and agricultural tourism. Great for those looking to experience rural Norway. | Gvarv Fruit Farm, local markets, scenic countryside, Bø og Gvarv Smaaby, cultural festivals |
| Lundeby | A peaceful rural area with access to nature and outdoor activities, suited for those looking for tranquility. | hiking trails, nature reserves, outdoor sports, local wildlife, farm experiences |
| Telemark Canal | A historical waterway that offers beautiful scenery and activities such as boating and cycling along the canals. | Telemark Canal, boat tours, biking paths, historical locks, quaint villages along the canal |
Understanding Airbnb License Requirements & STR Laws in Bø (2026)
While Bø, Vestfold og Telemark, Norway currently shows low STR regulations, specific Airbnb license requirements might still exist or change. Always verify the latest short term rental regulations and Airbnb license requirements directly with local government authorities for Bø to ensure full compliance before hosting.
(Source: AirROI data, 2026, finding no licensed listings among those analyzed)
Top Performing Airbnb Properties in Bø (2026)
Benchmark your potential! Explore examples of top-performing Airbnb properties in Bøbased on Trailing Twelve Month (TTM) revenue. Analyze their characteristics, revenue, occupancy rate, and ADR to understand what drives success in this market.
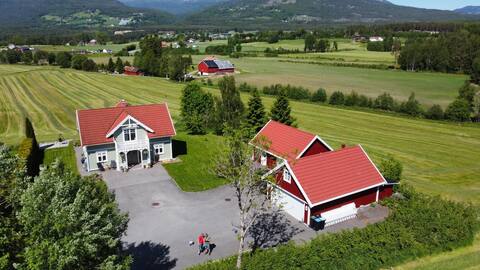
Idyllic country estate by Sommarland in Bø
Entire Place • 4 bedrooms
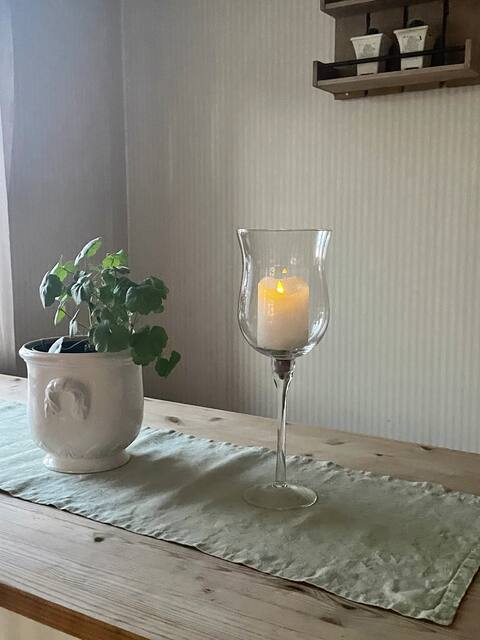
Cozy old house on a farm
Entire Place • 3 bedrooms
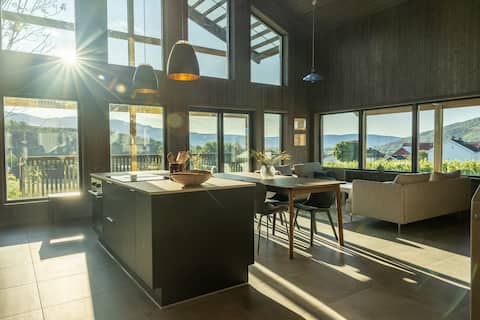
Detached house on quiet courtyard
Entire Place • 7 bedrooms
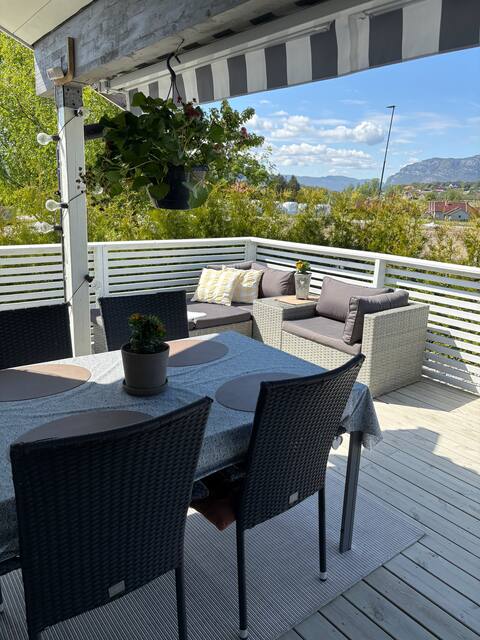
Detached house in Bø ,5minto Sommarland, 500m to the city center
Entire Place • 4 bedrooms
House with large garden and pool for rent in Bø
Entire Place • 4 bedrooms
Holiday idyll in Bø
Entire Place • 4 bedrooms
Note: Performance varies based on location, size, amenities, seasonality, and management quality. Data reflects the past 12 months.
Top Performing Airbnb Hosts in Bø (2026)
Learn from the best! This table showcases top-performing Airbnb hosts in Bø based on the number of properties managed and estimated total revenue over the past year. Analyze their scale and performance metrics.
| Host Name | Properties | Grossing Revenue | Stay Reviews | Avg Rating |
|---|---|---|---|---|
| Elisabeth Gjærum | 2 | $30,409 | 23 | 4.97/5.0 |
| Aase Ragnhild | 1 | $22,556 | 47 | 4.89/5.0 |
| Helga Kristine | 1 | $20,529 | 7 | 5.00/5.0 |
| Marthe | 1 | $18,661 | 25 | 4.92/5.0 |
| Kine & Morten | 1 | $17,761 | 3 | 5.00/5.0 |
| Birger | 1 | $16,465 | 8 | 4.88/5.0 |
| Iver | 1 | $15,659 | 8 | 5.00/5.0 |
| Kristin Karlbom | 1 | $9,836 | 61 | 4.74/5.0 |
| Lise | 1 | $9,780 | 29 | 4.97/5.0 |
| Caroline | 1 | $8,889 | 35 | 4.46/5.0 |
Analyzing the strategies of top hosts, such as their property selection, pricing, and guest communication, can offer valuable lessons for optimizing your own Airbnb operations in Bø.
Dive Deeper: Advanced Bø STR Market Data (2026)
Ready to unlock more insights? AirROI provides access to advanced metrics and comprehensive Airbnb data for Bø. Explore detailed analytics beyond this report to refine your investment strategy, optimize pricing, and maximize your vacation rental profits.
Explore Advanced MetricsBø Short-Term Rental Market Composition (2026): Property & Room Types
Room Type Distribution
Property Type Distribution
Market Composition Insights for Bø
- The Bø Airbnb market composition is heavily skewed towards Entire Home/Apt listings, which make up 100% of the 25 active rentals. This indicates strong guest preference for privacy and space.
- Looking at the property type distribution in Bø, House properties are the most common (48%), reflecting the local real estate landscape.
- Houses represent a significant 48% portion, catering likely to families or larger groups.
- Smaller segments like hotel/boutique (combined 4.0%) offer potential for unique stay experiences.
Bø Airbnb Room Capacity Analysis (2026): Bedroom Distribution
Distribution of Listings by Number of Bedrooms
Room Capacity Insights for Bø
- The dominant room capacity in Bø is 3 bedrooms listings, making up 28% of the market. This suggests a strong demand for properties suitable for families or small groups.
- Together, 3 bedrooms and 4 bedrooms properties represent 56.0% of the active Airbnb listings in Bø, indicating a high concentration in these sizes.
- A significant 64.0% of listings offer 3+ bedrooms, catering to larger groups and families seeking more space in Bø.
Bø Vacation Rental Guest Capacity Trends (2026)
Distribution of Listings by Guest Capacity
Guest Capacity Insights for Bø
- The most common guest capacity trend in Bø vacation rentals is listings accommodating 8+ guests (24%). This suggests the primary traveler segment is likely larger groups.
- Properties designed for 8+ guests and 6 guests dominate the Bø STR market, accounting for 48.0% of listings.
- 60.0% of properties accommodate 6+ guests, serving the market segment for larger families or group travel in Bø.
- On average, properties in Bø are equipped to host 5.9 guests.
Bø Airbnb Booking Patterns (2026): Available vs. Booked Days
Available Days Distribution
Booked Days Distribution
Booking Pattern Insights for Bø
- The most common availability pattern in Bø falls within the 271-366 days range, representing 84% of listings. This suggests many properties have significant open periods on their calendars.
- Approximately 96.0% of listings show high availability (181+ days open annually), indicating potential for increased bookings or specific owner usage patterns.
- For booked days, the 31-90 days range is most frequent in Bø (48%), reflecting common guest stay durations or potential owner blocking patterns.
- A notable 4.0% of properties secure long booking periods (181+ days booked per year), highlighting successful long-term rental strategies or significant owner usage.
Bø Airbnb Minimum Stay Requirements Analysis
Distribution of Listings by Minimum Night Requirement
1 Night
8 listings
32% of total
2 Nights
6 listings
24% of total
3 Nights
1 listings
4% of total
4-6 Nights
1 listings
4% of total
7-29 Nights
1 listings
4% of total
30+ Nights
8 listings
32% of total
Key Insights
- The most prevalent minimum stay requirement in Bø is 1 Night, adopted by 32% of listings. This highlights the market's preference for shorter, flexible bookings.
- A significant segment (32%) caters to monthly stays (30+ nights) in Bø, pointing to opportunities in the extended-stay market.
Recommendations
- Align with the market by considering a 1 Night minimum stay, as 32% of Bø hosts use this setting.
- Explore offering discounts for stays of 30+ nights to attract the 32% of the market seeking extended stays.
- Adjust minimum nights based on seasonality – potentially shorter during low season and longer during peak demand periods in Bø.
Bø Airbnb Cancellation Policy Trends Analysis (2026)
Flexible
10 listings
40% of total
Moderate
9 listings
36% of total
Firm
6 listings
24% of total
Cancellation Policy Insights for Bø
- The prevailing Airbnb cancellation policy trend in Bø is Flexible, used by 40% of listings.
- The market strongly favors guest-friendly terms, with 76.0% of listings offering Flexible or Moderate policies. This suggests guests in Bø may expect booking flexibility.
Recommendations for Hosts
- Consider adopting a Flexible policy to align with the 40% market standard in Bø.
- Regularly review your cancellation policy against competitors and market demand shifts in Bø.
Bø STR Booking Lead Time Analysis (2026)
Average Booking Lead Time by Month
Booking Lead Time Insights for Bø
- The overall average booking lead time for vacation rentals in Bø is 53 days.
- Guests book furthest in advance for stays during June (average 67 days), likely coinciding with peak travel demand or local events.
- The shortest booking windows occur for stays in March (average 10 days), indicating more last-minute travel plans during this time.
- Seasonally, Summer (54 days avg.) sees the longest lead times, while Fall (29 days avg.) has the shortest, reflecting typical travel planning cycles.
Recommendations for Hosts
- Use the overall average lead time (53 days) as a baseline for your pricing and availability strategy in Bø.
- For June stays, consider implementing length-of-stay discounts or slightly higher rates for bookings made less than 67 days out to capitalize on advance planning.
- During March, focus on last-minute booking availability and promotions, as guests book with very short notice (10 days avg.).
- Target marketing efforts for the Summer season well in advance (at least 54 days) to capture early planners.
- Monitor your own booking lead times against these Bø averages to identify opportunities for dynamic pricing adjustments.
Popular & Essential Airbnb Amenities in Bø (2026)
Amenity Prevalence
Amenity Insights for Bø
- Essential amenities in Bø that guests expect include: Free parking on premises, Smoke alarm, Fire extinguisher, Kitchen. Lacking these (any) could significantly impact bookings.
- Popular amenities like Hot water, Wifi, Heating are common but not universal. Offering these can provide a competitive edge.
- Warning: Wifi is not universally provided but is considered essential globally. Ensure reliable Wifi is offered.
Recommendations for Hosts
- Ensure your listing includes all essential amenities for Bø: Free parking on premises, Smoke alarm, Fire extinguisher, Kitchen.
- Prioritize adding missing essentials: Kitchen.
- Consider adding popular differentiators like Hot water or Wifi to increase appeal.
- Highlight unique or less common amenities you offer (e.g., hot tub, dedicated workspace, EV charger) in your listing description and photos.
- Regularly check competitor amenities in Bø to stay competitive.
Bø Airbnb Guest Demographics & Profile Analysis (2026)
Guest Profile Summary for Bø
- The typical guest profile for Airbnb in Bø consists of primarily domestic travelers (73%), often arriving from nearby Oslo, typically belonging to the Post-2000s (Gen Z/Alpha) group (50%), primarily speaking Norwegian or English.
- Domestic travelers account for 73.4% of guests.
- Key international markets include Norway (73.4%) and Denmark (4.7%).
- Top languages spoken are Norwegian (38.9%) followed by English (38.9%).
- A significant demographic segment is the Post-2000s (Gen Z/Alpha) group, representing 50% of guests.
Recommendations for Hosts
- Target domestic marketing efforts towards travelers from Oslo and Stavanger.
- Tailor amenities and listing descriptions to appeal to the dominant Post-2000s (Gen Z/Alpha) demographic (e.g., highlight fast WiFi, smart home features, local guides).
- Highlight unique local experiences or amenities relevant to the primary guest profile.
- Consider seasonal promotions aligned with peak travel times for key origin markets.
Nearby Short-Term Rental Market Comparison
How does the Bø Airbnb market stack up against its neighbors? Compare key performance metrics like average monthly revenue, ADR, and occupancy rates in surrounding areas to understand the broader regional STR landscape.
| Market | Active Properties | Monthly Revenue | Daily Rate | Avg. Occupancy |
|---|---|---|---|---|
| Frogner | 12 | $2,195 | $212.41 | 60% |
| Vierli | 22 | $2,005 | $228.93 | 37% |
| Krødsherad | 88 | $1,912 | $236.11 | 33% |
| Sentrum | 20 | $1,876 | $187.93 | 47% |
| Hemsedal | 330 | $1,809 | $315.25 | 32% |
| Modum | 26 | $1,730 | $182.90 | 36% |
| Sundvollen | 13 | $1,683 | $210.56 | 40% |
| Flå | 93 | $1,640 | $236.86 | 30% |
| Flekkerøy | 41 | $1,603 | $218.05 | 40% |
| Frogn | 53 | $1,568 | $233.43 | 38% |