Aurlandsvangen Airbnb Market Analysis 2026: Short Term Rental Data & Vacation Rental Statistics in Vestland, Norway
Is Airbnb profitable in Aurlandsvangen in 2026? Explore comprehensive Airbnb analytics for Aurlandsvangen, Vestland, Norway to uncover income potential. This 2026 STR market report for Aurlandsvangen, based on AirROI data from February 2025 to January 2026, reveals key trends in the niche market of 21 active listings.
Whether you're considering an Airbnb investment in Aurlandsvangen, optimizing your existing vacation rental, or exploring rental arbitrage opportunities, understanding the Aurlandsvangen Airbnb data is crucial. Leveraging the low regulation environment is key to maximizing your short term rental income potential. Let's dive into the specifics.
Key Aurlandsvangen Airbnb Performance Metrics Overview
Monthly Airbnb Revenue Variations & Income Potential in Aurlandsvangen (2026)
Understanding the monthly revenue variations for Airbnb listings in Aurlandsvangen is key to maximizing your short term rental income potential. Seasonality significantly impacts earnings. Our analysis, based on data from the past 12 months, shows that the peak revenue month for STRs in Aurlandsvangen is typically August, while January often presents the lowest earnings, highlighting opportunities for strategic pricing adjustments during shoulder and low seasons. Explore the typical Airbnb income in Aurlandsvangen across different performance tiers:
- Best-in-class properties (Top 10%) achieve $8,605+ monthly, often utilizing dynamic pricing and superior guest experiences.
- Strong performing properties (Top 25%) earn $6,002 or more, indicating effective management and desirable locations/amenities.
- Typical properties (Median) generate around $3,816 per month, representing the average market performance.
- Entry-level properties (Bottom 25%) see earnings around $2,763, often with potential for optimization.
Average Monthly Airbnb Earnings Trend in Aurlandsvangen
Aurlandsvangen Airbnb Occupancy Rate Trends (2026)
Maximize your bookings by understanding the Aurlandsvangen STR occupancy trends. Seasonal demand shifts significantly influence how often properties are booked. Typically, Augustsees the highest demand (peak season occupancy), while January experiences the lowest (low season). Effective strategies, like adjusting minimum stays or offering promotions, can boost occupancy during slower periods. Here's how different property tiers perform in Aurlandsvangen:
- Best-in-class properties (Top 10%) achieve 88%+ occupancy, indicating high desirability and potentially optimized availability.
- Strong performing properties (Top 25%) maintain 78% or higher occupancy, suggesting good market fit and guest satisfaction.
- Typical properties (Median) have an occupancy rate around 62%.
- Entry-level properties (Bottom 25%) average 41% occupancy, potentially facing higher vacancy.
Average Monthly Occupancy Rate Trend in Aurlandsvangen
Average Daily Rate (ADR) Airbnb Trends in Aurlandsvangen (2026)
Effective short term rental pricing strategy in Aurlandsvangen involves understanding monthly ADR fluctuations. The Average Daily Rate (ADR) for Airbnb in Aurlandsvangen typically peaks in September and dips lowest during February. Leveraging Airbnb dynamic pricing tools or strategies based on this seasonality can significantly boost revenue. Here's a look at the typical nightly rates achieved:
- Best-in-class properties (Top 10%) command rates of $448+ per night, often due to premium features or locations.
- Strong performing properties (Top 25%) achieve nightly rates of $341 or more.
- Typical properties (Median) charge around $234 per night.
- Entry-level properties (Bottom 25%) earn around $149 per night.
Average Daily Rate (ADR) Trend by Month in Aurlandsvangen
Get Live Aurlandsvangen Market Intelligence 👇
Explore Real-time Analytics
Airbnb Seasonality Analysis & Trends in Aurlandsvangen (2026)
Peak Season (August, July, June)
- Revenue averages $8,062 per month
- Occupancy rates average 82.3%
- Daily rates average $288
Shoulder Season
- Revenue averages $4,411 per month
- Occupancy maintains around 57.7%
- Daily rates hold near $252
Low Season (January, November, December)
- Revenue drops to average $1,934 per month
- Occupancy decreases to average 42.5%
- Daily rates adjust to average $268
Seasonality Insights for Aurlandsvangen
- The Airbnb seasonality in Aurlandsvangen shows highly seasonal trends requiring careful strategy. While the sections above show seasonal averages, it's also insightful to look at the extremes:
- During the high season, the absolute peak month showcases Aurlandsvangen's highest earning potential, with monthly revenues capable of climbing to $8,470, occupancy reaching a high of 88.8%, and ADRs peaking at $295.
- Conversely, the slowest single month of the year, typically falling within the low season, marks the market's lowest point. In this month, revenue might dip to $1,757, occupancy could drop to 35.8%, and ADRs may adjust down to $219.
- Understanding both the seasonal averages and these monthly peaks and troughs in revenue, occupancy, and ADR is crucial for maximizing your Airbnb profit potential in Aurlandsvangen.
Seasonal Strategies for Maximizing Profit
- Peak Season: Maximize revenue through premium pricing and potentially longer minimum stays. Ensure high availability.
- Low Season: Offer competitive pricing, special promotions (e.g., extended stay discounts), and flexible cancellation policies. Target off-season travelers like remote workers or budget-conscious guests.
- Shoulder Seasons: Implement dynamic pricing that balances peak and low rates. Target weekend travelers or specific events. Offer slightly more flexible terms than peak season.
- Regularly analyze your own performance against these Aurlandsvangen seasonality benchmarks and adjust your pricing and availability strategy accordingly.
Best Areas for Airbnb Investment in Aurlandsvangen (2026)
Exploring the top neighborhoods for short-term rentals in Aurlandsvangen? This section highlights key areas, outlining why they are attractive for hosts and guests, along with notable local attractions. Consider these locations based on your target guest profile and investment strategy.
| Neighborhood / Area | Why Host Here? (Target Guests & Appeal) | Key Attractions & Landmarks |
|---|---|---|
| Aurlandsfjellet | Known as the 'Snow Road', Aurlandsfjellet offers stunning landscapes and scenic views of Aurlandsdalen. Ideal for nature lovers and outdoor enthusiasts looking for hiking and adventure. | Aurlandsfjellet National Tourist Route, Stegastein Viewpoint, Aurlandsdalen, Nærøyfjord, Flåm railway |
| Flåm | A picturesque village located at the end of the Aurlandsfjord, Flåm is a gateway to cruise trips and the famous Flåm Railway, attracting tourists year-round. | Flåm Railway, Nærøyfjord, Fjord Cruise, Aurland Fjord, Flåm Church |
| Nærøyfjord | Designated as a UNESCO World Heritage site, Nærøyfjord is one of the most beautiful fjords in Norway, attracting visitors for kayaking, hiking, and scenic boat tours. | Nærøyfjord, Undredal, Aurland Lookout, Nærøyfjord Cruise, Waterfalls |
| Gudvangen | A charming village located in the heart of the fjords, Gudvangen is popular for outdoor adventures and Viking cultural experiences. | Viking Valley, Gudvangen Fjordtell, Kayaking, Hiking Trails, Viking History |
| Lærdal | Known for its well-preserved wooden houses and historical significance, Lærdal offers cultural experiences and access to beautiful nature. | Borgund Stave Church, Lærdalslågen, Lærdal Tunnel, The Old Town of Lærdalsøyri, Lærdal Skisenter |
| Skjolden | The village at the end of Sognefjord, Skjolden serves as a base for exploring the surrounding fjords and is known for its natural beauty and tranquility. | Sognefjord, Brekke Gard, Skjolden Church, Skiing in the region, Hiking trails |
| Borgund | Home to one of Norway's best-preserved stave churches, Borgund is a historical site that attracts visitors interested in Norwegian cultural heritage. | Borgund Stave Church, Borgund Old Church, Hiking Trails, Cultural Experience, Local Craft Shops |
| Aurlandsdalen | An exceptional valley known for its natural beauty, Aurlandsdalen is a favorite for trekking and adventure seekers looking for a scenic getaway. | Aurlandsdalen Valley, Hiking Trails, Adventurous excursions, Nature Photography, Dramatic landscapes |
Understanding Airbnb License Requirements & STR Laws in Aurlandsvangen (2026)
While Aurlandsvangen, Vestland, Norway currently shows low STR regulations, specific Airbnb license requirements might still exist or change. Always verify the latest short term rental regulations and Airbnb license requirements directly with local government authorities for Aurlandsvangen to ensure full compliance before hosting.
(Source: AirROI data, 2026, finding no licensed listings among those analyzed)
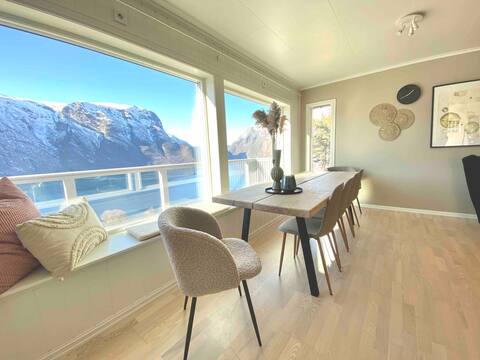
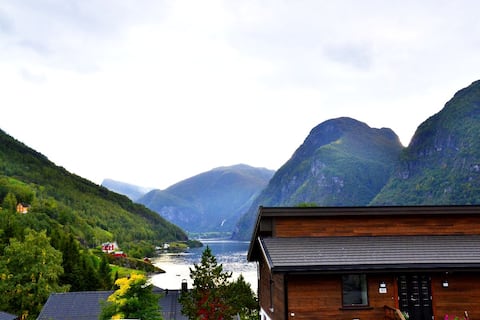
Top Performing Airbnb Properties in Aurlandsvangen (2026)
Benchmark your potential! Explore examples of top-performing Airbnb properties in Aurlandsvangenbased on Trailing Twelve Month (TTM) revenue. Analyze their characteristics, revenue, occupancy rate, and ADR to understand what drives success in this market.

Aurlandsfjord Panorama
Entire Place • 5 bedrooms
Nice house with amazing views!
Entire Place • 5 bedrooms
Otnes Sør - Luxury 140m2 - 1500 sqft
Entire Place • 2 bedrooms

High standard cabin (2) by the Aurland fjord
Entire Place • 3 bedrooms
High standard cabin (1) by the Aurland fjord
Entire Place • 3 bedrooms

Central townhouse in Aurland
Entire Place • 3 bedrooms
Note: Performance varies based on location, size, amenities, seasonality, and management quality. Data reflects the past 12 months.
Top Performing Airbnb Hosts in Aurlandsvangen (2026)
Learn from the best! This table showcases top-performing Airbnb hosts in Aurlandsvangen based on the number of properties managed and estimated total revenue over the past year. Analyze their scale and performance metrics.
| Host Name | Properties | Grossing Revenue | Stay Reviews | Avg Rating |
|---|---|---|---|---|
| Aurland Fjordhytter | 2 | $139,444 | 283 | 4.96/5.0 |
| Marita | 1 | $118,078 | 78 | 5.00/5.0 |
| Line | 2 | $114,424 | 230 | 4.95/5.0 |
| Maria Osa | 1 | $109,867 | 54 | 4.98/5.0 |
| Turid | 2 | $89,732 | 194 | 4.88/5.0 |
| David | 2 | $84,749 | 23 | 5.00/5.0 |
| Linn | 1 | $67,486 | 11 | 5.00/5.0 |
| Ann Iren | 1 | $46,278 | 121 | 4.98/5.0 |
| Kestutis | 1 | $44,822 | 1359 | 4.79/5.0 |
| Anja | 1 | $43,775 | 119 | 4.96/5.0 |
Analyzing the strategies of top hosts, such as their property selection, pricing, and guest communication, can offer valuable lessons for optimizing your own Airbnb operations in Aurlandsvangen.
Dive Deeper: Advanced Aurlandsvangen STR Market Data (2026)
Ready to unlock more insights? AirROI provides access to advanced metrics and comprehensive Airbnb data for Aurlandsvangen. Explore detailed analytics beyond this report to refine your investment strategy, optimize pricing, and maximize your vacation rental profits.
Explore Advanced MetricsAurlandsvangen Short-Term Rental Market Composition (2026): Property & Room Types
Room Type Distribution
Property Type Distribution
Market Composition Insights for Aurlandsvangen
- The Aurlandsvangen Airbnb market composition is heavily skewed towards Entire Home/Apt listings, which make up 95.2% of the 21 active rentals. This indicates strong guest preference for privacy and space.
- Looking at the property type distribution in Aurlandsvangen, Apartment/Condo properties are the most common (52.4%), reflecting the local real estate landscape.
- Houses represent a significant 38.1% portion, catering likely to families or larger groups.
- Smaller segments like others, outdoor/unique (combined 9.6%) offer potential for unique stay experiences.
Aurlandsvangen Airbnb Room Capacity Analysis (2026): Bedroom Distribution
Distribution of Listings by Number of Bedrooms
Room Capacity Insights for Aurlandsvangen
- The dominant room capacity in Aurlandsvangen is 2 bedrooms listings, making up 33.3% of the market. This suggests a strong demand for properties suitable for couples or solo travelers.
- Together, 2 bedrooms and 3 bedrooms properties represent 66.6% of the active Airbnb listings in Aurlandsvangen, indicating a high concentration in these sizes.
- A significant 42.8% of listings offer 3+ bedrooms, catering to larger groups and families seeking more space in Aurlandsvangen.
Aurlandsvangen Vacation Rental Guest Capacity Trends (2026)
Distribution of Listings by Guest Capacity
Guest Capacity Insights for Aurlandsvangen
- The most common guest capacity trend in Aurlandsvangen vacation rentals is listings accommodating 6 guests (33.3%). This suggests the primary traveler segment is likely larger groups.
- Properties designed for 6 guests and 4 guests dominate the Aurlandsvangen STR market, accounting for 52.3% of listings.
- 42.8% of properties accommodate 6+ guests, serving the market segment for larger families or group travel in Aurlandsvangen.
- On average, properties in Aurlandsvangen are equipped to host 4.5 guests.
Aurlandsvangen Airbnb Booking Patterns (2026): Available vs. Booked Days
Available Days Distribution
Booked Days Distribution
Booking Pattern Insights for Aurlandsvangen
- The most common availability pattern in Aurlandsvangen falls within the 91-180 days range, representing 38.1% of listings. This suggests many properties have significant open periods on their calendars.
- Approximately 42.8% of listings show high availability (181+ days open annually), indicating potential for increased bookings or specific owner usage patterns.
- For booked days, the 91-180 days range is most frequent in Aurlandsvangen (33.3%), reflecting common guest stay durations or potential owner blocking patterns.
- A notable 57.1% of properties secure long booking periods (181+ days booked per year), highlighting successful long-term rental strategies or significant owner usage.
Aurlandsvangen Airbnb Minimum Stay Requirements Analysis
Distribution of Listings by Minimum Night Requirement
1 Night
3 listings
14.3% of total
2 Nights
2 listings
9.5% of total
3 Nights
3 listings
14.3% of total
4-6 Nights
1 listings
4.8% of total
30+ Nights
12 listings
57.1% of total
Key Insights
- The most prevalent minimum stay requirement in Aurlandsvangen is 30+ Nights, adopted by 57.1% of listings. This highlights the market's preference for longer commitments.
- A significant segment (57.1%) caters to monthly stays (30+ nights) in Aurlandsvangen, pointing to opportunities in the extended-stay market.
Recommendations
- Align with the market by considering a 30+ Nights minimum stay, as 57.1% of Aurlandsvangen hosts use this setting.
- If feasible, allowing 1-night stays, especially midweek or during low season, could capture last-minute bookings, as only 14.3% currently do.
- Explore offering discounts for stays of 30+ nights to attract the 57.1% of the market seeking extended stays.
- Adjust minimum nights based on seasonality – potentially shorter during low season and longer during peak demand periods in Aurlandsvangen.
Aurlandsvangen Airbnb Cancellation Policy Trends Analysis (2026)
Super Strict 30 Days
1 listings
4.8% of total
Flexible
2 listings
9.5% of total
Moderate
5 listings
23.8% of total
Firm
12 listings
57.1% of total
Strict
1 listings
4.8% of total
Cancellation Policy Insights for Aurlandsvangen
- The prevailing Airbnb cancellation policy trend in Aurlandsvangen is Firm, used by 57.1% of listings.
- A majority (61.9%) of hosts in Aurlandsvangen utilize Firm or Strict policies, indicating a market where hosts prioritize booking security.
- Strict cancellation policies are quite rare (4.8%), potentially making listings with this policy less competitive unless justified by high demand or property type.
Recommendations for Hosts
- Consider adopting a Firm policy to align with the 57.1% market standard in Aurlandsvangen.
- Using a Strict policy might deter some guests, as only 4.8% of listings use it. Evaluate if potential revenue protection outweighs possible lower booking rates.
- Regularly review your cancellation policy against competitors and market demand shifts in Aurlandsvangen.
Aurlandsvangen STR Booking Lead Time Analysis (2026)
Average Booking Lead Time by Month
Booking Lead Time Insights for Aurlandsvangen
- The overall average booking lead time for vacation rentals in Aurlandsvangen is 90 days.
- Guests book furthest in advance for stays during July (average 143 days), likely coinciding with peak travel demand or local events.
- The shortest booking windows occur for stays in November (average 27 days), indicating more last-minute travel plans during this time.
- Seasonally, Summer (133 days avg.) sees the longest lead times, while Winter (55 days avg.) has the shortest, reflecting typical travel planning cycles.
Recommendations for Hosts
- Use the overall average lead time (90 days) as a baseline for your pricing and availability strategy in Aurlandsvangen.
- For July stays, consider implementing length-of-stay discounts or slightly higher rates for bookings made less than 143 days out to capitalize on advance planning.
- Target marketing efforts for the Summer season well in advance (at least 133 days) to capture early planners.
- Monitor your own booking lead times against these Aurlandsvangen averages to identify opportunities for dynamic pricing adjustments.
Popular & Essential Airbnb Amenities in Aurlandsvangen (2026)
Amenity Prevalence
Amenity Insights for Aurlandsvangen
- Essential amenities in Aurlandsvangen that guests expect include: Wifi, Hot water, Smoke alarm, Kitchen. Lacking these (any) could significantly impact bookings.
- Popular amenities like Coffee maker, Heating, Fire extinguisher are common but not universal. Offering these can provide a competitive edge.
Recommendations for Hosts
- Ensure your listing includes all essential amenities for Aurlandsvangen: Wifi, Hot water, Smoke alarm, Kitchen.
- Prioritize adding missing essentials: Hot water, Smoke alarm, Kitchen.
- Consider adding popular differentiators like Coffee maker or Heating to increase appeal.
- Highlight unique or less common amenities you offer (e.g., hot tub, dedicated workspace, EV charger) in your listing description and photos.
- Regularly check competitor amenities in Aurlandsvangen to stay competitive.
Aurlandsvangen Airbnb Guest Demographics & Profile Analysis (2026)
Guest Profile Summary for Aurlandsvangen
- The typical guest profile for Airbnb in Aurlandsvangen consists of predominantly international visitors (98%), with top international origins including United Kingdom, typically belonging to the Post-2000s (Gen Z/Alpha) group (50%), primarily speaking English or Spanish.
- Domestic travelers account for 1.7% of guests.
- Key international markets include United States (46.9%) and United Kingdom (14.1%).
- Top languages spoken are English (54.4%) followed by Spanish (8.8%).
- A significant demographic segment is the Post-2000s (Gen Z/Alpha) group, representing 50% of guests.
Recommendations for Hosts
- Focus marketing internationally, particularly towards travelers from United Kingdom.
- Tailor amenities and listing descriptions to appeal to the dominant Post-2000s (Gen Z/Alpha) demographic (e.g., highlight fast WiFi, smart home features, local guides).
- Highlight unique local experiences or amenities relevant to the primary guest profile.
- Consider seasonal promotions aligned with peak travel times for key origin markets.
Nearby Short-Term Rental Market Comparison
How does the Aurlandsvangen Airbnb market stack up against its neighbors? Compare key performance metrics like average monthly revenue, ADR, and occupancy rates in surrounding areas to understand the broader regional STR landscape.
| Market | Active Properties | Monthly Revenue | Daily Rate | Avg. Occupancy |
|---|---|---|---|---|
| Flåm | 20 | $3,930 | $285.20 | 62% |
| Undredal | 10 | $2,919 | $237.80 | 58% |
| Aurland | 21 | $2,767 | $278.22 | 55% |
| Odda | 66 | $2,122 | $199.85 | 53% |
| Loen | 12 | $2,092 | $199.93 | 48% |
| Stryn | 245 | $2,013 | $278.46 | 43% |
| Vierli | 22 | $2,005 | $228.93 | 37% |
| Lærdalsøyri | 17 | $1,891 | $192.12 | 55% |
| Olden | 19 | $1,890 | $283.82 | 42% |
| Voss | 246 | $1,845 | $259.34 | 35% |