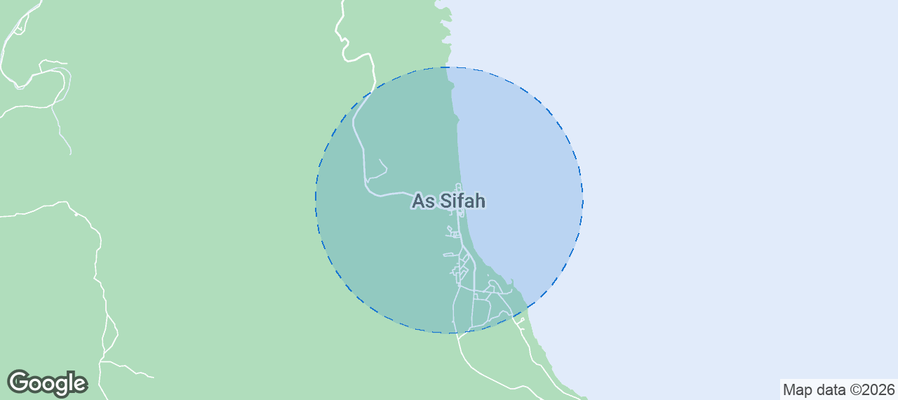
As Sīfah Airbnb Market Analysis 2026: Short Term Rental Data & Vacation Rental Statistics in Muscat Governorate, Oman
Is Airbnb profitable in As Sīfah in 2026? Explore comprehensive Airbnb analytics for As Sīfah, Muscat Governorate, Oman to uncover income potential. This 2026 STR market report for As Sīfah, based on AirROI data from February 2025 to January 2026, reveals key trends in the niche market of 19 active listings.
Whether you're considering an Airbnb investment in As Sīfah, optimizing your existing vacation rental, or exploring rental arbitrage opportunities, understanding the As Sīfah Airbnb data is crucial. Leveraging the low regulation environment is key to maximizing your short term rental income potential. Let's dive into the specifics.
Key As Sīfah Airbnb Performance Metrics Overview
Monthly Airbnb Revenue Variations & Income Potential in As Sīfah (2026)
Understanding the monthly revenue variations for Airbnb listings in As Sīfah is key to maximizing your short term rental income potential. Seasonality significantly impacts earnings. Our analysis, based on data from the past 12 months, shows that the peak revenue month for STRs in As Sīfah is typically December, while May often presents the lowest earnings, highlighting opportunities for strategic pricing adjustments during shoulder and low seasons. Explore the typical Airbnb income in As Sīfah across different performance tiers:
- Best-in-class properties (Top 10%) achieve $3,142+ monthly, often utilizing dynamic pricing and superior guest experiences.
- Strong performing properties (Top 25%) earn $1,589 or more, indicating effective management and desirable locations/amenities.
- Typical properties (Median) generate around $799 per month, representing the average market performance.
- Entry-level properties (Bottom 25%) see earnings around $337, often with potential for optimization.
Average Monthly Airbnb Earnings Trend in As Sīfah
As Sīfah Airbnb Occupancy Rate Trends (2026)
Maximize your bookings by understanding the As Sīfah STR occupancy trends. Seasonal demand shifts significantly influence how often properties are booked. Typically, Decembersees the highest demand (peak season occupancy), while May experiences the lowest (low season). Effective strategies, like adjusting minimum stays or offering promotions, can boost occupancy during slower periods. Here's how different property tiers perform in As Sīfah:
- Best-in-class properties (Top 10%) achieve 50%+ occupancy, indicating high desirability and potentially optimized availability.
- Strong performing properties (Top 25%) maintain 33% or higher occupancy, suggesting good market fit and guest satisfaction.
- Typical properties (Median) have an occupancy rate around 19%.
- Entry-level properties (Bottom 25%) average 8% occupancy, potentially facing higher vacancy.
Average Monthly Occupancy Rate Trend in As Sīfah
Average Daily Rate (ADR) Airbnb Trends in As Sīfah (2026)
Effective short term rental pricing strategy in As Sīfah involves understanding monthly ADR fluctuations. The Average Daily Rate (ADR) for Airbnb in As Sīfah typically peaks in June and dips lowest during April. Leveraging Airbnb dynamic pricing tools or strategies based on this seasonality can significantly boost revenue. Here's a look at the typical nightly rates achieved:
- Best-in-class properties (Top 10%) command rates of $265+ per night, often due to premium features or locations.
- Strong performing properties (Top 25%) achieve nightly rates of $197 or more.
- Typical properties (Median) charge around $134 per night.
- Entry-level properties (Bottom 25%) earn around $104 per night.
Average Daily Rate (ADR) Trend by Month in As Sīfah
Get Live As Sīfah Market Intelligence 👇
Explore Real-time Analytics
Airbnb Seasonality Analysis & Trends in As Sīfah (2026)
Peak Season (December, January, November)
- Revenue averages $1,698 per month
- Occupancy rates average 34.0%
- Daily rates average $166
Shoulder Season
- Revenue averages $1,192 per month
- Occupancy maintains around 24.6%
- Daily rates hold near $163
Low Season (May, July, September)
- Revenue drops to average $690 per month
- Occupancy decreases to average 12.7%
- Daily rates adjust to average $166
Seasonality Insights for As Sīfah
- The Airbnb seasonality in As Sīfah shows highly seasonal trends requiring careful strategy. While the sections above show seasonal averages, it's also insightful to look at the extremes:
- During the high season, the absolute peak month showcases As Sīfah's highest earning potential, with monthly revenues capable of climbing to $1,952, occupancy reaching a high of 36.9%, and ADRs peaking at $171.
- Conversely, the slowest single month of the year, typically falling within the low season, marks the market's lowest point. In this month, revenue might dip to $589, occupancy could drop to 12.1%, and ADRs may adjust down to $158.
- Understanding both the seasonal averages and these monthly peaks and troughs in revenue, occupancy, and ADR is crucial for maximizing your Airbnb profit potential in As Sīfah.
Seasonal Strategies for Maximizing Profit
- Peak Season: Maximize revenue through premium pricing and potentially longer minimum stays. Ensure high availability.
- Low Season: Offer competitive pricing, special promotions (e.g., extended stay discounts), and flexible cancellation policies. Target off-season travelers like remote workers or budget-conscious guests.
- Shoulder Seasons: Implement dynamic pricing that balances peak and low rates. Target weekend travelers or specific events. Offer slightly more flexible terms than peak season.
- Regularly analyze your own performance against these As Sīfah seasonality benchmarks and adjust your pricing and availability strategy accordingly.
Best Areas for Airbnb Investment in As Sīfah (2026)
Exploring the top neighborhoods for short-term rentals in As Sīfah? This section highlights key areas, outlining why they are attractive for hosts and guests, along with notable local attractions. Consider these locations based on your target guest profile and investment strategy.
| Neighborhood / Area | Why Host Here? (Target Guests & Appeal) | Key Attractions & Landmarks |
|---|---|---|
| Sīfah Beach | A pristine beach area known for its crystal clear waters and luxurious resorts. This location attracts vacationers looking for a relaxing beach getaway with access to water sports and leisure activities. | Sīfah Beach Resort, Water sports activities, Diving spots, Nearby golf courses |
| Al Sīfah Marina | A vibrant marina area with upscale dining and leisure options. Ideal for attracting visitors looking to indulge in luxurious experiences and enjoy scenic views of the coast. | Sīfah Marina, Restaurants with waterfront views, Marina yacht rentals, Walking trails along the coast |
| Al Batinah Coast | Famous for its stunning natural beauty and coastal attractions. This area is perfect for tourists seeking adventure in nature and local culture, and offers a blend of beaches and historical sites. | Wadi Shab, Bimmah Sinkhole, Historical forts, Local markets |
| The Wave | An integrated community offering a mix of residential and leisure facilities. This area is popular among families and long-term visitors interested in a comfortable lifestyle with amenities readily available. | Shops and cafes, Community parks, Events and festivals, Playgrounds |
| Muscat Hills | Known for its scenic landscapes and luxurious lifestyle options. This location attracts travelers looking for tranquility and nature with proximity to urban amenities. | Muscat Hills Golf Course, Nature trails, Scenic viewpoints |
| Al Mouj Muscat | A modern development that combines residential areas with a lifestyle and leisure component. This area is perfect for travelers looking for a vibrant community atmosphere by the sea. | Al Mouj Marina, Shopping centers, Beaches, Dining options |
| Dar Al Zahirah | An area that showcases Oman's natural beauty with traditional charm. Attracts visitors interested in authentic cultural experiences and outdoor activities. | Local Omani heritage sites, Nature reserves, Cultural festivals |
| Turtle Beach | Known for its unique wildlife and night turtle watching experiences. This area is ideal for eco-tourism and attracts nature lovers and families. | Turtle watching tours, Beach activities, Wildlife tours, Nature photography opportunities |
Understanding Airbnb License Requirements & STR Laws in As Sīfah (2026)
While As Sīfah, Muscat Governorate, Oman currently shows low STR regulations, specific Airbnb license requirements might still exist or change. Always verify the latest short term rental regulations and Airbnb license requirements directly with local government authorities for As Sīfah to ensure full compliance before hosting.
(Source: AirROI data, 2026, finding no licensed listings among those analyzed)
Top Performing Airbnb Properties in As Sīfah (2026)
Benchmark your potential! Explore examples of top-performing Airbnb properties in As Sīfahbased on Trailing Twelve Month (TTM) revenue. Analyze their characteristics, revenue, occupancy rate, and ADR to understand what drives success in this market.
Lazy Daze
Entire Place • 2 bedrooms
Lazy Daze 3
Entire Place • 3 bedrooms
Summertime Blues
Entire Place • 1 bedroom

Sifah Marina Holiday Apartment
Entire Place • 2 bedrooms

Al Reem Marine Apartment, Jabal Sifah
Entire Place • 2 bedrooms

Sunrise Haven
Entire Place • 1 bedroom
Note: Performance varies based on location, size, amenities, seasonality, and management quality. Data reflects the past 12 months.
Top Performing Airbnb Hosts in As Sīfah (2026)
Learn from the best! This table showcases top-performing Airbnb hosts in As Sīfah based on the number of properties managed and estimated total revenue over the past year. Analyze their scale and performance metrics.
| Host Name | Properties | Grossing Revenue | Stay Reviews | Avg Rating |
|---|---|---|---|---|
| Mahir | 3 | $87,756 | 189 | 4.95/5.0 |
| Nasir | 1 | $12,362 | 15 | 4.73/5.0 |
| Namariq | 2 | $11,247 | 11 | 4.60/5.0 |
| Shahla | 1 | $8,905 | 11 | 5.00/5.0 |
| Reenum | 1 | $7,704 | 3 | 5.00/5.0 |
| Rada | 2 | $7,639 | 2 | Not Rated |
| Mrami | 1 | $6,270 | 1 | Not Rated |
| Said | 1 | $4,514 | 1 | Not Rated |
| Laith | 1 | $3,208 | 9 | 4.89/5.0 |
| Koraljka | 1 | $3,206 | 3 | 4.67/5.0 |
Analyzing the strategies of top hosts, such as their property selection, pricing, and guest communication, can offer valuable lessons for optimizing your own Airbnb operations in As Sīfah.
Dive Deeper: Advanced As Sīfah STR Market Data (2026)
Ready to unlock more insights? AirROI provides access to advanced metrics and comprehensive Airbnb data for As Sīfah. Explore detailed analytics beyond this report to refine your investment strategy, optimize pricing, and maximize your vacation rental profits.
Explore Advanced MetricsAs Sīfah Short-Term Rental Market Composition (2026): Property & Room Types
Room Type Distribution
Property Type Distribution
Market Composition Insights for As Sīfah
- The As Sīfah Airbnb market composition is heavily skewed towards Entire Home/Apt listings, which make up 100% of the 19 active rentals. This indicates strong guest preference for privacy and space.
- Looking at the property type distribution in As Sīfah, Apartment/Condo properties are the most common (57.9%), reflecting the local real estate landscape.
- Houses represent a significant 42.1% portion, catering likely to families or larger groups.
As Sīfah Airbnb Room Capacity Analysis (2026): Bedroom Distribution
Distribution of Listings by Number of Bedrooms
Room Capacity Insights for As Sīfah
- The dominant room capacity in As Sīfah is 1 bedroom listings, making up 63.2% of the market. This suggests a strong demand for properties suitable for couples or solo travelers.
- Together, 1 bedroom and 2 bedrooms properties represent 94.8% of the active Airbnb listings in As Sīfah, indicating a high concentration in these sizes.
- With over half the market (63.2%) consisting of studios or 1-bedroom units, As Sīfah is particularly well-suited for individuals or couples.
- Listings with 3+ bedrooms (5.3%) represent a smaller niche, potentially indicating an underserved market for larger group accommodations in As Sīfah.
As Sīfah Vacation Rental Guest Capacity Trends (2026)
Distribution of Listings by Guest Capacity
Guest Capacity Insights for As Sīfah
- The most common guest capacity trend in As Sīfah vacation rentals is listings accommodating 2 guests (31.6%). This suggests the primary traveler segment is likely couples or solo travelers.
- Properties designed for 2 guests and 5 guests dominate the As Sīfah STR market, accounting for 52.7% of listings.
- 21.1% of properties accommodate 6+ guests, serving the market segment for larger families or group travel in As Sīfah.
- On average, properties in As Sīfah are equipped to host 3.9 guests.
As Sīfah Airbnb Booking Patterns (2026): Available vs. Booked Days
Available Days Distribution
Booked Days Distribution
Booking Pattern Insights for As Sīfah
- The most common availability pattern in As Sīfah falls within the 271-366 days range, representing 84.2% of listings. This suggests many properties have significant open periods on their calendars.
- Approximately 94.7% of listings show high availability (181+ days open annually), indicating potential for increased bookings or specific owner usage patterns.
- For booked days, the 31-90 days range is most frequent in As Sīfah (47.4%), reflecting common guest stay durations or potential owner blocking patterns.
- A notable 5.3% of properties secure long booking periods (181+ days booked per year), highlighting successful long-term rental strategies or significant owner usage.
As Sīfah Airbnb Minimum Stay Requirements Analysis
Distribution of Listings by Minimum Night Requirement
1 Night
16 listings
84.2% of total
2 Nights
1 listings
5.3% of total
3 Nights
2 listings
10.5% of total
Key Insights
- The most prevalent minimum stay requirement in As Sīfah is 1 Night, adopted by 84.2% of listings. This highlights the market's preference for shorter, flexible bookings.
- A strong majority (89.5%) of the As Sīfah Airbnb data shows acceptance of very short stays (1-2 nights), indicating a dynamic, high-turnover market.
Recommendations
- Align with the market by considering a 1 Night minimum stay, as 84.2% of As Sīfah hosts use this setting.
- Adjust minimum nights based on seasonality – potentially shorter during low season and longer during peak demand periods in As Sīfah.
As Sīfah Airbnb Cancellation Policy Trends Analysis (2026)
Flexible
9 listings
47.4% of total
Moderate
3 listings
15.8% of total
Firm
7 listings
36.8% of total
Cancellation Policy Insights for As Sīfah
- The prevailing Airbnb cancellation policy trend in As Sīfah is Flexible, used by 47.4% of listings.
- There's a relatively balanced mix between guest-friendly (63.2%) and stricter (36.8%) policies, offering choices for different guest needs.
Recommendations for Hosts
- Consider adopting a Flexible policy to align with the 47.4% market standard in As Sīfah.
- Regularly review your cancellation policy against competitors and market demand shifts in As Sīfah.
As Sīfah STR Booking Lead Time Analysis (2026)
Average Booking Lead Time by Month
Booking Lead Time Insights for As Sīfah
- The overall average booking lead time for vacation rentals in As Sīfah is 14 days.
- Guests book furthest in advance for stays during October (average 36 days), likely coinciding with peak travel demand or local events.
- The shortest booking windows occur for stays in July (average 4 days), indicating more last-minute travel plans during this time.
- Seasonally, Winter (19 days avg.) sees the longest lead times, while Summer (6 days avg.) has the shortest, reflecting typical travel planning cycles.
Recommendations for Hosts
- Use the overall average lead time (14 days) as a baseline for your pricing and availability strategy in As Sīfah.
- For October stays, consider implementing length-of-stay discounts or slightly higher rates for bookings made less than 36 days out to capitalize on advance planning.
- During July, focus on last-minute booking availability and promotions, as guests book with very short notice (4 days avg.).
- Target marketing efforts for the Winter season well in advance (at least 19 days) to capture early planners.
- Monitor your own booking lead times against these As Sīfah averages to identify opportunities for dynamic pricing adjustments.
Popular & Essential Airbnb Amenities in As Sīfah (2026)
Amenity Prevalence
Amenity Insights for As Sīfah
- Essential amenities in As Sīfah that guests expect include: TV, Free parking on premises, Air conditioning, Kitchen, Beach access. Lacking these (any) could significantly impact bookings.
- Popular amenities like Washer, Fire extinguisher, Pool are common but not universal. Offering these can provide a competitive edge.
- A pool is a highly desired but not standard amenity, making it a key feature for attracting guests seeking leisure in As Sīfah.
Recommendations for Hosts
- Ensure your listing includes all essential amenities for As Sīfah: TV, Free parking on premises, Air conditioning, Kitchen, Beach access.
- Consider adding popular differentiators like Washer or Fire extinguisher to increase appeal.
- Highlight unique or less common amenities you offer (e.g., hot tub, dedicated workspace, EV charger) in your listing description and photos.
- Regularly check competitor amenities in As Sīfah to stay competitive.
As Sīfah Airbnb Guest Demographics & Profile Analysis (2026)
Guest Profile Summary for As Sīfah
- The typical guest profile for Airbnb in As Sīfah consists of predominantly international visitors (75%), with top international origins including United Arab Emirates, typically belonging to the Post-2000s (Gen Z/Alpha) group (50%), primarily speaking English or Arabic.
- Domestic travelers account for 25.3% of guests.
- Key international markets include Oman (25.3%) and United Arab Emirates (12%).
- Top languages spoken are English (42.1%) followed by Arabic (14.7%).
- A significant demographic segment is the Post-2000s (Gen Z/Alpha) group, representing 50% of guests.
Recommendations for Hosts
- Focus marketing internationally, particularly towards travelers from United Arab Emirates.
- Tailor amenities and listing descriptions to appeal to the dominant Post-2000s (Gen Z/Alpha) demographic (e.g., highlight fast WiFi, smart home features, local guides).
- Highlight unique local experiences or amenities relevant to the primary guest profile.
- Consider seasonal promotions aligned with peak travel times for key origin markets.
Nearby Short-Term Rental Market Comparison
How does the As Sīfah Airbnb market stack up against its neighbors? Compare key performance metrics like average monthly revenue, ADR, and occupancy rates in surrounding areas to understand the broader regional STR landscape.
| Market | Active Properties | Monthly Revenue | Daily Rate | Avg. Occupancy |
|---|---|---|---|---|
| Ash Shab | 12 | $1,431 | $123.26 | 44% |
| Barka | 15 | $1,176 | $176.33 | 28% |
| Hillat al Kaws | 21 | $924 | $199.35 | 23% |
| Qantab | 33 | $839 | $108.69 | 34% |
| Muscat | 259 | $608 | $83.09 | 35% |
| Seeb | 42 | $606 | $96.69 | 30% |
| Nizwa | 17 | $597 | $116.48 | 30% |
| Ras Al Hadd | 18 | $308 | $65.45 | 24% |