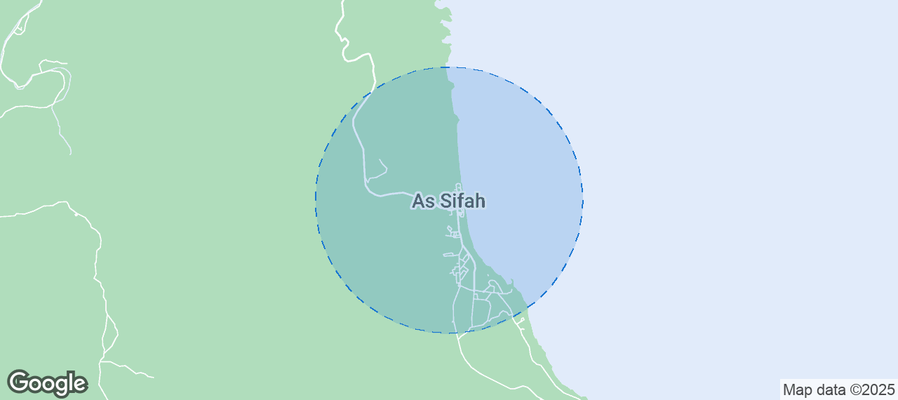
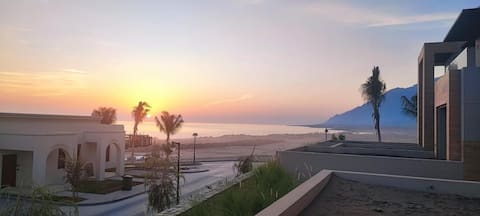
As Sifah Airbnb Market Analysis 2026: Short Term Rental Data & Vacation Rental Statistics in Muscat Governorate, Oman
Is Airbnb profitable in As Sifah in 2026? Explore comprehensive Airbnb analytics for As Sifah, Muscat Governorate, Oman to uncover income potential. This 2026 STR market report for As Sifah, based on AirROI data from January 2025 to December 2025, reveals key trends in the niche market of 20 active listings.
Whether you're considering an Airbnb investment in As Sifah, optimizing your existing vacation rental, or exploring rental arbitrage opportunities, understanding the As Sifah Airbnb data is crucial. Leveraging the low regulation environment is key to maximizing your short term rental income potential. Let's dive into the specifics.
Key As Sifah Airbnb Performance Metrics Overview
Monthly Airbnb Revenue Variations & Income Potential in As Sifah (2026)
Understanding the monthly revenue variations for Airbnb listings in As Sifah is key to maximizing your short term rental income potential. Seasonality significantly impacts earnings. Our analysis, based on data from the past 12 months, shows that the peak revenue month for STRs in As Sifah is typically December, while May often presents the lowest earnings, highlighting opportunities for strategic pricing adjustments during shoulder and low seasons. Explore the typical Airbnb income in As Sifah across different performance tiers:
- Best-in-class properties (Top 10%) achieve $3,068+ monthly, often utilizing dynamic pricing and superior guest experiences.
- Strong performing properties (Top 25%) earn $1,929 or more, indicating effective management and desirable locations/amenities.
- Typical properties (Median) generate around $749 per month, representing the average market performance.
- Entry-level properties (Bottom 25%) see earnings around $355, often with potential for optimization.
Average Monthly Airbnb Earnings Trend in As Sifah
As Sifah Airbnb Occupancy Rate Trends (2026)
Maximize your bookings by understanding the As Sifah STR occupancy trends. Seasonal demand shifts significantly influence how often properties are booked. Typically, Decembersees the highest demand (peak season occupancy), while May experiences the lowest (low season). Effective strategies, like adjusting minimum stays or offering promotions, can boost occupancy during slower periods. Here's how different property tiers perform in As Sifah:
- Best-in-class properties (Top 10%) achieve 49%+ occupancy, indicating high desirability and potentially optimized availability.
- Strong performing properties (Top 25%) maintain 36% or higher occupancy, suggesting good market fit and guest satisfaction.
- Typical properties (Median) have an occupancy rate around 19%.
- Entry-level properties (Bottom 25%) average 8% occupancy, potentially facing higher vacancy.
Average Monthly Occupancy Rate Trend in As Sifah
Average Daily Rate (ADR) Airbnb Trends in As Sifah (2026)
Effective short term rental pricing strategy in As Sifah involves understanding monthly ADR fluctuations. The Average Daily Rate (ADR) for Airbnb in As Sifah typically peaks in June and dips lowest during August. Leveraging Airbnb dynamic pricing tools or strategies based on this seasonality can significantly boost revenue. Here's a look at the typical nightly rates achieved:
- Best-in-class properties (Top 10%) command rates of $245+ per night, often due to premium features or locations.
- Strong performing properties (Top 25%) achieve nightly rates of $197 or more.
- Typical properties (Median) charge around $138 per night.
- Entry-level properties (Bottom 25%) earn around $110 per night.
Average Daily Rate (ADR) Trend by Month in As Sifah
Get Live As Sifah Market Intelligence 👇
Explore Real-time Analytics
Airbnb Seasonality Analysis & Trends in As Sifah (2025)
Peak Season (December, November, October)
- Revenue averages $1,869 per month
- Occupancy rates average 36.2%
- Daily rates average $162
Shoulder Season
- Revenue averages $1,229 per month
- Occupancy maintains around 24.1%
- Daily rates hold near $166
Low Season (January, March, May)
- Revenue drops to average $905 per month
- Occupancy decreases to average 18.5%
- Daily rates adjust to average $167
Seasonality Insights for As Sifah
- The Airbnb seasonality in As Sifah shows highly seasonal trends requiring careful strategy. While the sections above show seasonal averages, it's also insightful to look at the extremes:
- During the high season, the absolute peak month showcases As Sifah's highest earning potential, with monthly revenues capable of climbing to $2,036, occupancy reaching a high of 39.2%, and ADRs peaking at $176.
- Conversely, the slowest single month of the year, typically falling within the low season, marks the market's lowest point. In this month, revenue might dip to $584, occupancy could drop to 11.7%, and ADRs may adjust down to $161.
- Understanding both the seasonal averages and these monthly peaks and troughs in revenue, occupancy, and ADR is crucial for maximizing your Airbnb profit potential in As Sifah.
Seasonal Strategies for Maximizing Profit
- Peak Season: Maximize revenue through premium pricing and potentially longer minimum stays. Ensure high availability.
- Low Season: Offer competitive pricing, special promotions (e.g., extended stay discounts), and flexible cancellation policies. Target off-season travelers like remote workers or budget-conscious guests.
- Shoulder Seasons: Implement dynamic pricing that balances peak and low rates. Target weekend travelers or specific events. Offer slightly more flexible terms than peak season.
- Regularly analyze your own performance against these As Sifah seasonality benchmarks and adjust your pricing and availability strategy accordingly.
Best Areas for Airbnb Investment in As Sifah (2026)
Exploring the top neighborhoods for short-term rentals in As Sifah? This section highlights key areas, outlining why they are attractive for hosts and guests, along with notable local attractions. Consider these locations based on your target guest profile and investment strategy.
| Neighborhood / Area | Why Host Here? (Target Guests & Appeal) | Key Attractions & Landmarks |
|---|---|---|
| As Sifah Beach | A beautiful beachfront area known for its stunning views and tranquil atmosphere. Ideal for tourists looking for relaxation, water sports, and marine activities. | As Sifah Marina, Water sports activities, Local seafood restaurants, Beaches, Diving spots |
| Al Sifah Resort | A luxurious resort offering a range of amenities and activities. Attractive for families and couples seeking a getaway with comfort and elegance. | Spa facilities, Dining options, Swimming pools, Golf course nearby, Nature trails |
| Al Sifah Village | A quaint village area that offers traditional Omani experiences and a taste of local culture. Perfect for cultural enthusiasts and travelers seeking authenticity. | Local markets, Traditional Omani architecture, Cultural experiences, Sunset views, Beach access |
| Jebel Sifah | Located near the mountains, this area provides stunning landscapes and hiking opportunities. Great for adventure seekers and nature lovers. | Hiking trails, Mountain views, Eco-tourism activities, Cafes with a view, Nature photography spots |
| Sifah Cove | A newly developed area catering to luxury tourism with private villas and an exclusive ambiance. Appeals to high-end travelers looking for privacy and luxury. | Private beaches, Luxury dining, High-end amenities, Scenic landscapes, Water sports |
| Sifah Marina Village | A vibrant marina area that offers shops, dining, and entertainment. Attractive for both boat enthusiasts and leisure travelers. | Yacht rentals, Dining along the marina, Shopping outlets, Events and festivals, Waterfront activities |
| Al Sifah Golf Course | A premier golf destination attracting golf enthusiasts from around the world. Ideal for visitors interested in sports and leisure. | 18-hole championship golf course, Clubhouse facilities, Golf tournaments, Scenic views, Social events |
| Oman Dive Center | A popular diving spot in the area, catering to divers of all levels. Great for adventurous travelers and marine life enthusiasts. | Diving excursions, Snorkeling trips, Wildlife sightings, Marine conservation activities, Beach access |
Understanding Airbnb License Requirements & STR Laws in As Sifah (2026)
While As Sifah, Muscat Governorate, Oman currently shows low STR regulations, specific Airbnb license requirements might still exist or change. Always verify the latest short term rental regulations and Airbnb license requirements directly with local government authorities for As Sifah to ensure full compliance before hosting.
(Source: AirROI data, 2026, finding no licensed listings among those analyzed)
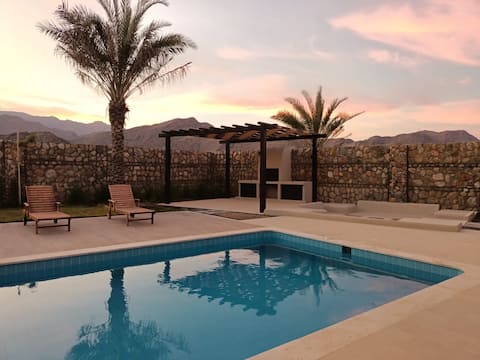
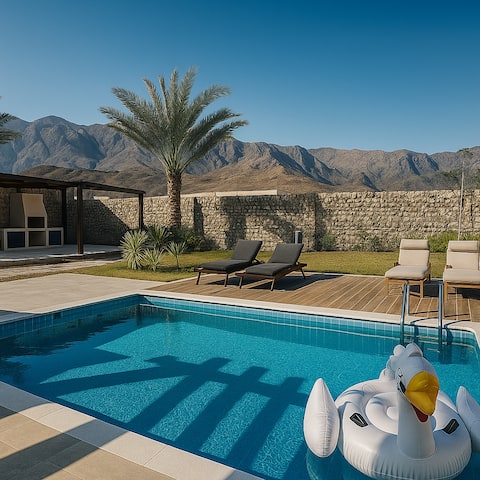
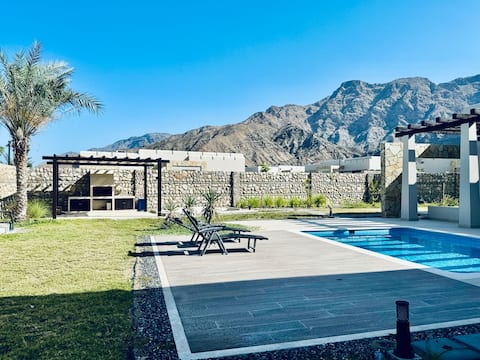
Top Performing Airbnb Properties in As Sifah (2026)
Benchmark your potential! Explore examples of top-performing Airbnb properties in As Sifahbased on Trailing Twelve Month (TTM) revenue. Analyze their characteristics, revenue, occupancy rate, and ADR to understand what drives success in this market.
Lazy Daze
Entire Place • 2 bedrooms
Lazy Daze II
Entire Place • 2 bedrooms
Lazy Daze 3
Entire Place • 3 bedrooms
Summertime Blues
Entire Place • 1 bedroom

As Sifah Beach Front Villa
Entire Place • 1 bedroom

Sifah Marina Holiday Apartment
Entire Place • 2 bedrooms
Note: Performance varies based on location, size, amenities, seasonality, and management quality. Data reflects the past 12 months.
Top Performing Airbnb Hosts in As Sifah (2026)
Learn from the best! This table showcases top-performing Airbnb hosts in As Sifah based on the number of properties managed and estimated total revenue over the past year. Analyze their scale and performance metrics.
| Host Name | Properties | Grossing Revenue | Stay Reviews | Avg Rating |
|---|---|---|---|---|
| Mahir | 4 | $118,402 | 191 | 4.96/5.0 |
| Namariq | 2 | $13,595 | 11 | 4.60/5.0 |
| Saeed | 1 | $10,032 | 15 | 5.00/5.0 |
| Nasir | 1 | $9,710 | 9 | 4.78/5.0 |
| Shahla | 1 | $8,961 | 7 | 5.00/5.0 |
| Mrami | 1 | $8,540 | 1 | Not Rated |
| Reenum | 1 | $7,580 | 3 | 5.00/5.0 |
| Rada | 2 | $6,423 | 2 | Not Rated |
| Said | 1 | $4,459 | 1 | Not Rated |
| Koraljka | 1 | $3,567 | 3 | 4.67/5.0 |
Analyzing the strategies of top hosts, such as their property selection, pricing, and guest communication, can offer valuable lessons for optimizing your own Airbnb operations in As Sifah.
Dive Deeper: Advanced As Sifah STR Market Data (2026)
Ready to unlock more insights? AirROI provides access to advanced metrics and comprehensive Airbnb data for As Sifah. Explore detailed analytics beyond this report to refine your investment strategy, optimize pricing, and maximize your vacation rental profits.
Explore Advanced MetricsAs Sifah Short-Term Rental Market Composition (2026): Property & Room Types
Room Type Distribution
Property Type Distribution
Market Composition Insights for As Sifah
- The As Sifah Airbnb market composition is heavily skewed towards Entire Home/Apt listings, which make up 100% of the 20 active rentals. This indicates strong guest preference for privacy and space.
- Looking at the property type distribution in As Sifah, Apartment/Condo properties are the most common (55%), reflecting the local real estate landscape.
- Houses represent a significant 45% portion, catering likely to families or larger groups.
As Sifah Airbnb Room Capacity Analysis (2026): Bedroom Distribution
Distribution of Listings by Number of Bedrooms
Room Capacity Insights for As Sifah
- The dominant room capacity in As Sifah is 1 bedroom listings, making up 65% of the market. This suggests a strong demand for properties suitable for couples or solo travelers.
- Together, 1 bedroom and 2 bedrooms properties represent 95.0% of the active Airbnb listings in As Sifah, indicating a high concentration in these sizes.
- With over half the market (65%) consisting of studios or 1-bedroom units, As Sifah is particularly well-suited for individuals or couples.
- Listings with 3+ bedrooms (5.0%) represent a smaller niche, potentially indicating an underserved market for larger group accommodations in As Sifah.
As Sifah Vacation Rental Guest Capacity Trends (2026)
Distribution of Listings by Guest Capacity
Guest Capacity Insights for As Sifah
- The most common guest capacity trend in As Sifah vacation rentals is listings accommodating 2 guests (30%). This suggests the primary traveler segment is likely couples or solo travelers.
- Properties designed for 2 guests and 5 guests dominate the As Sifah STR market, accounting for 50.0% of listings.
- 20.0% of properties accommodate 6+ guests, serving the market segment for larger families or group travel in As Sifah.
- On average, properties in As Sifah are equipped to host 4.0 guests.
As Sifah Airbnb Booking Patterns (2026): Available vs. Booked Days
Available Days Distribution
Booked Days Distribution
Booking Pattern Insights for As Sifah
- The most common availability pattern in As Sifah falls within the 271-366 days range, representing 80% of listings. This suggests many properties have significant open periods on their calendars.
- Approximately 95.0% of listings show high availability (181+ days open annually), indicating potential for increased bookings or specific owner usage patterns.
- For booked days, the 1-30 days range is most frequent in As Sifah (45%), reflecting common guest stay durations or potential owner blocking patterns.
- A notable 10.0% of properties secure long booking periods (181+ days booked per year), highlighting successful long-term rental strategies or significant owner usage.
As Sifah Airbnb Minimum Stay Requirements Analysis
Distribution of Listings by Minimum Night Requirement
1 Night
16 listings
80% of total
2 Nights
1 listings
5% of total
3 Nights
2 listings
10% of total
30+ Nights
1 listings
5% of total
Key Insights
- The most prevalent minimum stay requirement in As Sifah is 1 Night, adopted by 80% of listings. This highlights the market's preference for shorter, flexible bookings.
- A strong majority (85.0%) of the As Sifah Airbnb data shows acceptance of very short stays (1-2 nights), indicating a dynamic, high-turnover market.
Recommendations
- Align with the market by considering a 1 Night minimum stay, as 80% of As Sifah hosts use this setting.
- Adjust minimum nights based on seasonality – potentially shorter during low season and longer during peak demand periods in As Sifah.
As Sifah Airbnb Cancellation Policy Trends Analysis (2026)
Limited
4 listings
20% of total
Flexible
9 listings
45% of total
Moderate
3 listings
15% of total
Firm
4 listings
20% of total
Cancellation Policy Insights for As Sifah
- The prevailing Airbnb cancellation policy trend in As Sifah is Flexible, used by 45% of listings.
- There's a relatively balanced mix between guest-friendly (60.0%) and stricter (20.0%) policies, offering choices for different guest needs.
Recommendations for Hosts
- Consider adopting a Flexible policy to align with the 45% market standard in As Sifah.
- Regularly review your cancellation policy against competitors and market demand shifts in As Sifah.
As Sifah STR Booking Lead Time Analysis (2026)
Average Booking Lead Time by Month
Booking Lead Time Insights for As Sifah
- The overall average booking lead time for vacation rentals in As Sifah is 14 days.
- Guests book furthest in advance for stays during October (average 33 days), likely coinciding with peak travel demand or local events.
- The shortest booking windows occur for stays in May (average 5 days), indicating more last-minute travel plans during this time.
- Seasonally, Fall (20 days avg.) sees the longest lead times, while Summer (8 days avg.) has the shortest, reflecting typical travel planning cycles.
Recommendations for Hosts
- Use the overall average lead time (14 days) as a baseline for your pricing and availability strategy in As Sifah.
- For October stays, consider implementing length-of-stay discounts or slightly higher rates for bookings made less than 33 days out to capitalize on advance planning.
- During May, focus on last-minute booking availability and promotions, as guests book with very short notice (5 days avg.).
- Target marketing efforts for the Fall season well in advance (at least 20 days) to capture early planners.
- Monitor your own booking lead times against these As Sifah averages to identify opportunities for dynamic pricing adjustments.
Popular & Essential Airbnb Amenities in As Sifah (2026)
Amenity Prevalence
Amenity Insights for As Sifah
- Essential amenities in As Sifah that guests expect include: Free parking on premises, Air conditioning, Beach access, Kitchen, TV, Fire extinguisher. Lacking these (any) could significantly impact bookings.
- Popular amenities like Washer, Pool, Smoke alarm are common but not universal. Offering these can provide a competitive edge.
- A pool is a highly desired but not standard amenity, making it a key feature for attracting guests seeking leisure in As Sifah.
Recommendations for Hosts
- Ensure your listing includes all essential amenities for As Sifah: Free parking on premises, Air conditioning, Beach access, Kitchen, TV, Fire extinguisher.
- Prioritize adding missing essentials: Fire extinguisher.
- Consider adding popular differentiators like Washer or Pool to increase appeal.
- Highlight unique or less common amenities you offer (e.g., hot tub, dedicated workspace, EV charger) in your listing description and photos.
- Regularly check competitor amenities in As Sifah to stay competitive.
As Sifah Airbnb Guest Demographics & Profile Analysis (2026)
Guest Profile Summary for As Sifah
- The typical guest profile for Airbnb in As Sifah consists of predominantly international visitors (73%), with top international origins including United Kingdom, typically belonging to the Post-2000s (Gen Z/Alpha) group (50%), primarily speaking English or Arabic.
- Domestic travelers account for 26.8% of guests.
- Key international markets include Oman (26.8%) and United Kingdom (9.3%).
- Top languages spoken are English (42.7%) followed by Arabic (17.7%).
- A significant demographic segment is the Post-2000s (Gen Z/Alpha) group, representing 50% of guests.
Recommendations for Hosts
- Focus marketing internationally, particularly towards travelers from United Kingdom.
- Tailor amenities and listing descriptions to appeal to the dominant Post-2000s (Gen Z/Alpha) demographic (e.g., highlight fast WiFi, smart home features, local guides).
- Highlight unique local experiences or amenities relevant to the primary guest profile.
- Consider seasonal promotions aligned with peak travel times for key origin markets.
Nearby Short-Term Rental Market Comparison
How does the As Sifah Airbnb market stack up against its neighbors? Compare key performance metrics like average monthly revenue, ADR, and occupancy rates in surrounding areas to understand the broader regional STR landscape.
| Market | Active Properties | Monthly Revenue | Daily Rate | Avg. Occupancy |
|---|---|---|---|---|
| Ash Shab | 12 | $1,403 | $124.00 | 44% |
| Barka | 15 | $1,144 | $180.74 | 27% |
| Hillat al Kaws | 22 | $916 | $203.09 | 22% |
| Qantab | 32 | $883 | $111.58 | 34% |
| Nizwa | 15 | $705 | $127.89 | 29% |
| Muscat | 259 | $621 | $82.60 | 35% |
| Seeb | 44 | $584 | $93.46 | 30% |
| Ras Al Hadd | 18 | $321 | $65.34 | 24% |