Golra Sharif Airbnb Market Analysis 2026: Short Term Rental Data & Vacation Rental Statistics in Islamabad Capital Territory, Pakistan
Is Airbnb profitable in Golra Sharif in 2026? Explore comprehensive Airbnb analytics for Golra Sharif, Islamabad Capital Territory, Pakistan to uncover income potential. This 2026 STR market report for Golra Sharif, based on AirROI data from December 2024 to November 2025, reveals key trends in the niche market of 18 active listings.
Whether you're considering an Airbnb investment in Golra Sharif, optimizing your existing vacation rental, or exploring rental arbitrage opportunities, understanding the Golra Sharif Airbnb data is crucial. Leveraging the low regulation environment is key to maximizing your short term rental income potential. Let's dive into the specifics.
Key Golra Sharif Airbnb Performance Metrics Overview
Monthly Airbnb Revenue Variations & Income Potential in Golra Sharif (2026)
Understanding the monthly revenue variations for Airbnb listings in Golra Sharif is key to maximizing your short term rental income potential. Seasonality significantly impacts earnings. Our analysis, based on data from the past 12 months, shows that the peak revenue month for STRs in Golra Sharif is typically December, while June often presents the lowest earnings, highlighting opportunities for strategic pricing adjustments during shoulder and low seasons. Explore the typical Airbnb income in Golra Sharif across different performance tiers:
- Best-in-class properties (Top 10%) achieve $787+ monthly, often utilizing dynamic pricing and superior guest experiences.
- Strong performing properties (Top 25%) earn $421 or more, indicating effective management and desirable locations/amenities.
- Typical properties (Median) generate around $196 per month, representing the average market performance.
- Entry-level properties (Bottom 25%) see earnings around $78, often with potential for optimization.
Average Monthly Airbnb Earnings Trend in Golra Sharif
Golra Sharif Airbnb Occupancy Rate Trends (2026)
Maximize your bookings by understanding the Golra Sharif STR occupancy trends. Seasonal demand shifts significantly influence how often properties are booked. Typically, Aprilsees the highest demand (peak season occupancy), while June experiences the lowest (low season). Effective strategies, like adjusting minimum stays or offering promotions, can boost occupancy during slower periods. Here's how different property tiers perform in Golra Sharif:
- Best-in-class properties (Top 10%) achieve 66%+ occupancy, indicating high desirability and potentially optimized availability.
- Strong performing properties (Top 25%) maintain 41% or higher occupancy, suggesting good market fit and guest satisfaction.
- Typical properties (Median) have an occupancy rate around 23%.
- Entry-level properties (Bottom 25%) average 10% occupancy, potentially facing higher vacancy.
Average Monthly Occupancy Rate Trend in Golra Sharif
Average Daily Rate (ADR) Airbnb Trends in Golra Sharif (2026)
Effective short term rental pricing strategy in Golra Sharif involves understanding monthly ADR fluctuations. The Average Daily Rate (ADR) for Airbnb in Golra Sharif typically peaks in June and dips lowest during November. Leveraging Airbnb dynamic pricing tools or strategies based on this seasonality can significantly boost revenue. Here's a look at the typical nightly rates achieved:
- Best-in-class properties (Top 10%) command rates of $58+ per night, often due to premium features or locations.
- Strong performing properties (Top 25%) achieve nightly rates of $46 or more.
- Typical properties (Median) charge around $32 per night.
- Entry-level properties (Bottom 25%) earn around $22 per night.
Average Daily Rate (ADR) Trend by Month in Golra Sharif
Get Live Golra Sharif Market Intelligence 👇

Explore Real-time Analytics
Airbnb Seasonality Analysis & Trends in Golra Sharif (2025)
Peak Season (December, October, April)
- Revenue averages $426 per month
- Occupancy rates average 36.4%
- Daily rates average $37
Shoulder Season
- Revenue averages $292 per month
- Occupancy maintains around 29.4%
- Daily rates hold near $37
Low Season (February, March, June)
- Revenue drops to average $216 per month
- Occupancy decreases to average 22.3%
- Daily rates adjust to average $37
Seasonality Insights for Golra Sharif
- The Airbnb seasonality in Golra Sharif shows highly seasonal trends requiring careful strategy. While the sections above show seasonal averages, it's also insightful to look at the extremes:
- During the high season, the absolute peak month showcases Golra Sharif's highest earning potential, with monthly revenues capable of climbing to $608, occupancy reaching a high of 38.5%, and ADRs peaking at $38.
- Conversely, the slowest single month of the year, typically falling within the low season, marks the market's lowest point. In this month, revenue might dip to $180, occupancy could drop to 16.2%, and ADRs may adjust down to $36.
- Understanding both the seasonal averages and these monthly peaks and troughs in revenue, occupancy, and ADR is crucial for maximizing your Airbnb profit potential in Golra Sharif.
Seasonal Strategies for Maximizing Profit
- Peak Season: Maximize revenue through premium pricing and potentially longer minimum stays. Ensure high availability.
- Low Season: Offer competitive pricing, special promotions (e.g., extended stay discounts), and flexible cancellation policies. Target off-season travelers like remote workers or budget-conscious guests.
- Shoulder Seasons: Implement dynamic pricing that balances peak and low rates. Target weekend travelers or specific events. Offer slightly more flexible terms than peak season.
- Regularly analyze your own performance against these Golra Sharif seasonality benchmarks and adjust your pricing and availability strategy accordingly.
Best Areas for Airbnb Investment in Golra Sharif (2026)
Exploring the top neighborhoods for short-term rentals in Golra Sharif? This section highlights key areas, outlining why they are attractive for hosts and guests, along with notable local attractions. Consider these locations based on your target guest profile and investment strategy.
| Neighborhood / Area | Why Host Here? (Target Guests & Appeal) | Key Attractions & Landmarks |
|---|---|---|
| Golra Sharif | A historical and spiritual area known for its Sufi shrine and peaceful environment. It attracts pilgrims and visitors seeking tranquility and religious experiences. | Golra Sharif Shrine, Pakistan Railway Heritage Museum, Margalla Hills National Park, Lok Virsa Museum, Daman-e-Koh Viewpoint, Faisal Mosque |
| Faisal Mosque | One of the largest mosques in Pakistan, known for its unique architecture. A significant tourist attraction that draws visitors for its beauty and spiritual significance. | Faisal Mosque, Daman-e-Koh, Margalla Hills, Shakarparian Park, Pakistan Monument, Islamabad Zoo |
| Margalla Hills | A popular natural park known for hiking and stunning views of Islamabad. It attracts nature lovers and adventure seekers, ideal for those looking for outdoor activities. | Margalla Hills Trails, Monal Restaurant, Nature Walks, Wildlife Spotting, Panoramic Views of Islamabad, Picnic Spots |
| Islamabad Mini Golf | An engaging recreational area that attracts both families and tourists looking for leisure activities. Provides a fun outdoor experience away from the city hustle. | Mini Golf Course, Play Area for Kids, Cafes and Restaurants, Green Spaces, Family-friendly Activities, Events and Gatherings |
| Pakistan Monument | A national monument symbolizing the unity of Pakistan, it attracts a lot of visitors interested in history and culture. | Pakistan Monument Museum, National Art Gallery, Sculptures and Gardens, Viewpoints of Islamabad, Cultural Events |
| Lok Virsa Museum | A museum showcasing the cultural heritage of Pakistan, appealing to both locals and tourists interested in the arts and history. | Cultural Exhibitions, Artisan Workshops, Traditional Music Performances, Craft Stall, Documentaries on Local Culture, Educational Programs |
| Shakarparian | A beautiful park and viewpoint that is popular for family outings and gatherings, providing great views of the city and surrounding hills. | Japanese Park, Shakarparian Viewpoint, Picnic Areas, Walking Trails, Cafes, Event Spaces |
| Saidpur Village | A picturesque village that has been transformed into a cultural space, offering a glimpse of traditional architecture and artisan crafts. Attracts visitors for its ethnic vibe and restaurants. | Traditional Restaurants, Art Galleries, Cafes, Cultural Events, Craft Shops, Heritage Walks |
Understanding Airbnb License Requirements & STR Laws in Golra Sharif (2026)
While Golra Sharif, Islamabad Capital Territory, Pakistan currently shows low STR regulations, specific Airbnb license requirements might still exist or change. Always verify the latest short term rental regulations and Airbnb license requirements directly with local government authorities for Golra Sharif to ensure full compliance before hosting.
(Source: AirROI data, 2026, finding no licensed listings among those analyzed)
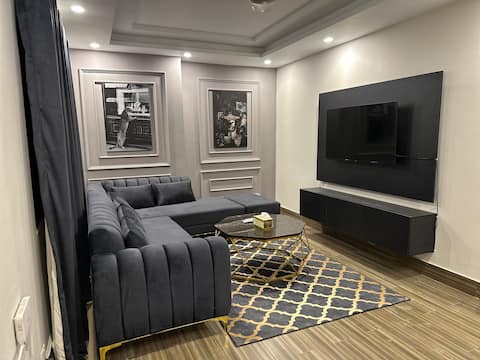
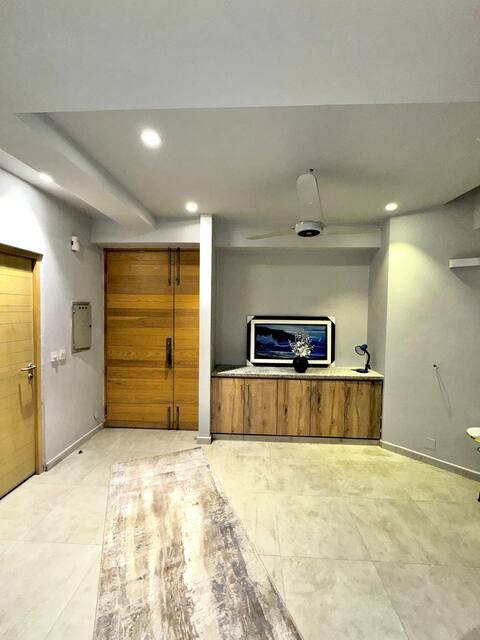
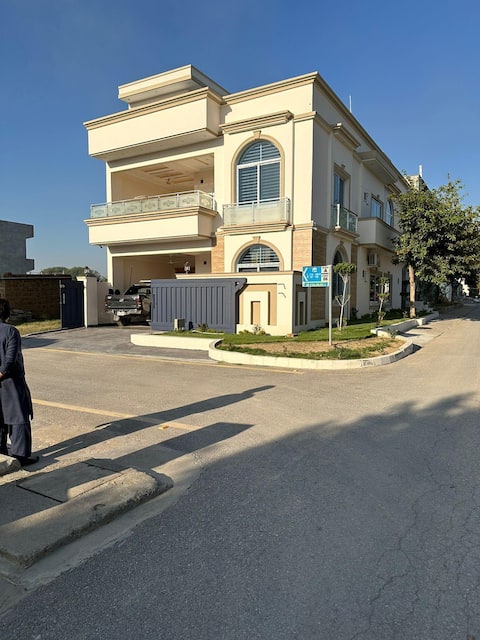
Top Performing Airbnb Properties in Golra Sharif (2026)
Benchmark your potential! Explore examples of top-performing Airbnb properties in Golra Sharifbased on Trailing Twelve Month (TTM) revenue. Analyze their characteristics, revenue, occupancy rate, and ADR to understand what drives success in this market.

The Grey Inn-2BHK/Netflix/Wifi/Balcony/AC/Lockbox
Entire Place • 2 bedrooms
The Grey Inn-3BHK/Wi-Fi/Netflix/Laundry/AC/Lockbox
Entire Place • 3 bedrooms
Essence Homes
Entire Place • 2 bedrooms
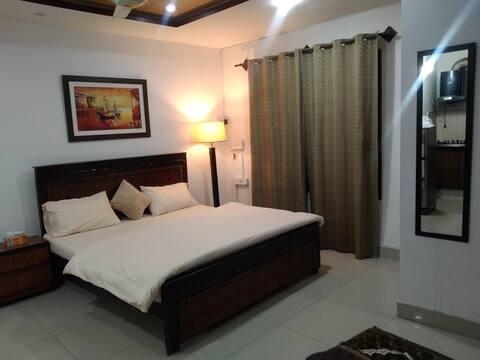
Elite Family Peaceful Stays - Mountains View
Entire Place • 1 bedroom
City Retreat
Entire Place • 6 bedrooms

Majestic Vista: Islamabad
Entire Place • 2 bedrooms
Note: Performance varies based on location, size, amenities, seasonality, and management quality. Data reflects the past 12 months.
Top Performing Airbnb Hosts in Golra Sharif (2026)
Learn from the best! This table showcases top-performing Airbnb hosts in Golra Sharif based on the number of properties managed and estimated total revenue over the past year. Analyze their scale and performance metrics.
| Host Name | Properties | Grossing Revenue | Stay Reviews | Avg Rating |
|---|---|---|---|---|
| Danyal | 2 | $14,661 | 119 | 4.78/5.0 |
| Ibrahim | 1 | $2,865 | 6 | 4.50/5.0 |
| Aamir Ali Fahad | 1 | $2,713 | 23 | 4.65/5.0 |
| Rafiullah | 1 | $2,260 | 1 | Not Rated |
| Ahmed | 1 | $1,109 | 31 | 4.84/5.0 |
| Khizr | 1 | $1,001 | 10 | 5.00/5.0 |
| Usman | 1 | $773 | 49 | 4.73/5.0 |
| Mohammad | 1 | $711 | 51 | 4.86/5.0 |
| Host #469109454 | 1 | $584 | 2 | Not Rated |
| Saifullah | 1 | $410 | 4 | 5.00/5.0 |
| Taha | 1 | $410 | 15 | 4.33/5.0 |
Analyzing the strategies of top hosts, such as their property selection, pricing, and guest communication, can offer valuable lessons for optimizing your own Airbnb operations in Golra Sharif.
Dive Deeper: Advanced Golra Sharif STR Market Data (2026)
Ready to unlock more insights? AirROI provides access to advanced metrics and comprehensive Airbnb data for Golra Sharif. Explore detailed analytics beyond this report to refine your investment strategy, optimize pricing, and maximize your vacation rental profits.
Explore Advanced MetricsGolra Sharif Short-Term Rental Market Composition (2026): Property & Room Types
Room Type Distribution
Property Type Distribution
Market Composition Insights for Golra Sharif
- The Golra Sharif Airbnb market composition is heavily skewed towards Entire Home/Apt listings, which make up 88.9% of the 18 active rentals. This indicates strong guest preference for privacy and space.
- Looking at the property type distribution in Golra Sharif, Apartment/Condo properties are the most common (94.4%), reflecting the local real estate landscape.
Golra Sharif Airbnb Room Capacity Analysis (2026): Bedroom Distribution
Distribution of Listings by Number of Bedrooms
Room Capacity Insights for Golra Sharif
- The dominant room capacity in Golra Sharif is 1 bedroom listings, making up 38.9% of the market. This suggests a strong demand for properties suitable for couples or solo travelers.
- Together, 1 bedroom and 2 bedrooms properties represent 72.2% of the active Airbnb listings in Golra Sharif, indicating a high concentration in these sizes.
- A significant 22.3% of listings offer 3+ bedrooms, catering to larger groups and families seeking more space in Golra Sharif.
Golra Sharif Vacation Rental Guest Capacity Trends (2026)
Distribution of Listings by Guest Capacity
Guest Capacity Insights for Golra Sharif
- The most common guest capacity trend in Golra Sharif vacation rentals is listings accommodating 2 guests (27.8%). This suggests the primary traveler segment is likely couples or solo travelers.
- Properties designed for 2 guests and 4 guests dominate the Golra Sharif STR market, accounting for 44.5% of listings.
- 22.3% of properties accommodate 6+ guests, serving the market segment for larger families or group travel in Golra Sharif.
- On average, properties in Golra Sharif are equipped to host 3.9 guests.
Golra Sharif Airbnb Booking Patterns (2026): Available vs. Booked Days
Available Days Distribution
Booked Days Distribution
Booking Pattern Insights for Golra Sharif
- The most common availability pattern in Golra Sharif falls within the 271-366 days range, representing 83.3% of listings. This suggests many properties have significant open periods on their calendars.
- Approximately 94.4% of listings show high availability (181+ days open annually), indicating potential for increased bookings or specific owner usage patterns.
- For booked days, the 1-30 days range is most frequent in Golra Sharif (66.7%), reflecting common guest stay durations or potential owner blocking patterns.
- A notable 5.6% of properties secure long booking periods (181+ days booked per year), highlighting successful long-term rental strategies or significant owner usage.
Golra Sharif Airbnb Minimum Stay Requirements Analysis
Distribution of Listings by Minimum Night Requirement
1 Night
17 listings
94.4% of total
30+ Nights
1 listings
5.6% of total
Key Insights
- The most prevalent minimum stay requirement in Golra Sharif is 1 Night, adopted by 94.4% of listings. This highlights the market's preference for shorter, flexible bookings.
- A strong majority (94.4%) of the Golra Sharif Airbnb data shows acceptance of very short stays (1-2 nights), indicating a dynamic, high-turnover market.
Recommendations
- Align with the market by considering a 1 Night minimum stay, as 94.4% of Golra Sharif hosts use this setting.
- Explore offering discounts for stays of 30+ nights to attract the 5.6% of the market seeking extended stays.
- Adjust minimum nights based on seasonality – potentially shorter during low season and longer during peak demand periods in Golra Sharif.
Golra Sharif Airbnb Cancellation Policy Trends Analysis (2026)
Flexible
13 listings
81.3% of total
Moderate
1 listings
6.3% of total
Strict
2 listings
12.5% of total
Cancellation Policy Insights for Golra Sharif
- The prevailing Airbnb cancellation policy trend in Golra Sharif is Flexible, used by 81.3% of listings.
- The market strongly favors guest-friendly terms, with 87.6% of listings offering Flexible or Moderate policies. This suggests guests in Golra Sharif may expect booking flexibility.
Recommendations for Hosts
- Consider adopting a Flexible policy to align with the 81.3% market standard in Golra Sharif.
- Given the high prevalence of Flexible policies (81.3%), offering this can enhance booking appeal, especially during shoulder seasons.
- Using a Strict policy might deter some guests, as only 12.5% of listings use it. Evaluate if potential revenue protection outweighs possible lower booking rates.
- Regularly review your cancellation policy against competitors and market demand shifts in Golra Sharif.
Golra Sharif STR Booking Lead Time Analysis (2026)
Average Booking Lead Time by Month
Booking Lead Time Insights for Golra Sharif
- The overall average booking lead time for vacation rentals in Golra Sharif is 6 days.
- Guests book furthest in advance for stays during March (average 11 days), likely coinciding with peak travel demand or local events.
- The shortest booking windows occur for stays in July (average 2 days), indicating more last-minute travel plans during this time.
- Seasonally, Fall (9 days avg.) sees the longest lead times, while Summer (4 days avg.) has the shortest, reflecting typical travel planning cycles.
Recommendations for Hosts
- Use the overall average lead time (6 days) as a baseline for your pricing and availability strategy in Golra Sharif.
- Target marketing efforts for the Fall season well in advance (at least 9 days) to capture early planners.
- Monitor your own booking lead times against these Golra Sharif averages to identify opportunities for dynamic pricing adjustments.
Popular & Essential Airbnb Amenities in Golra Sharif (2026)
Amenity Prevalence
Amenity Insights for Golra Sharif
- Essential amenities in Golra Sharif that guests expect include: Heating, Wifi, Air conditioning, TV. Lacking these (any) could significantly impact bookings.
- Popular amenities like Free parking on premises, Kitchen, Cooking basics are common but not universal. Offering these can provide a competitive edge.
Recommendations for Hosts
- Ensure your listing includes all essential amenities for Golra Sharif: Heating, Wifi, Air conditioning, TV.
- Consider adding popular differentiators like Free parking on premises or Kitchen to increase appeal.
- Highlight unique or less common amenities you offer (e.g., hot tub, dedicated workspace, EV charger) in your listing description and photos.
- Regularly check competitor amenities in Golra Sharif to stay competitive.
Golra Sharif Airbnb Guest Demographics & Profile Analysis (2026)
Guest Profile Summary for Golra Sharif
- The typical guest profile for Airbnb in Golra Sharif consists of predominantly international visitors (70%), with top international origins including Pakistan, typically belonging to the Post-2000s (Gen Z/Alpha) group (50%), primarily speaking English or Hindi.
- Domestic travelers account for 30.0% of guests.
- Key international markets include United Kingdom (34%) and Pakistan (30%).
- Top languages spoken are English (37.3%) followed by Hindi (24%).
- A significant demographic segment is the Post-2000s (Gen Z/Alpha) group, representing 50% of guests.
Recommendations for Hosts
- Focus marketing internationally, particularly towards travelers from Pakistan.
- Tailor amenities and listing descriptions to appeal to the dominant Post-2000s (Gen Z/Alpha) demographic (e.g., highlight fast WiFi, smart home features, local guides).
- Highlight unique local experiences or amenities relevant to the primary guest profile.
- Consider seasonal promotions aligned with peak travel times for key origin markets.
Nearby Short-Term Rental Market Comparison
How does the Golra Sharif Airbnb market stack up against its neighbors? Compare key performance metrics like average monthly revenue, ADR, and occupancy rates in surrounding areas to understand the broader regional STR landscape.
| Market | Active Properties | Monthly Revenue | Daily Rate | Avg. Occupancy |
|---|---|---|---|---|
| Barrian | 10 | $1,121 | $183.01 | 24% |
| Kalabagh | 16 | $377 | $124.26 | 21% |
| Blue Area | 17 | $315 | $46.36 | 35% |
| Zone III | 18 | $315 | $100.17 | 18% |
| Bourbon | 15 | $236 | $113.57 | 14% |
| Islamabad | 506 | $218 | $62.54 | 24% |
| Murree | 43 | $209 | $94.47 | 18% |
| Murree Tehsil | 11 | $201 | $76.96 | 14% |
| Zone IV | 75 | $201 | $52.65 | 22% |
| Rawalpindi Cantonment | 104 | $166 | $48.92 | 26% |