Zone III Airbnb Market Analysis 2026: Short Term Rental Data & Vacation Rental Statistics in Islamabad Capital Territory, Pakistan
Is Airbnb profitable in Zone III in 2026? Explore comprehensive Airbnb analytics for Zone III, Islamabad Capital Territory, Pakistan to uncover income potential. This 2026 STR market report for Zone III, based on AirROI data from January 2025 to December 2025, reveals key trends in the niche market of 20 active listings.
Whether you're considering an Airbnb investment in Zone III, optimizing your existing vacation rental, or exploring rental arbitrage opportunities, understanding the Zone III Airbnb data is crucial. Leveraging the low regulation environment is key to maximizing your short term rental income potential. Let's dive into the specifics.
Key Zone III Airbnb Performance Metrics Overview
Monthly Airbnb Revenue Variations & Income Potential in Zone III (2026)
Understanding the monthly revenue variations for Airbnb listings in Zone III is key to maximizing your short term rental income potential. Seasonality significantly impacts earnings. Our analysis, based on data from the past 12 months, shows that the peak revenue month for STRs in Zone III is typically July, while August often presents the lowest earnings, highlighting opportunities for strategic pricing adjustments during shoulder and low seasons. Explore the typical Airbnb income in Zone III across different performance tiers:
- Best-in-class properties (Top 10%) achieve $3,102+ monthly, often utilizing dynamic pricing and superior guest experiences.
- Strong performing properties (Top 25%) earn $1,412 or more, indicating effective management and desirable locations/amenities.
- Typical properties (Median) generate around $416 per month, representing the average market performance.
- Entry-level properties (Bottom 25%) see earnings around $222, often with potential for optimization.
Average Monthly Airbnb Earnings Trend in Zone III
Zone III Airbnb Occupancy Rate Trends (2026)
Maximize your bookings by understanding the Zone III STR occupancy trends. Seasonal demand shifts significantly influence how often properties are booked. Typically, Januarysees the highest demand (peak season occupancy), while September experiences the lowest (low season). Effective strategies, like adjusting minimum stays or offering promotions, can boost occupancy during slower periods. Here's how different property tiers perform in Zone III:
- Best-in-class properties (Top 10%) achieve 51%+ occupancy, indicating high desirability and potentially optimized availability.
- Strong performing properties (Top 25%) maintain 30% or higher occupancy, suggesting good market fit and guest satisfaction.
- Typical properties (Median) have an occupancy rate around 12%.
- Entry-level properties (Bottom 25%) average 8% occupancy, potentially facing higher vacancy.
Average Monthly Occupancy Rate Trend in Zone III
Average Daily Rate (ADR) Airbnb Trends in Zone III (2026)
Effective short term rental pricing strategy in Zone III involves understanding monthly ADR fluctuations. The Average Daily Rate (ADR) for Airbnb in Zone III typically peaks in July and dips lowest during March. Leveraging Airbnb dynamic pricing tools or strategies based on this seasonality can significantly boost revenue. Here's a look at the typical nightly rates achieved:
- Best-in-class properties (Top 10%) command rates of $150+ per night, often due to premium features or locations.
- Strong performing properties (Top 25%) achieve nightly rates of $102 or more.
- Typical properties (Median) charge around $59 per night.
- Entry-level properties (Bottom 25%) earn around $38 per night.
Average Daily Rate (ADR) Trend by Month in Zone III
Get Live Zone III Market Intelligence 👇

Explore Real-time Analytics
Airbnb Seasonality Analysis & Trends in Zone III (2025)
Peak Season (July, March, October)
- Revenue averages $1,889 per month
- Occupancy rates average 30.3%
- Daily rates average $77
Shoulder Season
- Revenue averages $951 per month
- Occupancy maintains around 22.9%
- Daily rates hold near $76
Low Season (June, August, September)
- Revenue drops to average $337 per month
- Occupancy decreases to average 9.8%
- Daily rates adjust to average $79
Seasonality Insights for Zone III
- The Airbnb seasonality in Zone III shows highly seasonal trends requiring careful strategy. While the sections above show seasonal averages, it's also insightful to look at the extremes:
- During the high season, the absolute peak month showcases Zone III's highest earning potential, with monthly revenues capable of climbing to $2,443, occupancy reaching a high of 35.1%, and ADRs peaking at $80.
- Conversely, the slowest single month of the year, typically falling within the low season, marks the market's lowest point. In this month, revenue might dip to $285, occupancy could drop to 7.5%, and ADRs may adjust down to $73.
- Understanding both the seasonal averages and these monthly peaks and troughs in revenue, occupancy, and ADR is crucial for maximizing your Airbnb profit potential in Zone III.
Seasonal Strategies for Maximizing Profit
- Peak Season: Maximize revenue through premium pricing and potentially longer minimum stays. Ensure high availability.
- Low Season: Offer competitive pricing, special promotions (e.g., extended stay discounts), and flexible cancellation policies. Target off-season travelers like remote workers or budget-conscious guests.
- Shoulder Seasons: Implement dynamic pricing that balances peak and low rates. Target weekend travelers or specific events. Offer slightly more flexible terms than peak season.
- Regularly analyze your own performance against these Zone III seasonality benchmarks and adjust your pricing and availability strategy accordingly.
Best Areas for Airbnb Investment in Zone III (2026)
Exploring the top neighborhoods for short-term rentals in Zone III? This section highlights key areas, outlining why they are attractive for hosts and guests, along with notable local attractions. Consider these locations based on your target guest profile and investment strategy.
| Neighborhood / Area | Why Host Here? (Target Guests & Appeal) | Key Attractions & Landmarks |
|---|---|---|
| F-7 | Central and trendy neighborhood known for its upscale dining, shopping, and cultural attractions. Ideal for tourists and expatriates looking for a vibrant urban experience in Islamabad. | Pakistan Monument, Shakarparian Park, Lok Virsa Museum, Daman-e-Koh, Safa Gold Mall |
| F-10 | Family-friendly area with a mix of residential and commercial offerings. Popular with both locals and tourists, providing accessibility to parks, restaurants, and markets. | Khanpur Dam, Fatima Jinnah Park, Centaurus Mall, Islamabad Zoo, Shah Faisal Mosque |
| Bahria Town | Modern development known for its gated communities and recreational facilities. Attracts visitors looking for a more luxurious stay with modern amenities and parks. | Bahria Grand Mosque, Bahria Country Club, Safari Park, Bahria Town Commercial Area, Pakistan Monument |
| G-6 | Historical neighborhood with easy access to government buildings and cultural sites. Ideal for those wanting to explore the political heart of Pakistan while staying in a lively area. | Supreme Court of Pakistan, Parliament House, Constitution Avenue, Art and Craft Village, Islamabad Arts Council |
| G-11 | Emerging area with a mix of local eateries and markets. Appeals to visitors who want an authentic Islamabad experience away from tourist hotspots. | G-11 Market, Shahpur Dam, Islamabad Tennis Complex, Parks and recreational areas, Local food stalls |
| F-8 | Vibrant area with popular restaurants and cafes, attracting both locals and tourists. Great for those who enjoy food and social life. | Safa Gold Mall, Sultan's Restaurant, Chota Bukhara, Margalla Hills hiking trails, Islamabad Golf Club |
| H-8 | Known for its proximity to educational institutions and hospitals, making it ideal for academic visitors and healthcare professionals requiring short stays. | Pakistan Institute of Medical Sciences, Nust University, Educational institutes, Public parks, Shopping plazas |
| Islamabad Zoo and surrounding areas | Tourist-friendly area close to the zoo and parks, perfect for families seeking leisure activities. | Islamabad Zoo, Faisal Mosque, Japanese Park, Bird Aviary, Shakarparian |
Understanding Airbnb License Requirements & STR Laws in Zone III (2026)
While Zone III, Islamabad Capital Territory, Pakistan currently shows low STR regulations, specific Airbnb license requirements might still exist or change. Always verify the latest short term rental regulations and Airbnb license requirements directly with local government authorities for Zone III to ensure full compliance before hosting.
(Source: AirROI data, 2026, finding no licensed listings among those analyzed)
Top Performing Airbnb Properties in Zone III (2026)
Benchmark your potential! Explore examples of top-performing Airbnb properties in Zone IIIbased on Trailing Twelve Month (TTM) revenue. Analyze their characteristics, revenue, occupancy rate, and ADR to understand what drives success in this market.
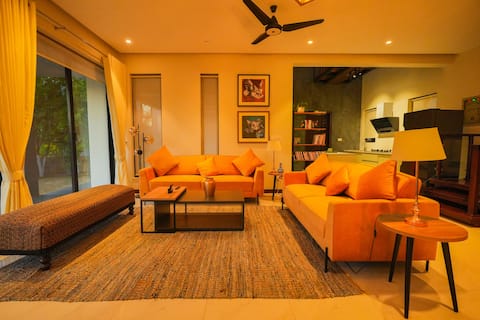
Luxury King size 5-Bed Guest House w/Pool & Garden
Entire Place • 5 bedrooms

Outclass home for Foreigners
Entire Place • 3 bedrooms
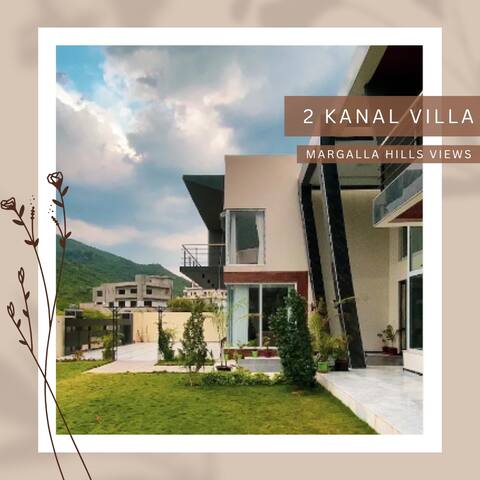
Luxury Villa | City Views | Main ISB
Entire Place • 3 bedrooms
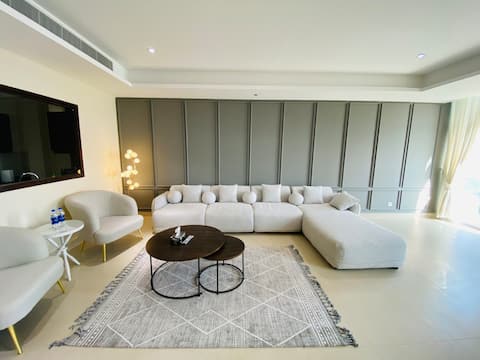
Beautiful Lake facing 3 bedroom Condo in Islamabad
Entire Place • 3 bedrooms

Amazing Mountain view, Pool, Relaxing atmosphere
Entire Place • 3 bedrooms
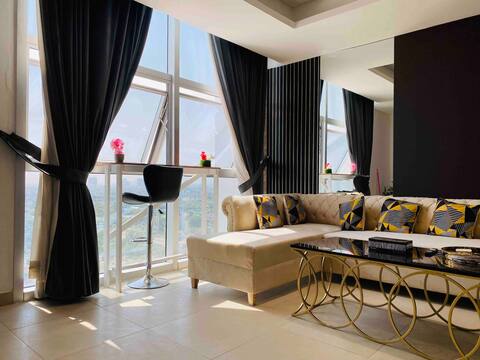
Black & Gold |1BHK Apartment| Margalla Hills View
Entire Place • 1 bedroom
Note: Performance varies based on location, size, amenities, seasonality, and management quality. Data reflects the past 12 months.
Top Performing Airbnb Hosts in Zone III (2026)
Learn from the best! This table showcases top-performing Airbnb hosts in Zone III based on the number of properties managed and estimated total revenue over the past year. Analyze their scale and performance metrics.
| Host Name | Properties | Grossing Revenue | Stay Reviews | Avg Rating |
|---|---|---|---|---|
| UNA SERVICES INTERNATIONAL Pvt | 2 | $37,078 | 18 | 4.76/5.0 |
| Hassan | 1 | $9,992 | 8 | 4.75/5.0 |
| Ali | 3 | $6,267 | 43 | 4.81/5.0 |
| Margalla Vacation Homes | 2 | $5,939 | 39 | 4.89/5.0 |
| Saad | 2 | $2,099 | 22 | 4.67/5.0 |
| Yuliana | 1 | $1,782 | 34 | 4.91/5.0 |
| Nabeel | 1 | $1,715 | 40 | 4.63/5.0 |
| Salman | 1 | $1,075 | 1 | Not Rated |
| Zafar | 1 | $1,066 | 79 | 4.82/5.0 |
| Anjum | 1 | $1,018 | 28 | 4.96/5.0 |
Analyzing the strategies of top hosts, such as their property selection, pricing, and guest communication, can offer valuable lessons for optimizing your own Airbnb operations in Zone III.
Dive Deeper: Advanced Zone III STR Market Data (2026)
Ready to unlock more insights? AirROI provides access to advanced metrics and comprehensive Airbnb data for Zone III. Explore detailed analytics beyond this report to refine your investment strategy, optimize pricing, and maximize your vacation rental profits.
Explore Advanced MetricsZone III Short-Term Rental Market Composition (2026): Property & Room Types
Room Type Distribution
Property Type Distribution
Market Composition Insights for Zone III
- The Zone III Airbnb market composition is heavily skewed towards Entire Home/Apt listings, which make up 90% of the 20 active rentals. This indicates strong guest preference for privacy and space.
- Looking at the property type distribution in Zone III, Apartment/Condo properties are the most common (45%), reflecting the local real estate landscape.
- Houses represent a significant 25% portion, catering likely to families or larger groups.
- The presence of 25% Hotel/Boutique listings indicates integration with traditional hospitality.
Zone III Airbnb Room Capacity Analysis (2026): Bedroom Distribution
Distribution of Listings by Number of Bedrooms
Room Capacity Insights for Zone III
- The dominant room capacity in Zone III is 1 bedroom listings, making up 40% of the market. This suggests a strong demand for properties suitable for couples or solo travelers.
- Together, 1 bedroom and 3 bedrooms properties represent 75.0% of the active Airbnb listings in Zone III, indicating a high concentration in these sizes.
- A significant 45.0% of listings offer 3+ bedrooms, catering to larger groups and families seeking more space in Zone III.
Zone III Vacation Rental Guest Capacity Trends (2026)
Distribution of Listings by Guest Capacity
Guest Capacity Insights for Zone III
- The most common guest capacity trend in Zone III vacation rentals is listings accommodating 8+ guests (45%). This suggests the primary traveler segment is likely larger groups.
- Properties designed for 8+ guests and 4 guests dominate the Zone III STR market, accounting for 70.0% of listings.
- 50.0% of properties accommodate 6+ guests, serving the market segment for larger families or group travel in Zone III.
- On average, properties in Zone III are equipped to host 5.3 guests.
Zone III Airbnb Booking Patterns (2026): Available vs. Booked Days
Available Days Distribution
Booked Days Distribution
Booking Pattern Insights for Zone III
- The most common availability pattern in Zone III falls within the 271-366 days range, representing 90% of listings. This suggests many properties have significant open periods on their calendars.
- Approximately 100.0% of listings show high availability (181+ days open annually), indicating potential for increased bookings or specific owner usage patterns.
- For booked days, the 1-30 days range is most frequent in Zone III (80%), reflecting common guest stay durations or potential owner blocking patterns.
Zone III Airbnb Minimum Stay Requirements Analysis
Distribution of Listings by Minimum Night Requirement
1 Night
10 listings
50% of total
2 Nights
1 listings
5% of total
4-6 Nights
1 listings
5% of total
7-29 Nights
5 listings
25% of total
30+ Nights
3 listings
15% of total
Key Insights
- The most prevalent minimum stay requirement in Zone III is 1 Night, adopted by 50% of listings. This highlights the market's preference for shorter, flexible bookings.
- A significant segment (15%) caters to monthly stays (30+ nights) in Zone III, pointing to opportunities in the extended-stay market.
Recommendations
- Align with the market by considering a 1 Night minimum stay, as 50% of Zone III hosts use this setting.
- Explore offering discounts for stays of 30+ nights to attract the 15% of the market seeking extended stays.
- Adjust minimum nights based on seasonality – potentially shorter during low season and longer during peak demand periods in Zone III.
Zone III Airbnb Cancellation Policy Trends Analysis (2026)
Flexible
6 listings
30% of total
Moderate
8 listings
40% of total
Firm
6 listings
30% of total
Cancellation Policy Insights for Zone III
- The prevailing Airbnb cancellation policy trend in Zone III is Moderate, used by 40% of listings.
- There's a relatively balanced mix between guest-friendly (70.0%) and stricter (30.0%) policies, offering choices for different guest needs.
Recommendations for Hosts
- Consider adopting a Moderate policy to align with the 40% market standard in Zone III.
- Regularly review your cancellation policy against competitors and market demand shifts in Zone III.
Zone III STR Booking Lead Time Analysis (2026)
Average Booking Lead Time by Month
Booking Lead Time Insights for Zone III
- The overall average booking lead time for vacation rentals in Zone III is 11 days.
- Guests book furthest in advance for stays during October (average 36 days), likely coinciding with peak travel demand or local events.
- The shortest booking windows occur for stays in September (average 1 days), indicating more last-minute travel plans during this time.
- Seasonally, Spring (16 days avg.) sees the longest lead times, while Summer (5 days avg.) has the shortest, reflecting typical travel planning cycles.
Recommendations for Hosts
- Use the overall average lead time (11 days) as a baseline for your pricing and availability strategy in Zone III.
- For October stays, consider implementing length-of-stay discounts or slightly higher rates for bookings made less than 36 days out to capitalize on advance planning.
- During September, focus on last-minute booking availability and promotions, as guests book with very short notice (1 days avg.).
- Target marketing efforts for the Spring season well in advance (at least 16 days) to capture early planners.
- Monitor your own booking lead times against these Zone III averages to identify opportunities for dynamic pricing adjustments.
Popular & Essential Airbnb Amenities in Zone III (2026)
Amenity Prevalence
Amenity Insights for Zone III
- Essential amenities in Zone III that guests expect include: Free parking on premises, Hot water, Kitchen, Heating, Air conditioning, Wifi, TV, Dishes and silverware. Lacking these (any) could significantly impact bookings.
- Popular amenities like Hangers, Iron are common but not universal. Offering these can provide a competitive edge.
Recommendations for Hosts
- Ensure your listing includes all essential amenities for Zone III: Free parking on premises, Hot water, Kitchen, Heating, Air conditioning, Wifi, TV, Dishes and silverware.
- Prioritize adding missing essentials: Hot water, Kitchen, Heating, Air conditioning, Wifi, TV, Dishes and silverware.
- Consider adding popular differentiators like Hangers or Iron to increase appeal.
- Highlight unique or less common amenities you offer (e.g., hot tub, dedicated workspace, EV charger) in your listing description and photos.
- Regularly check competitor amenities in Zone III to stay competitive.
Zone III Airbnb Guest Demographics & Profile Analysis (2026)
Guest Profile Summary for Zone III
- The typical guest profile for Airbnb in Zone III consists of a mix of domestic (39%) and international guests, with top international origins including United Kingdom, typically belonging to the Post-2000s (Gen Z/Alpha) group (50%), primarily speaking English or Urdu.
- Domestic travelers account for 39.1% of guests.
- Key international markets include Pakistan (39.1%) and United Kingdom (17.4%).
- Top languages spoken are English (33.3%) followed by Urdu (23.3%).
- A significant demographic segment is the Post-2000s (Gen Z/Alpha) group, representing 50% of guests.
Recommendations for Hosts
- Focus marketing internationally, particularly towards travelers from United Kingdom.
- Tailor amenities and listing descriptions to appeal to the dominant Post-2000s (Gen Z/Alpha) demographic (e.g., highlight fast WiFi, smart home features, local guides).
- Highlight unique local experiences or amenities relevant to the primary guest profile.
- Consider seasonal promotions aligned with peak travel times for key origin markets.
Nearby Short-Term Rental Market Comparison
How does the Zone III Airbnb market stack up against its neighbors? Compare key performance metrics like average monthly revenue, ADR, and occupancy rates in surrounding areas to understand the broader regional STR landscape.
| Market | Active Properties | Monthly Revenue | Daily Rate | Avg. Occupancy |
|---|---|---|---|---|
| Barrian | 10 | $1,132 | $179.97 | 24% |
| Tangmarg | 17 | $947 | $293.21 | 20% |
| Kalabagh | 16 | $394 | $122.25 | 22% |
| Tailbal(Habak Shanpora) | 18 | $361 | $66.70 | 29% |
| Srinagar | 250 | $331 | $94.27 | 25% |
| Blue Area | 16 | $313 | $46.72 | 33% |
| Murree | 40 | $230 | $95.57 | 18% |
| Islamabad | 497 | $216 | $62.14 | 24% |
| Murree Tehsil | 10 | $205 | $73.37 | 14% |
| Zone IV | 71 | $201 | $53.73 | 22% |