Chung Airbnb Market Analysis 2026: Short Term Rental Data & Vacation Rental Statistics in Punjab, Pakistan
Is Airbnb profitable in Chung in 2026? Explore comprehensive Airbnb analytics for Chung, Punjab, Pakistan to uncover income potential. This 2026 STR market report for Chung, based on AirROI data from May 2024 to April 2025, reveals key trends in the niche market of 19 active listings.
Whether you're considering an Airbnb investment in Chung, optimizing your existing vacation rental, or exploring rental arbitrage opportunities, understanding the Chung Airbnb data is crucial. Leveraging the low regulation environment is key to maximizing your short term rental income potential. Let's dive into the specifics.
Key Chung Airbnb Performance Metrics Overview
Monthly Airbnb Revenue Variations & Income Potential in Chung (2026)
Understanding the monthly revenue variations for Airbnb listings in Chung is key to maximizing your short term rental income potential. Seasonality significantly impacts earnings. Our analysis, based on data from the past 12 months, shows that the peak revenue month for STRs in Chung is typically March, while September often presents the lowest earnings, highlighting opportunities for strategic pricing adjustments during shoulder and low seasons. Explore the typical Airbnb income in Chung across different performance tiers:
- Best-in-class properties (Top 10%) achieve $1,253+ monthly, often utilizing dynamic pricing and superior guest experiences.
- Strong performing properties (Top 25%) earn $685 or more, indicating effective management and desirable locations/amenities.
- Typical properties (Median) generate around $438 per month, representing the average market performance.
- Entry-level properties (Bottom 25%) see earnings around $272, often with potential for optimization.
Average Monthly Airbnb Earnings Trend in Chung
Chung Airbnb Occupancy Rate Trends (2026)
Maximize your bookings by understanding the Chung STR occupancy trends. Seasonal demand shifts significantly influence how often properties are booked. Typically, Maysees the highest demand (peak season occupancy), while March experiences the lowest (low season). Effective strategies, like adjusting minimum stays or offering promotions, can boost occupancy during slower periods. Here's how different property tiers perform in Chung:
- Best-in-class properties (Top 10%) achieve 42%+ occupancy, indicating high desirability and potentially optimized availability.
- Strong performing properties (Top 25%) maintain 34% or higher occupancy, suggesting good market fit and guest satisfaction.
- Typical properties (Median) have an occupancy rate around 18%.
- Entry-level properties (Bottom 25%) average 15% occupancy, potentially facing higher vacancy.
Average Monthly Occupancy Rate Trend in Chung
Average Daily Rate (ADR) Airbnb Trends in Chung (2026)
Effective short term rental pricing strategy in Chung involves understanding monthly ADR fluctuations. The Average Daily Rate (ADR) for Airbnb in Chung typically peaks in February and dips lowest during September. Leveraging Airbnb dynamic pricing tools or strategies based on this seasonality can significantly boost revenue. Here's a look at the typical nightly rates achieved:
- Best-in-class properties (Top 10%) command rates of $49+ per night, often due to premium features or locations.
- Strong performing properties (Top 25%) achieve nightly rates of $40 or more.
- Typical properties (Median) charge around $30 per night.
- Entry-level properties (Bottom 25%) earn around $23 per night.
Average Daily Rate (ADR) Trend by Month in Chung
Get Live Chung Market Intelligence 👇

Explore Real-time Analytics
Airbnb Seasonality Analysis & Trends in Chung (2025)
Peak Season (March, February, January)
- Revenue averages $1,195 per month
- Occupancy rates average 11.8%
- Daily rates average $36
Shoulder Season
- Revenue averages $709 per month
- Occupancy maintains around 43.9%
- Daily rates hold near $33
Low Season (August, September, October)
- Revenue drops to average $51 per month
- Occupancy decreases to average 4.5%
- Daily rates adjust to average $32
Seasonality Insights for Chung
- The Airbnb seasonality in Chung shows highly seasonal trends requiring careful strategy. While the sections above show seasonal averages, it's also insightful to look at the extremes:
- During the high season, the absolute peak month showcases Chung's highest earning potential, with monthly revenues capable of climbing to $1,350, occupancy reaching a high of 83.9%, and ADRs peaking at $36.
- Conversely, the slowest single month of the year, typically falling within the low season, marks the market's lowest point. In this month, revenue might dip to $29, occupancy could drop to 3.2%, and ADRs may adjust down to $32.
- Understanding both the seasonal averages and these monthly peaks and troughs in revenue, occupancy, and ADR is crucial for maximizing your Airbnb profit potential in Chung.
Seasonal Strategies for Maximizing Profit
- Peak Season: Maximize revenue through premium pricing and potentially longer minimum stays. Ensure high availability.
- Low Season: Offer competitive pricing, special promotions (e.g., extended stay discounts), and flexible cancellation policies. Target off-season travelers like remote workers or budget-conscious guests.
- Shoulder Seasons: Implement dynamic pricing that balances peak and low rates. Target weekend travelers or specific events. Offer slightly more flexible terms than peak season.
- Regularly analyze your own performance against these Chung seasonality benchmarks and adjust your pricing and availability strategy accordingly.
Best Areas for Airbnb Investment in Chung (2026)
Exploring the top neighborhoods for short-term rentals in Chung? This section highlights key areas, outlining why they are attractive for hosts and guests, along with notable local attractions. Consider these locations based on your target guest profile and investment strategy.
| Neighborhood / Area | Why Host Here? (Target Guests & Appeal) | Key Attractions & Landmarks |
|---|---|---|
| Faisalabad | The third-largest city in Pakistan, known for its rich textile industry and bustling commerce. A key destination for business travelers and tourists alike, making it a prime area for Airbnb hosting. | Faisalabad Clock Tower, Jinnah Garden, D Ground market, Gatwala Wildlife Park, Lyallpur Museum |
| Multan | An ancient city with a rich history and strong cultural heritage. Known for its beautiful shrines and historic sites, attracting both local and international tourists. | Shah Rukn-e-Alam Shrine, Multan Fort, Tomb of Bahauddin Zakariya, Multan Arts Council, Saint Mary Church |
| Lahore | The cultural capital of Pakistan, renowned for its historical landmarks, vibrant food scene, and lively atmosphere. A top tourist destination that ensures high demand for accommodations. | Badshahi Mosque, Lahore Fort, Shalimar Gardens, Anarkali Bazaar, Lahore Museum |
| Sargodha | Known as the 'Roof of Punjab', Sargodha's agriculture and natural beauty attract visitors. It's gradually becoming a hotspot for short-term rentals. | Sargodha Park, Shaheen Park, Ghazibad, Khanqah Sharif, Sargodha Museum |
| Rawalpindi | Situated adjacent to Islamabad, Rawalpindi serves as an important commercial hub and access point for tourists visiting the capital and nearby areas. | Ayub National Park, Pakistan Museum of Natural History, Rawalpindi Arts Council, Gora Cemetery, Allied Bank Tower |
| Gujranwala | A city known for its production of metal goods and pottery, offering a unique insight into local crafts and trades, appealing to cultural tourists. | Gujranwala Fort, Shalimar Park, Kacheri Chowk, Sadiqia Mosque, Gujranwala Arts Council |
| Mandi Bahauddin | A lesser-known but charming city with agricultural significance, attracting rural tourism and those interested in nature and local culture. | Bhagat Singh Park, Mandi Bahauddin Railway Station, Historic Shrines, Local Bazaars, Rural Tourism Sites |
| Kasur | Famous for its historical significance and the town of the legendary poet Bulleh Shah, Kasur attracts cultural and historical tourists. | Bulleh Shah's Shrine, Kasur Fort, Kachiwala, Local Festivals, Traditional Crafts |
Understanding Airbnb License Requirements & STR Laws in Chung (2026)
While Chung, Punjab, Pakistan currently shows low STR regulations, specific Airbnb license requirements might still exist or change. Always verify the latest short term rental regulations and Airbnb license requirements directly with local government authorities for Chung to ensure full compliance before hosting.
(Source: AirROI data, 2026, finding no licensed listings among those analyzed)
Top Performing Airbnb Properties in Chung (2026)
Benchmark your potential! Explore examples of top-performing Airbnb properties in Chungbased on Trailing Twelve Month (TTM) revenue. Analyze their characteristics, revenue, occupancy rate, and ADR to understand what drives success in this market.
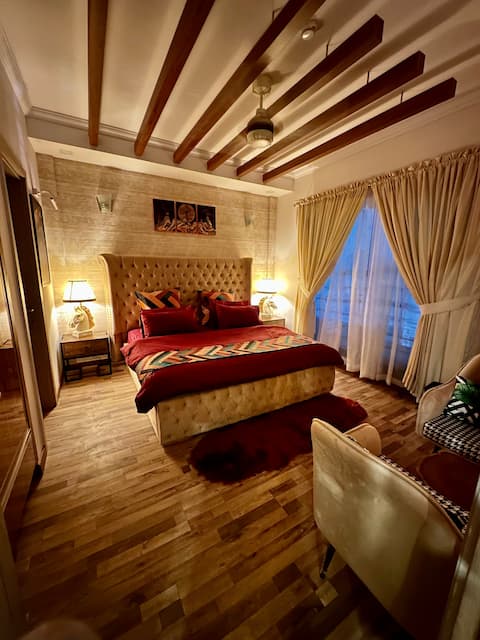
Château d’Sarcelle | The Royal Escape
Entire Place • 2 bedrooms
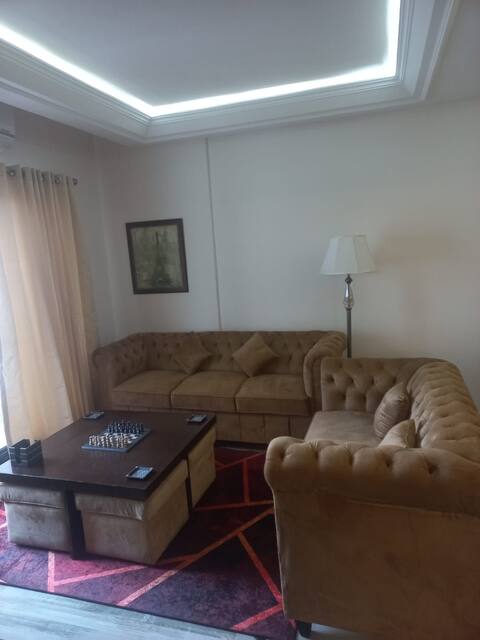
3 Bed Safe & Family Friendly Apt
Entire Place • 3 bedrooms

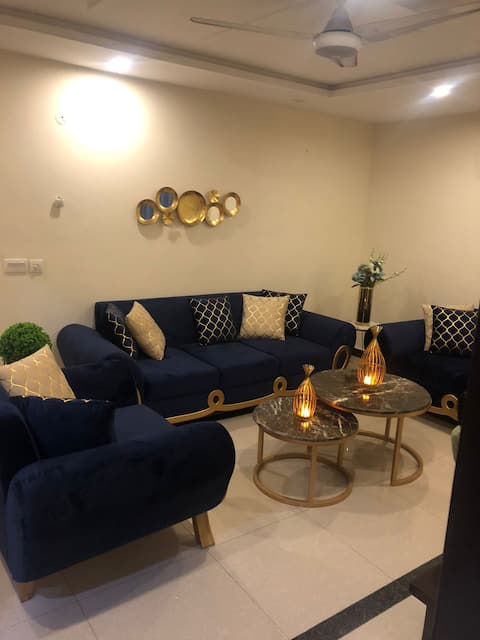
Ground apartment with parking
Entire Place • 3 bedrooms
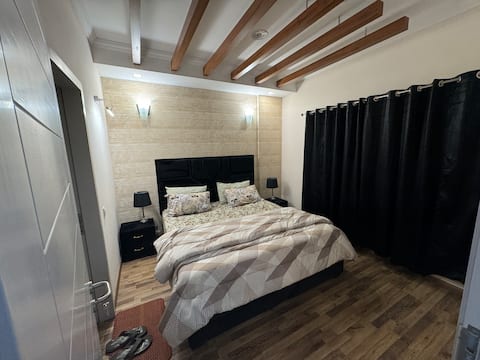
Private Luxury Apartment's
Entire Place • 2 bedrooms
1BHK luxury furnished appartment
Entire Place • 1 bedroom
Furnished 2 Bedroom House with Executive Lounge
Entire Place • 2 bedrooms
Note: Performance varies based on location, size, amenities, seasonality, and management quality. Data reflects the past 12 months.
Top Performing Airbnb Hosts in Chung (2026)
Learn from the best! This table showcases top-performing Airbnb hosts in Chung based on the number of properties managed and estimated total revenue over the past year. Analyze their scale and performance metrics.
| Host Name | Properties | Grossing Revenue | Stay Reviews | Avg Rating |
|---|---|---|---|---|
| HaSan | 2 | $8,803 | 9 | 2.50/5.0 |
| Rizwan | 3 | $6,914 | 19 | 3.24/5.0 |
| Host #436505990 | 1 | $3,727 | 0 | 0.00/5.0 |
| Host #482895051 | 1 | $3,389 | 0 | 0.00/5.0 |
| Host #483956711 | 2 | $3,222 | 26 | 4.93/5.0 |
| Host #450936512 | 1 | $3,070 | 0 | 0.00/5.0 |
| Host #437930269 | 1 | $2,803 | 0 | 0.00/5.0 |
| Host #417108025 | 1 | $2,392 | 0 | 0.00/5.0 |
| Host #257936540 | 1 | $2,343 | 0 | 0.00/5.0 |
| Host #422992339 | 1 | $2,140 | 0 | 0.00/5.0 |
Analyzing the strategies of top hosts, such as their property selection, pricing, and guest communication, can offer valuable lessons for optimizing your own Airbnb operations in Chung.
Dive Deeper: Advanced Chung STR Market Data (2026)
Ready to unlock more insights? AirROI provides access to advanced metrics and comprehensive Airbnb data for Chung. Explore detailed analytics beyond this report to refine your investment strategy, optimize pricing, and maximize your vacation rental profits.
Explore Advanced MetricsChung Short-Term Rental Market Composition (2026): Property & Room Types
Room Type Distribution
Property Type Distribution
Market Composition Insights for Chung
- The Chung Airbnb market composition is heavily skewed towards Entire Home/Apt listings, which make up 89.5% of the 19 active rentals. This indicates strong guest preference for privacy and space.
- Looking at the property type distribution in Chung, Apartment/Condo properties are the most common (94.7%), reflecting the local real estate landscape.
Chung Airbnb Room Capacity Analysis (2026): Bedroom Distribution
Distribution of Listings by Number of Bedrooms
Room Capacity Insights for Chung
- The dominant room capacity in Chung is 1 bedroom listings, making up 63.2% of the market. This suggests a strong demand for properties suitable for couples or solo travelers.
- Together, 1 bedroom and 2 bedrooms properties represent 89.5% of the active Airbnb listings in Chung, indicating a high concentration in these sizes.
- With over half the market (63.2%) consisting of studios or 1-bedroom units, Chung is particularly well-suited for individuals or couples.
Chung Vacation Rental Guest Capacity Trends (2026)
Distribution of Listings by Guest Capacity
Guest Capacity Insights for Chung
- The most common guest capacity trend in Chung vacation rentals is listings accommodating 2 guests (47.4%). This suggests the primary traveler segment is likely couples or solo travelers.
- Properties designed for 2 guests and 6 guests dominate the Chung STR market, accounting for 68.5% of listings.
- A significant 47.4% of listings cater specifically to 1-2 guests, highlighting strong demand from couples and solo travelers in Chung.
- 21.1% of properties accommodate 6+ guests, serving the market segment for larger families or group travel in Chung.
- On average, properties in Chung are equipped to host 3.3 guests.
Chung Airbnb Booking Patterns (2026): Available vs. Booked Days
Available Days Distribution
Booked Days Distribution
Booking Pattern Insights for Chung
- The most common availability pattern in Chung falls within the 271-366 days range, representing 94.7% of listings. This suggests many properties have significant open periods on their calendars.
- Approximately 100.0% of listings show high availability (181+ days open annually), indicating potential for increased bookings or specific owner usage patterns.
- For booked days, the 31-90 days range is most frequent in Chung (84.2%), reflecting common guest stay durations or potential owner blocking patterns.
Chung Airbnb Minimum Stay Requirements Analysis
Distribution of Listings by Minimum Night Requirement
1 Night
15 listings
100% of total
Key Insights
- The most prevalent minimum stay requirement in Chung is 1 Night, adopted by 100% of listings. This highlights the market's preference for shorter, flexible bookings.
- A strong majority (100.0%) of the Chung Airbnb data shows acceptance of very short stays (1-2 nights), indicating a dynamic, high-turnover market.
Recommendations
- Align with the market by considering a 1 Night minimum stay, as 100% of Chung hosts use this setting.
- Adjust minimum nights based on seasonality – potentially shorter during low season and longer during peak demand periods in Chung.
Chung Airbnb Cancellation Policy Trends Analysis (2026)
Flexible
3 listings
60% of total
Moderate
2 listings
40% of total
Cancellation Policy Insights for Chung
- The prevailing Airbnb cancellation policy trend in Chung is Flexible, used by 60% of listings.
- The market strongly favors guest-friendly terms, with 100.0% of listings offering Flexible or Moderate policies. This suggests guests in Chung may expect booking flexibility.
Recommendations for Hosts
- Consider adopting a Flexible policy to align with the 60% market standard in Chung.
- Given the high prevalence of Flexible policies (60%), offering this can enhance booking appeal, especially during shoulder seasons.
- Regularly review your cancellation policy against competitors and market demand shifts in Chung.
Chung STR Booking Lead Time Analysis (2026)
Average Booking Lead Time by Month
Booking Lead Time Insights for Chung
- The overall average booking lead time for vacation rentals in Chung is 8 days.
- Guests book furthest in advance for stays during December (average 30 days), likely coinciding with peak travel demand or local events.
- The shortest booking windows occur for stays in June (average 0 days), indicating more last-minute travel plans during this time.
- Seasonally, Winter (13 days avg.) sees the longest lead times, while Summer (1 days avg.) has the shortest, reflecting typical travel planning cycles.
Recommendations for Hosts
- Use the overall average lead time (8 days) as a baseline for your pricing and availability strategy in Chung.
- For December stays, consider implementing length-of-stay discounts or slightly higher rates for bookings made less than 30 days out to capitalize on advance planning.
- During June, focus on last-minute booking availability and promotions, as guests book with very short notice (0 days avg.).
- Target marketing efforts for the Winter season well in advance (at least 13 days) to capture early planners.
- Monitor your own booking lead times against these Chung averages to identify opportunities for dynamic pricing adjustments.
Popular & Essential Airbnb Amenities in Chung (2026)
Amenity Prevalence
Amenity Insights for Chung
- Essential amenities in Chung that guests expect include: Kitchen, Wifi, TV, Air conditioning. Lacking these (any) could significantly impact bookings.
- Popular amenities like Heating, Essentials, Smoke alarm are common but not universal. Offering these can provide a competitive edge.
Recommendations for Hosts
- Ensure your listing includes all essential amenities for Chung: Kitchen, Wifi, TV, Air conditioning.
- Consider adding popular differentiators like Heating or Essentials to increase appeal.
- Highlight unique or less common amenities you offer (e.g., hot tub, dedicated workspace, EV charger) in your listing description and photos.
- Regularly check competitor amenities in Chung to stay competitive.
Chung Airbnb Guest Demographics & Profile Analysis (2026)
Guest Profile Summary for Chung
- The typical guest profile for Airbnb in Chung consists of primarily domestic travelers (75%), often arriving from nearby Islamabad, typically belonging to the Post-2000s (Gen Z/Alpha) group (50%), primarily speaking English or Urdu.
- Domestic travelers account for 75.0% of guests.
- Key international markets include Pakistan (75%) and United Kingdom (12.5%).
- Top languages spoken are English (42.4%) followed by Urdu (24.2%).
- A significant demographic segment is the Post-2000s (Gen Z/Alpha) group, representing 50% of guests.
Recommendations for Hosts
- Target domestic marketing efforts towards travelers from Islamabad and Lahore.
- Tailor amenities and listing descriptions to appeal to the dominant Post-2000s (Gen Z/Alpha) demographic (e.g., highlight fast WiFi, smart home features, local guides).
- Highlight unique local experiences or amenities relevant to the primary guest profile.
- Consider seasonal promotions aligned with peak travel times for key origin markets.
Nearby Short-Term Rental Market Comparison
How does the Chung Airbnb market stack up against its neighbors? Compare key performance metrics like average monthly revenue, ADR, and occupancy rates in surrounding areas to understand the broader regional STR landscape.
| Market | Active Properties | Monthly Revenue | Daily Rate | Avg. Occupancy |
|---|---|---|---|---|
| Mananwala Khurd | 15 | $1,375 | $156.95 | 22% |
| Gumtala | 10 | $1,243 | $117.99 | 27% |
| Lidher | 14 | $1,193 | $207.60 | 16% |
| Kamboh | 13 | $894 | $145.38 | 25% |
| Derh Pindi | 10 | $745 | $137.91 | 19% |
| Dalhousie | 109 | $555 | $85.09 | 22% |
| Dhira | 10 | $495 | $64.95 | 24% |
| Keer | 62 | $435 | $60.15 | 25% |
| Charr | 36 | $422 | $62.41 | 23% |
| Roranwala | 41 | $389 | $51.80 | 27% |