Sheikh Kot Airbnb Market Analysis 2026: Short Term Rental Data & Vacation Rental Statistics in Punjab, Pakistan
Is Airbnb profitable in Sheikh Kot in 2026? Explore comprehensive Airbnb analytics for Sheikh Kot, Punjab, Pakistan to uncover income potential. This 2026 STR market report for Sheikh Kot, based on AirROI data from February 2025 to January 2026, reveals key trends in the niche market of 46 active listings.
Whether you're considering an Airbnb investment in Sheikh Kot, optimizing your existing vacation rental, or exploring rental arbitrage opportunities, understanding the Sheikh Kot Airbnb data is crucial. Leveraging the low regulation environment is key to maximizing your short term rental income potential. Let's dive into the specifics.
Key Sheikh Kot Airbnb Performance Metrics Overview
Monthly Airbnb Revenue Variations & Income Potential in Sheikh Kot (2026)
Understanding the monthly revenue variations for Airbnb listings in Sheikh Kot is key to maximizing your short term rental income potential. Seasonality significantly impacts earnings. Our analysis, based on data from the past 12 months, shows that the peak revenue month for STRs in Sheikh Kot is typically January, while September often presents the lowest earnings, highlighting opportunities for strategic pricing adjustments during shoulder and low seasons. Explore the typical Airbnb income in Sheikh Kot across different performance tiers:
- Best-in-class properties (Top 10%) achieve $349+ monthly, often utilizing dynamic pricing and superior guest experiences.
- Strong performing properties (Top 25%) earn $151 or more, indicating effective management and desirable locations/amenities.
- Typical properties (Median) generate around $86 per month, representing the average market performance.
- Entry-level properties (Bottom 25%) see earnings around $41, often with potential for optimization.
Average Monthly Airbnb Earnings Trend in Sheikh Kot
Sheikh Kot Airbnb Occupancy Rate Trends (2026)
Maximize your bookings by understanding the Sheikh Kot STR occupancy trends. Seasonal demand shifts significantly influence how often properties are booked. Typically, Februarysees the highest demand (peak season occupancy), while September experiences the lowest (low season). Effective strategies, like adjusting minimum stays or offering promotions, can boost occupancy during slower periods. Here's how different property tiers perform in Sheikh Kot:
- Best-in-class properties (Top 10%) achieve 51%+ occupancy, indicating high desirability and potentially optimized availability.
- Strong performing properties (Top 25%) maintain 27% or higher occupancy, suggesting good market fit and guest satisfaction.
- Typical properties (Median) have an occupancy rate around 15%.
- Entry-level properties (Bottom 25%) average 6% occupancy, potentially facing higher vacancy.
Average Monthly Occupancy Rate Trend in Sheikh Kot
Average Daily Rate (ADR) Airbnb Trends in Sheikh Kot (2026)
Effective short term rental pricing strategy in Sheikh Kot involves understanding monthly ADR fluctuations. The Average Daily Rate (ADR) for Airbnb in Sheikh Kot typically peaks in July and dips lowest during December. Leveraging Airbnb dynamic pricing tools or strategies based on this seasonality can significantly boost revenue. Here's a look at the typical nightly rates achieved:
- Best-in-class properties (Top 10%) command rates of $40+ per night, often due to premium features or locations.
- Strong performing properties (Top 25%) achieve nightly rates of $28 or more.
- Typical properties (Median) charge around $23 per night.
- Entry-level properties (Bottom 25%) earn around $18 per night.
Average Daily Rate (ADR) Trend by Month in Sheikh Kot
Get Live Sheikh Kot Market Intelligence 👇

Explore Real-time Analytics
Airbnb Seasonality Analysis & Trends in Sheikh Kot (2026)
Peak Season (January, February, April)
- Revenue averages $184 per month
- Occupancy rates average 28.0%
- Daily rates average $26
Shoulder Season
- Revenue averages $133 per month
- Occupancy maintains around 19.0%
- Daily rates hold near $26
Low Season (July, September, November)
- Revenue drops to average $99 per month
- Occupancy decreases to average 14.2%
- Daily rates adjust to average $26
Seasonality Insights for Sheikh Kot
- The Airbnb seasonality in Sheikh Kot shows highly seasonal trends requiring careful strategy. While the sections above show seasonal averages, it's also insightful to look at the extremes:
- During the high season, the absolute peak month showcases Sheikh Kot's highest earning potential, with monthly revenues capable of climbing to $201, occupancy reaching a high of 31.0%, and ADRs peaking at $27.
- Conversely, the slowest single month of the year, typically falling within the low season, marks the market's lowest point. In this month, revenue might dip to $81, occupancy could drop to 11.3%, and ADRs may adjust down to $25.
- Understanding both the seasonal averages and these monthly peaks and troughs in revenue, occupancy, and ADR is crucial for maximizing your Airbnb profit potential in Sheikh Kot.
Seasonal Strategies for Maximizing Profit
- Peak Season: Maximize revenue through premium pricing and potentially longer minimum stays. Ensure high availability.
- Low Season: Offer competitive pricing, special promotions (e.g., extended stay discounts), and flexible cancellation policies. Target off-season travelers like remote workers or budget-conscious guests.
- Shoulder Seasons: Implement dynamic pricing that balances peak and low rates. Target weekend travelers or specific events. Offer slightly more flexible terms than peak season.
- Regularly analyze your own performance against these Sheikh Kot seasonality benchmarks and adjust your pricing and availability strategy accordingly.
Best Areas for Airbnb Investment in Sheikh Kot (2026)
Exploring the top neighborhoods for short-term rentals in Sheikh Kot? This section highlights key areas, outlining why they are attractive for hosts and guests, along with notable local attractions. Consider these locations based on your target guest profile and investment strategy.
| Neighborhood / Area | Why Host Here? (Target Guests & Appeal) | Key Attractions & Landmarks |
|---|---|---|
| Murray College Road | A key educational hub in Sheikh Kot, attracting students and parents throughout the year. The area offers a vibrant community feel and access to reputable educational institutions, making it perfect for short-term stays. | Murray College, Sheikh Kot University, Local cafes and restaurants, Parks and recreational areas |
| Adyala Road | A rapidly developing area with several new housing societies and commercial projects. It attracts business travelers and those looking for urban conveniences in a suburban setting. | Commercial centers, Local markets, Parks, Nearby residential amenities |
| Sheikh Kot Bazaar | The bustling heart of the local economy, Sheikh Kot Bazaar offers a cultural experience with local shops, food stalls, and markets. It's popular with visitors looking to immerse themselves in local life. | Shopping stalls, Local food stalls, Cultural events, Community fairs |
| Chak 22 | Known for its scenic views and tranquility, Chak 22 is ideal for nature lovers and those seeking a peaceful retreat away from city life. Attracts families and group travelers looking for a quiet getaway. | Natural scenery, Bird watching, Local farms, Community parks |
| Citi Housing Society | A well-planned community that offers modern amenities and is close to main roads. Attracts both families and professionals. Its upscale setting is great for hosting guests looking for comfort and convenience. | Citi Mall, Parks and playgrounds, Fitness centers, Community events |
| Ravi River View Point | Scenic river views draw in visitors looking for photography spots and relaxation. Perfect for those who want to enjoy nature while being close to urban amenities. | Ravi River, Picnic spots, Walking trails, Fishing opportunities |
| Al-Falah Colony | A growing residential area with a blend of modern facilities and traditional charm. Offers a mix of short-term accommodations for visitors and locals alike. | Community centers, Local parks, Nearby eateries |
| Sadiqabad Road | A strategic location connecting various parts of Sheikh Kot, making it a convenient choice for travelers. The vibrant surroundings enhance the appeal for short-term rentals. | Local shops, Restaurants, Marketplaces, Transportation links |
Understanding Airbnb License Requirements & STR Laws in Sheikh Kot (2026)
While Sheikh Kot, Punjab, Pakistan currently shows low STR regulations, specific Airbnb license requirements might still exist or change. Always verify the latest short term rental regulations and Airbnb license requirements directly with local government authorities for Sheikh Kot to ensure full compliance before hosting.
(Source: AirROI data, 2026, finding no licensed listings among those analyzed)
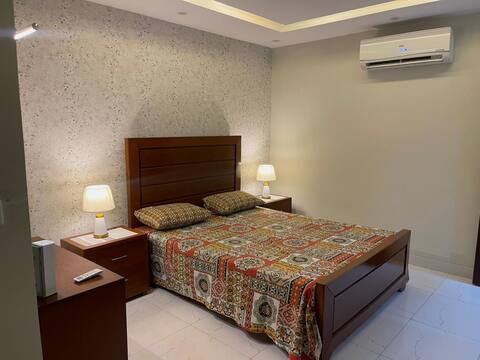
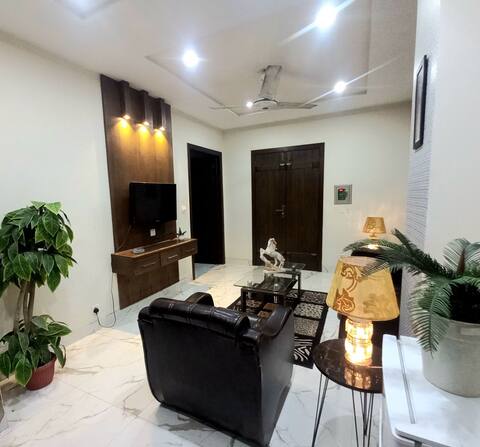
Top Performing Airbnb Properties in Sheikh Kot (2026)
Benchmark your potential! Explore examples of top-performing Airbnb properties in Sheikh Kotbased on Trailing Twelve Month (TTM) revenue. Analyze their characteristics, revenue, occupancy rate, and ADR to understand what drives success in this market.

Top Notch I Elegant Design I Clean I Family Home
Entire Place • 2 bedrooms
1 Bed - CLEAN TIDY - Bahria Town - Family Friendly
Entire Place • 1 bedroom
Beautiful 1 bed apartment bahria
Entire Place • 1 bedroom

Top Notch I Luxury I Modern I Clean I Family Home
Entire Place • 2 bedrooms

Family & Business Friendly: Luxe 1BHK Apartment
Entire Place • 1 bedroom
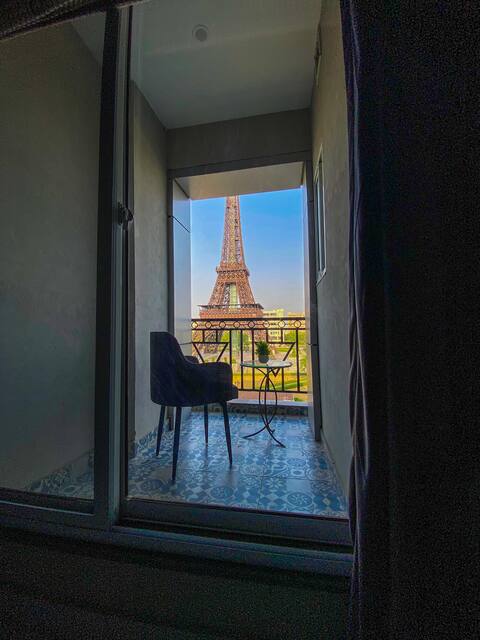
elegant eiffel facing 1BHK apartment
Entire Place • 1 bedroom
Note: Performance varies based on location, size, amenities, seasonality, and management quality. Data reflects the past 12 months.
Top Performing Airbnb Hosts in Sheikh Kot (2026)
Learn from the best! This table showcases top-performing Airbnb hosts in Sheikh Kot based on the number of properties managed and estimated total revenue over the past year. Analyze their scale and performance metrics.
| Host Name | Properties | Grossing Revenue | Stay Reviews | Avg Rating |
|---|---|---|---|---|
| Mohsin | 2 | $7,658 | 101 | 4.91/5.0 |
| Zafar | 4 | $3,597 | 228 | 4.68/5.0 |
| Atif | 6 | $2,718 | 58 | 4.98/5.0 |
| Hassaan | 6 | $2,310 | 191 | 4.83/5.0 |
| Muntaha | 3 | $1,496 | 220 | 4.97/5.0 |
| Hammad | 1 | $1,469 | 23 | 4.65/5.0 |
| Afaq | 1 | $1,276 | 66 | 4.82/5.0 |
| Maha | 2 | $1,241 | 185 | 4.88/5.0 |
| Syed Ahmad | 1 | $1,204 | 51 | 4.90/5.0 |
| Eisha | 1 | $1,186 | 29 | 4.76/5.0 |
Analyzing the strategies of top hosts, such as their property selection, pricing, and guest communication, can offer valuable lessons for optimizing your own Airbnb operations in Sheikh Kot.
Dive Deeper: Advanced Sheikh Kot STR Market Data (2026)
Ready to unlock more insights? AirROI provides access to advanced metrics and comprehensive Airbnb data for Sheikh Kot. Explore detailed analytics beyond this report to refine your investment strategy, optimize pricing, and maximize your vacation rental profits.
Explore Advanced MetricsSheikh Kot Short-Term Rental Market Composition (2026): Property & Room Types
Room Type Distribution
Property Type Distribution
Market Composition Insights for Sheikh Kot
- The Sheikh Kot Airbnb market composition is heavily skewed towards Entire Home/Apt listings, which make up 100% of the 46 active rentals. This indicates strong guest preference for privacy and space.
- Looking at the property type distribution in Sheikh Kot, Apartment/Condo properties are the most common (93.5%), reflecting the local real estate landscape.
Sheikh Kot Airbnb Room Capacity Analysis (2026): Bedroom Distribution
Distribution of Listings by Number of Bedrooms
Room Capacity Insights for Sheikh Kot
- The dominant room capacity in Sheikh Kot is 1 bedroom listings, making up 91.3% of the market. This suggests a strong demand for properties suitable for couples or solo travelers.
- Together, 1 bedroom and 2 bedrooms properties represent 97.8% of the active Airbnb listings in Sheikh Kot, indicating a high concentration in these sizes.
- With over half the market (91.3%) consisting of studios or 1-bedroom units, Sheikh Kot is particularly well-suited for individuals or couples.
Sheikh Kot Vacation Rental Guest Capacity Trends (2026)
Distribution of Listings by Guest Capacity
Guest Capacity Insights for Sheikh Kot
- The most common guest capacity trend in Sheikh Kot vacation rentals is listings accommodating 3 guests (43.5%). This suggests the primary traveler segment is likely small families or groups.
- Properties designed for 3 guests and 2 guests dominate the Sheikh Kot STR market, accounting for 73.9% of listings.
- Listings for large groups (6+ guests) are relatively rare (2.2%), potentially indicating an opportunity for hosts targeting this segment in Sheikh Kot.
- On average, properties in Sheikh Kot are equipped to host 3.0 guests.
Sheikh Kot Airbnb Booking Patterns (2026): Available vs. Booked Days
Available Days Distribution
Booked Days Distribution
Booking Pattern Insights for Sheikh Kot
- The most common availability pattern in Sheikh Kot falls within the 271-366 days range, representing 95.7% of listings. This suggests many properties have significant open periods on their calendars.
- Approximately 97.9% of listings show high availability (181+ days open annually), indicating potential for increased bookings or specific owner usage patterns.
- For booked days, the 1-30 days range is most frequent in Sheikh Kot (65.2%), reflecting common guest stay durations or potential owner blocking patterns.
- A notable 2.2% of properties secure long booking periods (181+ days booked per year), highlighting successful long-term rental strategies or significant owner usage.
Sheikh Kot Airbnb Minimum Stay Requirements Analysis
Distribution of Listings by Minimum Night Requirement
1 Night
44 listings
95.7% of total
3 Nights
1 listings
2.2% of total
30+ Nights
1 listings
2.2% of total
Key Insights
- The most prevalent minimum stay requirement in Sheikh Kot is 1 Night, adopted by 95.7% of listings. This highlights the market's preference for shorter, flexible bookings.
- A strong majority (95.7%) of the Sheikh Kot Airbnb data shows acceptance of very short stays (1-2 nights), indicating a dynamic, high-turnover market.
- Dedicated monthly rentals (30+ nights) represent a small niche (2.2%), possibly an untapped area for hosts.
Recommendations
- Align with the market by considering a 1 Night minimum stay, as 95.7% of Sheikh Kot hosts use this setting.
- Adjust minimum nights based on seasonality – potentially shorter during low season and longer during peak demand periods in Sheikh Kot.
Sheikh Kot Airbnb Cancellation Policy Trends Analysis (2026)
Flexible
33 listings
71.7% of total
Moderate
7 listings
15.2% of total
Firm
6 listings
13% of total
Cancellation Policy Insights for Sheikh Kot
- The prevailing Airbnb cancellation policy trend in Sheikh Kot is Flexible, used by 71.7% of listings.
- The market strongly favors guest-friendly terms, with 86.9% of listings offering Flexible or Moderate policies. This suggests guests in Sheikh Kot may expect booking flexibility.
Recommendations for Hosts
- Consider adopting a Flexible policy to align with the 71.7% market standard in Sheikh Kot.
- Given the high prevalence of Flexible policies (71.7%), offering this can enhance booking appeal, especially during shoulder seasons.
- Regularly review your cancellation policy against competitors and market demand shifts in Sheikh Kot.
Sheikh Kot STR Booking Lead Time Analysis (2026)
Average Booking Lead Time by Month
Booking Lead Time Insights for Sheikh Kot
- The overall average booking lead time for vacation rentals in Sheikh Kot is 4 days.
- Guests book furthest in advance for stays during October (average 23 days), likely coinciding with peak travel demand or local events.
- The shortest booking windows occur for stays in September (average 1 days), indicating more last-minute travel plans during this time.
- Seasonally, Fall (9 days avg.) sees the longest lead times, while Spring (4 days avg.) has the shortest, reflecting typical travel planning cycles.
Recommendations for Hosts
- Use the overall average lead time (4 days) as a baseline for your pricing and availability strategy in Sheikh Kot.
- For October stays, consider implementing length-of-stay discounts or slightly higher rates for bookings made less than 23 days out to capitalize on advance planning.
- Target marketing efforts for the Fall season well in advance (at least 9 days) to capture early planners.
- Monitor your own booking lead times against these Sheikh Kot averages to identify opportunities for dynamic pricing adjustments.
Popular & Essential Airbnb Amenities in Sheikh Kot (2026)
Amenity Prevalence
Amenity Insights for Sheikh Kot
- Essential amenities in Sheikh Kot that guests expect include: TV, Wifi, Air conditioning, Free parking on premises. Lacking these (any) could significantly impact bookings.
- Popular amenities like Kitchen, Heating, Hot water are common but not universal. Offering these can provide a competitive edge.
Recommendations for Hosts
- Ensure your listing includes all essential amenities for Sheikh Kot: TV, Wifi, Air conditioning, Free parking on premises.
- Prioritize adding missing essentials: Wifi, Air conditioning, Free parking on premises.
- Consider adding popular differentiators like Kitchen or Heating to increase appeal.
- Highlight unique or less common amenities you offer (e.g., hot tub, dedicated workspace, EV charger) in your listing description and photos.
- Regularly check competitor amenities in Sheikh Kot to stay competitive.
Sheikh Kot Airbnb Guest Demographics & Profile Analysis (2026)
Guest Profile Summary for Sheikh Kot
- The typical guest profile for Airbnb in Sheikh Kot consists of a mix of domestic (64%) and international guests, often arriving from nearby Lahore, typically belonging to the Post-2000s (Gen Z/Alpha) group (50%), primarily speaking English or Urdu.
- Domestic travelers account for 64.3% of guests.
- Key international markets include Pakistan (64.3%) and United States (11.9%).
- Top languages spoken are English (39.5%) followed by Urdu (30.2%).
- A significant demographic segment is the Post-2000s (Gen Z/Alpha) group, representing 50% of guests.
Recommendations for Hosts
- Target domestic marketing efforts towards travelers from Lahore and Tilburg.
- Tailor amenities and listing descriptions to appeal to the dominant Post-2000s (Gen Z/Alpha) demographic (e.g., highlight fast WiFi, smart home features, local guides).
- Highlight unique local experiences or amenities relevant to the primary guest profile.
- Consider seasonal promotions aligned with peak travel times for key origin markets.
Nearby Short-Term Rental Market Comparison
How does the Sheikh Kot Airbnb market stack up against its neighbors? Compare key performance metrics like average monthly revenue, ADR, and occupancy rates in surrounding areas to understand the broader regional STR landscape.
| Market | Active Properties | Monthly Revenue | Daily Rate | Avg. Occupancy |
|---|---|---|---|---|
| Charr | 18 | $353 | $79.78 | 31% |
| Dalhousie | 58 | $321 | $92.88 | 18% |
| Jhugian Alfa | 17 | $287 | $46.55 | 32% |
| Roranwala | 19 | $277 | $67.63 | 27% |
| Model Town Tehsil | 166 | $259 | $59.08 | 25% |
| Keer | 44 | $256 | $58.90 | 27% |
| Lahore Cantonment Tehsil | 26 | $241 | $54.22 | 25% |
| Lahore | 154 | $215 | $54.55 | 25% |
| Amritsar | 160 | $190 | $48.38 | 21% |
| Lidher | 17 | $189 | $34.52 | 29% |