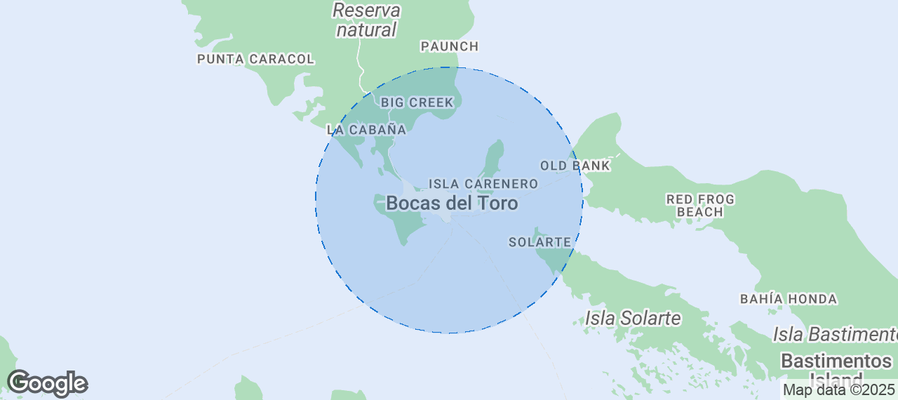
Bocas del Toro Airbnb Market Analysis 2026: Short Term Rental Data & Vacation Rental Statistics in Bocas del Toro, Panama
Is Airbnb profitable in Bocas del Toro in 2026? Explore comprehensive Airbnb analytics for Bocas del Toro, Bocas del Toro, Panama to uncover income potential. This 2026 STR market report for Bocas del Toro, based on AirROI data from February 2025 to January 2026, reveals key trends in the market of 490 active listings.
Whether you're considering an Airbnb investment in Bocas del Toro, optimizing your existing vacation rental, or exploring rental arbitrage opportunities, understanding the Bocas del Toro Airbnb data is crucial. Leveraging the low regulation environment is key to maximizing your short term rental income potential. Let's dive into the specifics.
Key Bocas del Toro Airbnb Performance Metrics Overview
Monthly Airbnb Revenue Variations & Income Potential in Bocas del Toro (2026)
Understanding the monthly revenue variations for Airbnb listings in Bocas del Toro is key to maximizing your short term rental income potential. Seasonality significantly impacts earnings. Our analysis, based on data from the past 12 months, shows that the peak revenue month for STRs in Bocas del Toro is typically February, while September often presents the lowest earnings, highlighting opportunities for strategic pricing adjustments during shoulder and low seasons. Explore the typical Airbnb income in Bocas del Toro across different performance tiers:
- Best-in-class properties (Top 10%) achieve $3,556+ monthly, often utilizing dynamic pricing and superior guest experiences.
- Strong performing properties (Top 25%) earn $2,061 or more, indicating effective management and desirable locations/amenities.
- Typical properties (Median) generate around $1,071 per month, representing the average market performance.
- Entry-level properties (Bottom 25%) see earnings around $497, often with potential for optimization.
Average Monthly Airbnb Earnings Trend in Bocas del Toro
Bocas del Toro Airbnb Occupancy Rate Trends (2026)
Maximize your bookings by understanding the Bocas del Toro STR occupancy trends. Seasonal demand shifts significantly influence how often properties are booked. Typically, Februarysees the highest demand (peak season occupancy), while September experiences the lowest (low season). Effective strategies, like adjusting minimum stays or offering promotions, can boost occupancy during slower periods. Here's how different property tiers perform in Bocas del Toro:
- Best-in-class properties (Top 10%) achieve 71%+ occupancy, indicating high desirability and potentially optimized availability.
- Strong performing properties (Top 25%) maintain 52% or higher occupancy, suggesting good market fit and guest satisfaction.
- Typical properties (Median) have an occupancy rate around 32%.
- Entry-level properties (Bottom 25%) average 16% occupancy, potentially facing higher vacancy.
Average Monthly Occupancy Rate Trend in Bocas del Toro
Average Daily Rate (ADR) Airbnb Trends in Bocas del Toro (2026)
Effective short term rental pricing strategy in Bocas del Toro involves understanding monthly ADR fluctuations. The Average Daily Rate (ADR) for Airbnb in Bocas del Toro typically peaks in January and dips lowest during October. Leveraging Airbnb dynamic pricing tools or strategies based on this seasonality can significantly boost revenue. Here's a look at the typical nightly rates achieved:
- Best-in-class properties (Top 10%) command rates of $276+ per night, often due to premium features or locations.
- Strong performing properties (Top 25%) achieve nightly rates of $160 or more.
- Typical properties (Median) charge around $110 per night.
- Entry-level properties (Bottom 25%) earn around $76 per night.
Average Daily Rate (ADR) Trend by Month in Bocas del Toro
Get Live Bocas del Toro Market Intelligence 👇
Explore Real-time Analytics
Airbnb Seasonality Analysis & Trends in Bocas del Toro (2026)
Peak Season (February, March, April)
- Revenue averages $2,353 per month
- Occupancy rates average 48.7%
- Daily rates average $158
Shoulder Season
- Revenue averages $1,586 per month
- Occupancy maintains around 33.2%
- Daily rates hold near $154
Low Season (June, September, October)
- Revenue drops to average $1,250 per month
- Occupancy decreases to average 27.6%
- Daily rates adjust to average $148
Seasonality Insights for Bocas del Toro
- The Airbnb seasonality in Bocas del Toro shows highly seasonal trends requiring careful strategy. While the sections above show seasonal averages, it's also insightful to look at the extremes:
- During the high season, the absolute peak month showcases Bocas del Toro's highest earning potential, with monthly revenues capable of climbing to $2,641, occupancy reaching a high of 55.8%, and ADRs peaking at $164.
- Conversely, the slowest single month of the year, typically falling within the low season, marks the market's lowest point. In this month, revenue might dip to $1,152, occupancy could drop to 27.0%, and ADRs may adjust down to $146.
- Understanding both the seasonal averages and these monthly peaks and troughs in revenue, occupancy, and ADR is crucial for maximizing your Airbnb profit potential in Bocas del Toro.
Seasonal Strategies for Maximizing Profit
- Peak Season: Maximize revenue through premium pricing and potentially longer minimum stays. Ensure high availability.
- Low Season: Offer competitive pricing, special promotions (e.g., extended stay discounts), and flexible cancellation policies. Target off-season travelers like remote workers or budget-conscious guests.
- Shoulder Seasons: Implement dynamic pricing that balances peak and low rates. Target weekend travelers or specific events. Offer slightly more flexible terms than peak season.
- Regularly analyze your own performance against these Bocas del Toro seasonality benchmarks and adjust your pricing and availability strategy accordingly.
Best Areas for Airbnb Investment in Bocas del Toro (2026)
Exploring the top neighborhoods for short-term rentals in Bocas del Toro? This section highlights key areas, outlining why they are attractive for hosts and guests, along with notable local attractions. Consider these locations based on your target guest profile and investment strategy.
| Neighborhood / Area | Why Host Here? (Target Guests & Appeal) | Key Attractions & Landmarks |
|---|---|---|
| Isla Colón | The main island of Bocas del Toro known for its vibrant culture, beautiful beaches, and nightlife. It's a popular destination for tourists seeking adventure and relaxation. | Bocas Town, Playa Bluff, Playa Estrella, Bocas del Toro Archipelago, Cayo Zapatilla |
| Isla Bastimentos | A quieter island known for its natural beauty and the famous Red Frog Beach. This area attracts visitors looking for eco-tourism and a more laid-back atmosphere. | Red Frog Beach, Bastimentos National Marine Park, Wizard Beach, Old Bank Town, Diving and snorkeling spots |
| Cayo Zapatilla | A stunning pair of islands known for their pristine beaches and clear waters. Perfect for those looking for a tropical paradise and a getaway from the hustle and bustle of life. | Cayo Zapatilla Beach, Snorkeling opportunities, Crystal clear waters, Secluded area, Natural beauty |
| Playa Bluffs | Famous for its scenic beach and surfing spots. This area is great for those looking to enjoy water sports and sunbathing. | Playa Bluff Beach, Surfing opportunities, Local eateries, Sunset views, Wildlife observation |
| Bocas Town | The capital of Bocas del Toro, known for its colorful buildings and laid-back vibe. It's a hub for nightlife, dining, and shopping, making it ideal for young travelers. | Diver's Restaurant, Barco Hundido, Local shops, Nightlife spots, Water taxis |
| Bahía Pochomil | A lesser-known gem offering tranquility and a natural setting. A great choice for visitors who want to escape the crowded tourist spots. | Calm beaches, Coconut palms, Fishing opportunities, Relaxed atmosphere, Local communities |
| Isla Carenero | Just a short boat ride from Bocas Town, this island is a hidden treasure known for its beautiful beaches and relaxed vibe. It appeals to both surfers and beach lovers. | Carenero Beach, Surf breaks, Restaurant options, Tropical scenery, Easy access to Bocas Town |
| Isla Solarte | An eco-friendly destination with lush landscapes and opportunities for snorkeling. Ideal for nature lovers and eco-tourists. | Snorkeling spots, Natural park, Quiet beaches, Local wildlife, Kayaking opportunities |
Understanding Airbnb License Requirements & STR Laws in Bocas del Toro (2026)
While Bocas del Toro, Bocas del Toro, Panama currently shows low STR regulations, specific Airbnb license requirements might still exist or change. Always verify the latest short term rental regulations and Airbnb license requirements directly with local government authorities for Bocas del Toro to ensure full compliance before hosting.
(Source: AirROI data, 2026, finding no licensed listings among those analyzed)
Top Performing Airbnb Properties in Bocas del Toro (2026)
Benchmark your potential! Explore examples of top-performing Airbnb properties in Bocas del Torobased on Trailing Twelve Month (TTM) revenue. Analyze their characteristics, revenue, occupancy rate, and ADR to understand what drives success in this market.
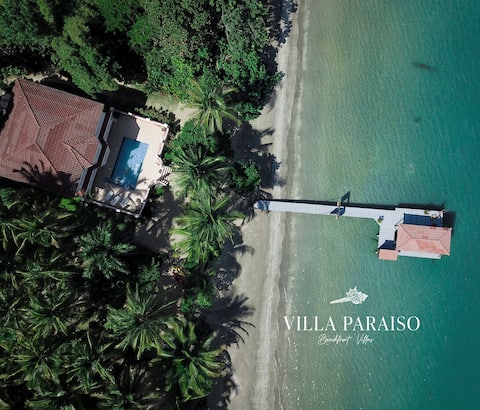
Wiona of Villa Paraiso | Beachfront Villa & Pool
Entire Place • 3 bedrooms
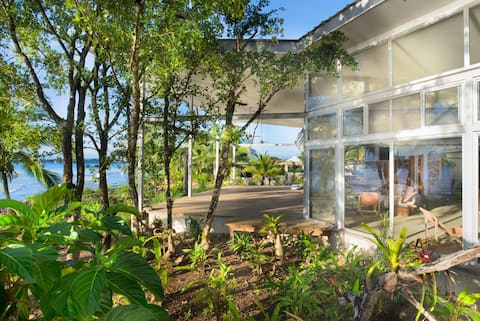
Architectural Waterfront Home - "Casa Comunal"
Entire Place • 5 bedrooms
Rare Luxury Villa & Casitas, Pool, Bocas del Toro.
Entire Place • 4 bedrooms
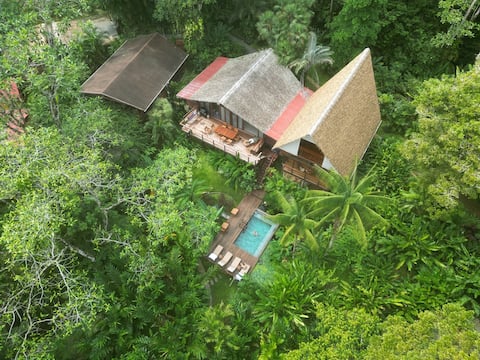
Casa de Mono Jungle Villa Apartment by the Beach
Entire Place • 3 bedrooms
Las Casitas of Villa Paraiso | Beachfront & Pool
Entire Place • 2 bedrooms
#1 Rated Overwater Bungalows in Panama (Papaya)
Entire Place • 1 bedroom
Note: Performance varies based on location, size, amenities, seasonality, and management quality. Data reflects the past 12 months.
Top Performing Airbnb Hosts in Bocas del Toro (2026)
Learn from the best! This table showcases top-performing Airbnb hosts in Bocas del Toro based on the number of properties managed and estimated total revenue over the past year. Analyze their scale and performance metrics.
| Host Name | Properties | Grossing Revenue | Stay Reviews | Avg Rating |
|---|---|---|---|---|
| Connor | 4 | $328,635 | 408 | 4.84/5.0 |
| Cassandra | 5 | $251,650 | 288 | 4.98/5.0 |
| Lola | 3 | $237,798 | 325 | 4.82/5.0 |
| Steve | 7 | $223,660 | 532 | 4.99/5.0 |
| Sterling | 8 | $187,889 | 587 | 4.83/5.0 |
| Ronald | 7 | $155,951 | 23 | 5.00/5.0 |
| Bambuda Bocas Town | 8 | $148,021 | 94 | 4.81/5.0 |
| Ricardo | 6 | $132,002 | 183 | 4.84/5.0 |
| Scott And Debra | 2 | $127,501 | 107 | 4.91/5.0 |
| Drew | 3 | $125,484 | 22 | 5.00/5.0 |
Analyzing the strategies of top hosts, such as their property selection, pricing, and guest communication, can offer valuable lessons for optimizing your own Airbnb operations in Bocas del Toro.
Dive Deeper: Advanced Bocas del Toro STR Market Data (2026)
Ready to unlock more insights? AirROI provides access to advanced metrics and comprehensive Airbnb data for Bocas del Toro. Explore detailed analytics beyond this report to refine your investment strategy, optimize pricing, and maximize your vacation rental profits.
Explore Advanced MetricsBocas del Toro Short-Term Rental Market Composition (2026): Property & Room Types
Room Type Distribution
Property Type Distribution
Market Composition Insights for Bocas del Toro
- The Bocas del Toro Airbnb market composition is heavily skewed towards Entire Home/Apt listings, which make up 62.2% of the 490 active rentals. This indicates strong guest preference for privacy and space.
- However, a notable 35.1% share for Private Rooms suggests opportunities for budget-conscious travelers or hosts renting out spare rooms.
- Looking at the property type distribution in Bocas del Toro, House properties are the most common (33.3%), reflecting the local real estate landscape.
- Houses represent a significant 33.3% portion, catering likely to families or larger groups.
- The presence of 24.5% Hotel/Boutique listings indicates integration with traditional hospitality.
- Smaller segments like others, unique stays (combined 4.0%) offer potential for unique stay experiences.
Bocas del Toro Airbnb Room Capacity Analysis (2026): Bedroom Distribution
Distribution of Listings by Number of Bedrooms
Room Capacity Insights for Bocas del Toro
- The dominant room capacity in Bocas del Toro is 1 bedroom listings, making up 47.1% of the market. This suggests a strong demand for properties suitable for couples or solo travelers.
- Together, 1 bedroom and 2 bedrooms properties represent 65.7% of the active Airbnb listings in Bocas del Toro, indicating a high concentration in these sizes.
Bocas del Toro Vacation Rental Guest Capacity Trends (2026)
Distribution of Listings by Guest Capacity
Guest Capacity Insights for Bocas del Toro
- The most common guest capacity trend in Bocas del Toro vacation rentals is listings accommodating 2 guests (29.2%). This suggests the primary traveler segment is likely couples or solo travelers.
- Properties designed for 2 guests and 4 guests dominate the Bocas del Toro STR market, accounting for 49.6% of listings.
- 15.2% of properties accommodate 6+ guests, serving the market segment for larger families or group travel in Bocas del Toro.
- On average, properties in Bocas del Toro are equipped to host 3.1 guests.
Bocas del Toro Airbnb Booking Patterns (2026): Available vs. Booked Days
Available Days Distribution
Booked Days Distribution
Booking Pattern Insights for Bocas del Toro
- The most common availability pattern in Bocas del Toro falls within the 271-366 days range, representing 60.8% of listings. This suggests many properties have significant open periods on their calendars.
- Approximately 87.9% of listings show high availability (181+ days open annually), indicating potential for increased bookings or specific owner usage patterns.
- For booked days, the 31-90 days range is most frequent in Bocas del Toro (37.1%), reflecting common guest stay durations or potential owner blocking patterns.
- A notable 12.2% of properties secure long booking periods (181+ days booked per year), highlighting successful long-term rental strategies or significant owner usage.
Bocas del Toro Airbnb Minimum Stay Requirements Analysis
Distribution of Listings by Minimum Night Requirement
1 Night
176 listings
35.9% of total
2 Nights
154 listings
31.4% of total
3 Nights
36 listings
7.3% of total
4-6 Nights
2 listings
0.4% of total
7-29 Nights
7 listings
1.4% of total
30+ Nights
115 listings
23.5% of total
Key Insights
- The most prevalent minimum stay requirement in Bocas del Toro is 1 Night, adopted by 35.9% of listings. This highlights the market's preference for shorter, flexible bookings.
- A strong majority (67.3%) of the Bocas del Toro Airbnb data shows acceptance of very short stays (1-2 nights), indicating a dynamic, high-turnover market.
- A significant segment (23.5%) caters to monthly stays (30+ nights) in Bocas del Toro, pointing to opportunities in the extended-stay market.
Recommendations
- Align with the market by considering a 1 Night minimum stay, as 35.9% of Bocas del Toro hosts use this setting.
- Explore offering discounts for stays of 30+ nights to attract the 23.5% of the market seeking extended stays.
- Adjust minimum nights based on seasonality – potentially shorter during low season and longer during peak demand periods in Bocas del Toro.
Bocas del Toro Airbnb Cancellation Policy Trends Analysis (2026)
Super Strict 30 Days
16 listings
3.3% of total
Limited
18 listings
3.7% of total
Super Strict 60 Days
2 listings
0.4% of total
Flexible
89 listings
18.3% of total
Moderate
98 listings
20.2% of total
Firm
195 listings
40.1% of total
Strict
68 listings
14% of total
Cancellation Policy Insights for Bocas del Toro
- The prevailing Airbnb cancellation policy trend in Bocas del Toro is Firm, used by 40.1% of listings.
- A majority (54.1%) of hosts in Bocas del Toro utilize Firm or Strict policies, indicating a market where hosts prioritize booking security.
Recommendations for Hosts
- Consider adopting a Firm policy to align with the 40.1% market standard in Bocas del Toro.
- Using a Strict policy might deter some guests, as only 14% of listings use it. Evaluate if potential revenue protection outweighs possible lower booking rates.
- Regularly review your cancellation policy against competitors and market demand shifts in Bocas del Toro.
Bocas del Toro STR Booking Lead Time Analysis (2026)
Average Booking Lead Time by Month
Booking Lead Time Insights for Bocas del Toro
- The overall average booking lead time for vacation rentals in Bocas del Toro is 57 days.
- Guests book furthest in advance for stays during December (average 79 days), likely coinciding with peak travel demand or local events.
- The shortest booking windows occur for stays in May (average 39 days), indicating more last-minute travel plans during this time.
- Seasonally, Winter (64 days avg.) sees the longest lead times, while Spring (47 days avg.) has the shortest, reflecting typical travel planning cycles.
Recommendations for Hosts
- Use the overall average lead time (57 days) as a baseline for your pricing and availability strategy in Bocas del Toro.
- For December stays, consider implementing length-of-stay discounts or slightly higher rates for bookings made less than 79 days out to capitalize on advance planning.
- Target marketing efforts for the Winter season well in advance (at least 64 days) to capture early planners.
- Monitor your own booking lead times against these Bocas del Toro averages to identify opportunities for dynamic pricing adjustments.
Popular & Essential Airbnb Amenities in Bocas del Toro (2026)
Amenity Prevalence
Amenity Insights for Bocas del Toro
- Essential amenities in Bocas del Toro that guests expect include: Wifi. Lacking these (this) could significantly impact bookings.
- Popular amenities like Kitchen, Hot water, Essentials are common but not universal. Offering these can provide a competitive edge.
Recommendations for Hosts
- Ensure your listing includes all essential amenities for Bocas del Toro: Wifi.
- Prioritize adding missing essentials: Wifi.
- Consider adding popular differentiators like Kitchen or Hot water to increase appeal.
- Highlight unique or less common amenities you offer (e.g., hot tub, dedicated workspace, EV charger) in your listing description and photos.
- Regularly check competitor amenities in Bocas del Toro to stay competitive.
Bocas del Toro Airbnb Guest Demographics & Profile Analysis (2026)
Guest Profile Summary for Bocas del Toro
- The typical guest profile for Airbnb in Bocas del Toro consists of predominantly international visitors (96%), with top international origins including Canada, typically belonging to the Post-2000s (Gen Z/Alpha) group (50%), primarily speaking English or Spanish.
- Domestic travelers account for 4.0% of guests.
- Key international markets include United States (36%) and Canada (9.9%).
- Top languages spoken are English (43.3%) followed by Spanish (24.4%).
- A significant demographic segment is the Post-2000s (Gen Z/Alpha) group, representing 50% of guests.
Recommendations for Hosts
- Focus marketing internationally, particularly towards travelers from Canada.
- Tailor amenities and listing descriptions to appeal to the dominant Post-2000s (Gen Z/Alpha) demographic (e.g., highlight fast WiFi, smart home features, local guides).
- Highlight unique local experiences or amenities relevant to the primary guest profile.
- Consider seasonal promotions aligned with peak travel times for key origin markets.
Nearby Short-Term Rental Market Comparison
How does the Bocas del Toro Airbnb market stack up against its neighbors? Compare key performance metrics like average monthly revenue, ADR, and occupancy rates in surrounding areas to understand the broader regional STR landscape.
| Market | Active Properties | Monthly Revenue | Daily Rate | Avg. Occupancy |
|---|---|---|---|---|
| Osa | 10 | $3,418 | $586.45 | 32% |
| Savegre de Aguirre | 15 | $2,740 | $372.47 | 36% |
| Savegre | 186 | $2,150 | $256.31 | 34% |
| Bahía Ballena | 1,282 | $2,099 | $237.59 | 37% |
| Cahuita | 2,053 | $1,396 | $147.36 | 37% |
| Potrero Cerrado | 10 | $1,208 | $128.50 | 26% |
| Bastimentos | 103 | $1,125 | $193.27 | 29% |
| Boca Chica | 29 | $1,106 | $217.98 | 29% |
| Puerto Cortés | 241 | $1,084 | $160.97 | 33% |
| Puerto Viejo de Talamanca | 64 | $1,077 | $129.46 | 38% |