Hernandarias Airbnb Market Analysis 2026: Short Term Rental Data & Vacation Rental Statistics in Región Oriental, Paraguay
Is Airbnb profitable in Hernandarias in 2026? Explore comprehensive Airbnb analytics for Hernandarias, Región Oriental, Paraguay to uncover income potential. This 2026 STR market report for Hernandarias, based on AirROI data from October 2024 to September 2025, reveals key trends in the niche market of 19 active listings.
Whether you're considering an Airbnb investment in Hernandarias, optimizing your existing vacation rental, or exploring rental arbitrage opportunities, understanding the Hernandarias Airbnb data is crucial. Leveraging the low regulation environment is key to maximizing your short term rental income potential. Let's dive into the specifics.
Key Hernandarias Airbnb Performance Metrics Overview
Monthly Airbnb Revenue Variations & Income Potential in Hernandarias (2026)
Understanding the monthly revenue variations for Airbnb listings in Hernandarias is key to maximizing your short term rental income potential. Seasonality significantly impacts earnings. Our analysis, based on data from the past 12 months, shows that the peak revenue month for STRs in Hernandarias is typically August, while September often presents the lowest earnings, highlighting opportunities for strategic pricing adjustments during shoulder and low seasons. Explore the typical Airbnb income in Hernandarias across different performance tiers:
- Best-in-class properties (Top 10%) achieve $1,464+ monthly, often utilizing dynamic pricing and superior guest experiences.
- Strong performing properties (Top 25%) earn $891 or more, indicating effective management and desirable locations/amenities.
- Typical properties (Median) generate around $410 per month, representing the average market performance.
- Entry-level properties (Bottom 25%) see earnings around $230, often with potential for optimization.
Average Monthly Airbnb Earnings Trend in Hernandarias
Hernandarias Airbnb Occupancy Rate Trends (2026)
Maximize your bookings by understanding the Hernandarias STR occupancy trends. Seasonal demand shifts significantly influence how often properties are booked. Typically, Augustsees the highest demand (peak season occupancy), while September experiences the lowest (low season). Effective strategies, like adjusting minimum stays or offering promotions, can boost occupancy during slower periods. Here's how different property tiers perform in Hernandarias:
- Best-in-class properties (Top 10%) achieve 80%+ occupancy, indicating high desirability and potentially optimized availability.
- Strong performing properties (Top 25%) maintain 45% or higher occupancy, suggesting good market fit and guest satisfaction.
- Typical properties (Median) have an occupancy rate around 22%.
- Entry-level properties (Bottom 25%) average 13% occupancy, potentially facing higher vacancy.
Average Monthly Occupancy Rate Trend in Hernandarias
Average Daily Rate (ADR) Airbnb Trends in Hernandarias (2026)
Effective short term rental pricing strategy in Hernandarias involves understanding monthly ADR fluctuations. The Average Daily Rate (ADR) for Airbnb in Hernandarias typically peaks in July and dips lowest during November. Leveraging Airbnb dynamic pricing tools or strategies based on this seasonality can significantly boost revenue. Here's a look at the typical nightly rates achieved:
- Best-in-class properties (Top 10%) command rates of $105+ per night, often due to premium features or locations.
- Strong performing properties (Top 25%) achieve nightly rates of $71 or more.
- Typical properties (Median) charge around $61 per night.
- Entry-level properties (Bottom 25%) earn around $42 per night.
Average Daily Rate (ADR) Trend by Month in Hernandarias
Get Live Hernandarias Market Intelligence 👇

Explore Real-time Analytics
Airbnb Seasonality Analysis & Trends in Hernandarias (2025)
Peak Season (August, January, October)
- Revenue averages $909 per month
- Occupancy rates average 44.5%
- Daily rates average $63
Shoulder Season
- Revenue averages $629 per month
- Occupancy maintains around 35.4%
- Daily rates hold near $62
Low Season (April, June, September)
- Revenue drops to average $461 per month
- Occupancy decreases to average 25.7%
- Daily rates adjust to average $64
Seasonality Insights for Hernandarias
- The Airbnb seasonality in Hernandarias shows highly seasonal trends requiring careful strategy. While the sections above show seasonal averages, it's also insightful to look at the extremes:
- During the high season, the absolute peak month showcases Hernandarias's highest earning potential, with monthly revenues capable of climbing to $983, occupancy reaching a high of 51.6%, and ADRs peaking at $67.
- Conversely, the slowest single month of the year, typically falling within the low season, marks the market's lowest point. In this month, revenue might dip to $397, occupancy could drop to 20.0%, and ADRs may adjust down to $60.
- Understanding both the seasonal averages and these monthly peaks and troughs in revenue, occupancy, and ADR is crucial for maximizing your Airbnb profit potential in Hernandarias.
Seasonal Strategies for Maximizing Profit
- Peak Season: Maximize revenue through premium pricing and potentially longer minimum stays. Ensure high availability.
- Low Season: Offer competitive pricing, special promotions (e.g., extended stay discounts), and flexible cancellation policies. Target off-season travelers like remote workers or budget-conscious guests.
- Shoulder Seasons: Implement dynamic pricing that balances peak and low rates. Target weekend travelers or specific events. Offer slightly more flexible terms than peak season.
- Regularly analyze your own performance against these Hernandarias seasonality benchmarks and adjust your pricing and availability strategy accordingly.
Best Areas for Airbnb Investment in Hernandarias (2026)
Exploring the top neighborhoods for short-term rentals in Hernandarias? This section highlights key areas, outlining why they are attractive for hosts and guests, along with notable local attractions. Consider these locations based on your target guest profile and investment strategy.
| Neighborhood / Area | Why Host Here? (Target Guests & Appeal) | Key Attractions & Landmarks |
|---|---|---|
| Centro | The heart of Hernandarias, offering easy access to local markets, shops, and cultural sites. Ideal for tourists looking to experience daily life in Paraguay while being near essential amenities. | Municipal Market, Casa de la Cultura, Sculpture Park, Local dining options, Civic Center |
| Costanera | A popular waterfront area along the Paraná River, great for relaxation and leisure activities. Attractive to visitors seeking scenic views and outdoor experiences. | Riverside promenade, Fishing spots, Parks and green spaces, Playgrounds, Water sports activities |
| Zona Norte | A residential and business area with a mix of local and modern attractions, catering to both long-term stays and short tourist visits. | Shopping centers, Restaurants, Local cafés, Transportation links, Cultural festivals |
| Hacienda | A quiet and picturesque area known for its natural beauty and recreational opportunities, appealing to nature lovers and families. | Nature trails, Lakeside activities, Picnic areas, Wildlife observation, Hiking spots |
| Barrio Villa Morra | An upscale neighborhood known for its spacious homes and green areas, attracting families and those looking for a serene stay. | Parks, Local boutiques, Fine dining, Cultural centers, Exhibition spaces |
| Parque Ñu Guasu | A large urban park providing a range of outdoor activities, appealing to visitors looking for active and nature-filled experiences. | Jogging paths, Cycling tracks, Playground, Sport facilities, Environmental education programs |
| Limite con Ciudad del Este | This border area allows guests to explore both Hernandarias and the vibrant shopping scene of Ciudad del Este, popular among tourists. | Shopping malls, Duty-free shops, Cataratas del Monday, International cuisine, Cultural exchange experiences |
| Cerro Porteño | This neighborhood offers traditional Paraguayan lifestyle experiences while being close to various entertainment options, ideal for those wanting a local feel. | Local markets, Community events, Traditional restaurants, Historical sites, Cultural activities |
Understanding Airbnb License Requirements & STR Laws in Hernandarias (2026)
While Hernandarias, Región Oriental, Paraguay currently shows low STR regulations, specific Airbnb license requirements might still exist or change. Always verify the latest short term rental regulations and Airbnb license requirements directly with local government authorities for Hernandarias to ensure full compliance before hosting.
(Source: AirROI data, 2026, based on 5% licensed listings)
Top Performing Airbnb Properties in Hernandarias (2026)
Benchmark your potential! Explore examples of top-performing Airbnb properties in Hernandariasbased on Trailing Twelve Month (TTM) revenue. Analyze their characteristics, revenue, occupancy rate, and ADR to understand what drives success in this market.

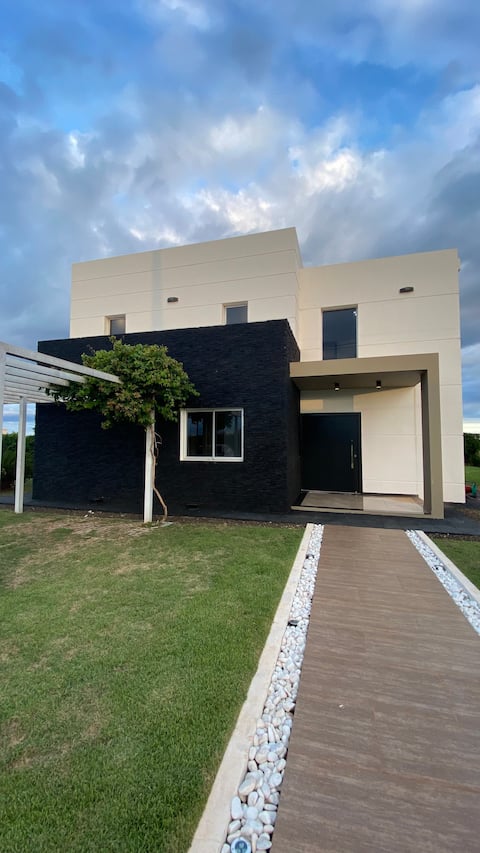
CCP Zone Dept.
Entire Place • 2 bedrooms

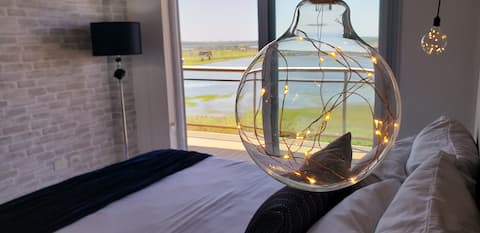
Cozy apartment with a private beach. Total tranquility
Entire Place • 2 bedrooms
La Serena Condominium Costa del Lago.
Entire Place • 4 bedrooms
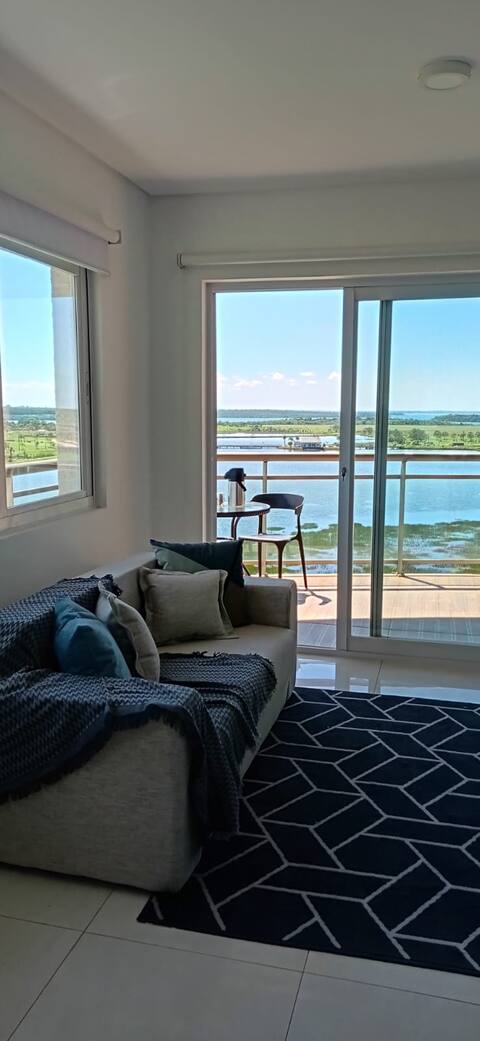
2 Bedroom Apartment with Lake View, Relaxation and Nature
Entire Place • 2 bedrooms
601. Beautiful Apt in Condominio Costa del Lago.
Entire Place • 2 bedrooms

La chuchi
Private Room • 1 bedroom
Note: Performance varies based on location, size, amenities, seasonality, and management quality. Data reflects the past 12 months.
Top Performing Airbnb Hosts in Hernandarias (2026)
Learn from the best! This table showcases top-performing Airbnb hosts in Hernandarias based on the number of properties managed and estimated total revenue over the past year. Analyze their scale and performance metrics.
| Host Name | Properties | Grossing Revenue | Stay Reviews | Avg Rating |
|---|---|---|---|---|
| Rodolfo | 2 | $17,211 | 80 | 4.91/5.0 |
| Cindy Bianca | 1 | $12,316 | 38 | 4.87/5.0 |
| Hugo | 1 | $8,016 | 5 | 5.00/5.0 |
| Rodrigo Andres | 5 | $2,993 | 17 | 4.79/5.0 |
| Maria Ines | 2 | $2,129 | 36 | 5.00/5.0 |
| La Wayaba | 2 | $1,345 | 3 | Not Rated |
| Lilian | 1 | $761 | 5 | 4.80/5.0 |
| Martin | 1 | $658 | 1 | Not Rated |
| Bia | 1 | $472 | 9 | 5.00/5.0 |
| Host #238904467 | 1 | $234 | 0 | Not Rated |
Analyzing the strategies of top hosts, such as their property selection, pricing, and guest communication, can offer valuable lessons for optimizing your own Airbnb operations in Hernandarias.
Dive Deeper: Advanced Hernandarias STR Market Data (2026)
Ready to unlock more insights? AirROI provides access to advanced metrics and comprehensive Airbnb data for Hernandarias. Explore detailed analytics beyond this report to refine your investment strategy, optimize pricing, and maximize your vacation rental profits.
Explore Advanced MetricsHernandarias Short-Term Rental Market Composition (2026): Property & Room Types
Room Type Distribution
Property Type Distribution
Market Composition Insights for Hernandarias
- The Hernandarias Airbnb market composition is heavily skewed towards Private Room listings, which make up 52.6% of the 19 active rentals. This indicates strong guest preference for privacy and space.
- Looking at the property type distribution in Hernandarias, Apartment/Condo properties are the most common (52.6%), reflecting the local real estate landscape.
- Houses represent a significant 21.1% portion, catering likely to families or larger groups.
- The presence of 15.8% Hotel/Boutique listings indicates integration with traditional hospitality.
Hernandarias Airbnb Room Capacity Analysis (2026): Bedroom Distribution
Distribution of Listings by Number of Bedrooms
Room Capacity Insights for Hernandarias
- The dominant room capacity in Hernandarias is 1 bedroom listings, making up 47.4% of the market. This suggests a strong demand for properties suitable for couples or solo travelers.
- Together, 1 bedroom and 2 bedrooms properties represent 79.0% of the active Airbnb listings in Hernandarias, indicating a high concentration in these sizes.
- Listings with 3+ bedrooms (5.3%) represent a smaller niche, potentially indicating an underserved market for larger group accommodations in Hernandarias.
Hernandarias Vacation Rental Guest Capacity Trends (2026)
Distribution of Listings by Guest Capacity
Guest Capacity Insights for Hernandarias
- The most common guest capacity trend in Hernandarias vacation rentals is listings accommodating 2 guests (26.3%). This suggests the primary traveler segment is likely couples or solo travelers.
- Properties designed for 2 guests and 5 guests dominate the Hernandarias STR market, accounting for 47.4% of listings.
- 10.6% of properties accommodate 6+ guests, serving the market segment for larger families or group travel in Hernandarias.
- On average, properties in Hernandarias are equipped to host 3.3 guests.
Hernandarias Airbnb Booking Patterns (2026): Available vs. Booked Days
Available Days Distribution
Booked Days Distribution
Booking Pattern Insights for Hernandarias
- The most common availability pattern in Hernandarias falls within the 271-366 days range, representing 78.9% of listings. This suggests many properties have significant open periods on their calendars.
- Approximately 94.7% of listings show high availability (181+ days open annually), indicating potential for increased bookings or specific owner usage patterns.
- For booked days, the 1-30 days range is most frequent in Hernandarias (78.9%), reflecting common guest stay durations or potential owner blocking patterns.
- A notable 5.3% of properties secure long booking periods (181+ days booked per year), highlighting successful long-term rental strategies or significant owner usage.
Hernandarias Airbnb Minimum Stay Requirements Analysis
Distribution of Listings by Minimum Night Requirement
1 Night
16 listings
84.2% of total
2 Nights
1 listings
5.3% of total
30+ Nights
2 listings
10.5% of total
Key Insights
- The most prevalent minimum stay requirement in Hernandarias is 1 Night, adopted by 84.2% of listings. This highlights the market's preference for shorter, flexible bookings.
- A strong majority (89.5%) of the Hernandarias Airbnb data shows acceptance of very short stays (1-2 nights), indicating a dynamic, high-turnover market.
- A significant segment (10.5%) caters to monthly stays (30+ nights) in Hernandarias, pointing to opportunities in the extended-stay market.
Recommendations
- Align with the market by considering a 1 Night minimum stay, as 84.2% of Hernandarias hosts use this setting.
- Explore offering discounts for stays of 30+ nights to attract the 10.5% of the market seeking extended stays.
- Adjust minimum nights based on seasonality – potentially shorter during low season and longer during peak demand periods in Hernandarias.
Hernandarias Airbnb Cancellation Policy Trends Analysis (2026)
Flexible
14 listings
73.7% of total
Moderate
3 listings
15.8% of total
Firm
1 listings
5.3% of total
Strict
1 listings
5.3% of total
Cancellation Policy Insights for Hernandarias
- The prevailing Airbnb cancellation policy trend in Hernandarias is Flexible, used by 73.7% of listings.
- The market strongly favors guest-friendly terms, with 89.5% of listings offering Flexible or Moderate policies. This suggests guests in Hernandarias may expect booking flexibility.
- Strict cancellation policies are quite rare (5.3%), potentially making listings with this policy less competitive unless justified by high demand or property type.
Recommendations for Hosts
- Consider adopting a Flexible policy to align with the 73.7% market standard in Hernandarias.
- Given the high prevalence of Flexible policies (73.7%), offering this can enhance booking appeal, especially during shoulder seasons.
- Using a Strict policy might deter some guests, as only 5.3% of listings use it. Evaluate if potential revenue protection outweighs possible lower booking rates.
- Regularly review your cancellation policy against competitors and market demand shifts in Hernandarias.
Hernandarias STR Booking Lead Time Analysis (2026)
Average Booking Lead Time by Month
Booking Lead Time Insights for Hernandarias
- The overall average booking lead time for vacation rentals in Hernandarias is 15 days.
- Guests book furthest in advance for stays during December (average 48 days), likely coinciding with peak travel demand or local events.
- The shortest booking windows occur for stays in February (average 8 days), indicating more last-minute travel plans during this time.
- Seasonally, Winter (24 days avg.) sees the longest lead times, while Spring (14 days avg.) has the shortest, reflecting typical travel planning cycles.
Recommendations for Hosts
- Use the overall average lead time (15 days) as a baseline for your pricing and availability strategy in Hernandarias.
- For December stays, consider implementing length-of-stay discounts or slightly higher rates for bookings made less than 48 days out to capitalize on advance planning.
- Target marketing efforts for the Winter season well in advance (at least 24 days) to capture early planners.
- Monitor your own booking lead times against these Hernandarias averages to identify opportunities for dynamic pricing adjustments.
Popular & Essential Airbnb Amenities in Hernandarias (2026)
Amenity Prevalence
Amenity Insights for Hernandarias
- Essential amenities in Hernandarias that guests expect include: Air conditioning. Lacking these (this) could significantly impact bookings.
- Popular amenities like Wifi, Free parking on premises, Hot water are common but not universal. Offering these can provide a competitive edge.
- Warning: Wifi is not universally provided but is considered essential globally. Ensure reliable Wifi is offered.
Recommendations for Hosts
- Ensure your listing includes all essential amenities for Hernandarias: Air conditioning.
- Consider adding popular differentiators like Wifi or Free parking on premises to increase appeal.
- Highlight unique or less common amenities you offer (e.g., hot tub, dedicated workspace, EV charger) in your listing description and photos.
- Regularly check competitor amenities in Hernandarias to stay competitive.
Hernandarias Airbnb Guest Demographics & Profile Analysis (2026)
Guest Profile Summary for Hernandarias
- The typical guest profile for Airbnb in Hernandarias consists of a mix of domestic (38%) and international guests, with top international origins including Brazil, typically belonging to the Post-2000s (Gen Z/Alpha) group (50%), primarily speaking Spanish or English.
- Domestic travelers account for 38.0% of guests.
- Key international markets include Paraguay (38%) and Brazil (34%).
- Top languages spoken are Spanish (37.3%) followed by English (26.7%).
- A significant demographic segment is the Post-2000s (Gen Z/Alpha) group, representing 50% of guests.
Recommendations for Hosts
- Focus marketing internationally, particularly towards travelers from Brazil.
- Offer listing details and communication support in Spanish.
- Tailor amenities and listing descriptions to appeal to the dominant Post-2000s (Gen Z/Alpha) demographic (e.g., highlight fast WiFi, smart home features, local guides).
- Highlight unique local experiences or amenities relevant to the primary guest profile.
- Consider seasonal promotions aligned with peak travel times for key origin markets.
Nearby Short-Term Rental Market Comparison
How does the Hernandarias Airbnb market stack up against its neighbors? Compare key performance metrics like average monthly revenue, ADR, and occupancy rates in surrounding areas to understand the broader regional STR landscape.
| Market | Active Properties | Monthly Revenue | Daily Rate | Avg. Occupancy |
|---|---|---|---|---|
| Municipio de Puerto Libertad | 12 | $563 | $113.10 | 29% |
| Santa Terezinha de Itaipu | 27 | $547 | $126.31 | 21% |
| Palotina | 11 | $501 | $51.40 | 32% |
| Puerto Iguazú | 651 | $494 | $56.32 | 39% |
| Foz do Iguaçu | 2,125 | $484 | $54.67 | 40% |
| Medianeira | 12 | $404 | $50.12 | 34% |
| Dois Vizinhos | 10 | $373 | $32.76 | 40% |
| Ciudad del Este | 162 | $368 | $47.93 | 36% |
| Cascavel | 405 | $314 | $64.59 | 33% |
| Presidente Franco | 11 | $300 | $87.19 | 26% |