Calaca Airbnb Market Analysis 2026: Short Term Rental Data & Vacation Rental Statistics in Batangas, Philippines
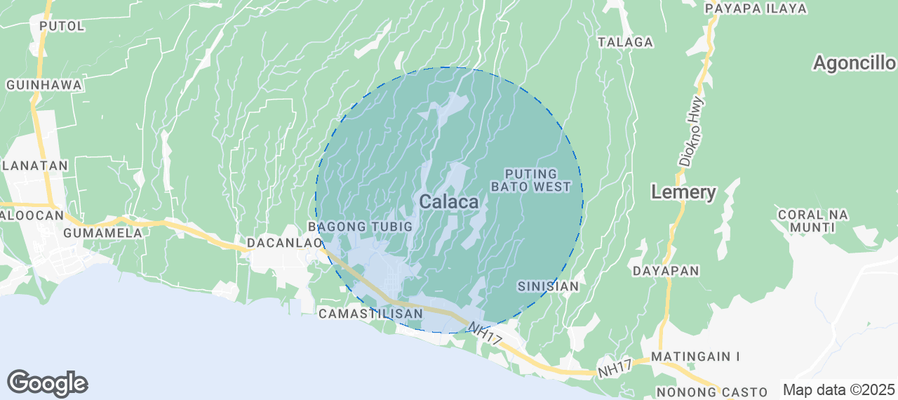
Is Airbnb profitable in Calaca in 2026? Explore comprehensive Airbnb analytics for Calaca, Batangas, Philippines to uncover income potential. This 2026 STR market report for Calaca, based on AirROI data from February 2025 to January 2026, reveals key trends in the niche market of 41 active listings.
Whether you're considering an Airbnb investment in Calaca, optimizing your existing vacation rental, or exploring rental arbitrage opportunities, understanding the Calaca Airbnb data is crucial. Leveraging the low regulation environment is key to maximizing your short term rental income potential. Let's dive into the specifics.
Key Calaca Airbnb Performance Metrics Overview
Monthly Airbnb Revenue Variations & Income Potential in Calaca (2026)
Understanding the monthly revenue variations for Airbnb listings in Calaca is key to maximizing your short term rental income potential. Seasonality significantly impacts earnings. Our analysis, based on data from the past 12 months, shows that the peak revenue month for STRs in Calaca is typically December, while September often presents the lowest earnings, highlighting opportunities for strategic pricing adjustments during shoulder and low seasons. Explore the typical Airbnb income in Calaca across different performance tiers:
- Best-in-class properties (Top 10%) achieve $3,078+ monthly, often utilizing dynamic pricing and superior guest experiences.
- Strong performing properties (Top 25%) earn $1,898 or more, indicating effective management and desirable locations/amenities.
- Typical properties (Median) generate around $934 per month, representing the average market performance.
- Entry-level properties (Bottom 25%) see earnings around $363, often with potential for optimization.
Average Monthly Airbnb Earnings Trend in Calaca
Calaca Airbnb Occupancy Rate Trends (2026)
Maximize your bookings by understanding the Calaca STR occupancy trends. Seasonal demand shifts significantly influence how often properties are booked. Typically, Decembersees the highest demand (peak season occupancy), while July experiences the lowest (low season). Effective strategies, like adjusting minimum stays or offering promotions, can boost occupancy during slower periods. Here's how different property tiers perform in Calaca:
- Best-in-class properties (Top 10%) achieve 45%+ occupancy, indicating high desirability and potentially optimized availability.
- Strong performing properties (Top 25%) maintain 30% or higher occupancy, suggesting good market fit and guest satisfaction.
- Typical properties (Median) have an occupancy rate around 19%.
- Entry-level properties (Bottom 25%) average 11% occupancy, potentially facing higher vacancy.
Average Monthly Occupancy Rate Trend in Calaca
Average Daily Rate (ADR) Airbnb Trends in Calaca (2026)
Effective short term rental pricing strategy in Calaca involves understanding monthly ADR fluctuations. The Average Daily Rate (ADR) for Airbnb in Calaca typically peaks in July and dips lowest during January. Leveraging Airbnb dynamic pricing tools or strategies based on this seasonality can significantly boost revenue. Here's a look at the typical nightly rates achieved:
- Best-in-class properties (Top 10%) command rates of $324+ per night, often due to premium features or locations.
- Strong performing properties (Top 25%) achieve nightly rates of $255 or more.
- Typical properties (Median) charge around $158 per night.
- Entry-level properties (Bottom 25%) earn around $76 per night.
Average Daily Rate (ADR) Trend by Month in Calaca
Get Live Calaca Market Intelligence 👇
Explore Real-time Analytics
Airbnb Seasonality Analysis & Trends in Calaca (2026)
Peak Season (December, May, April)
- Revenue averages $1,607 per month
- Occupancy rates average 25.1%
- Daily rates average $176
Shoulder Season
- Revenue averages $1,352 per month
- Occupancy maintains around 21.6%
- Daily rates hold near $176
Low Season (September, October, November)
- Revenue drops to average $1,066 per month
- Occupancy decreases to average 21.2%
- Daily rates adjust to average $172
Seasonality Insights for Calaca
- The Airbnb seasonality in Calaca shows highly seasonal trends requiring careful strategy. While the sections above show seasonal averages, it's also insightful to look at the extremes:
- During the high season, the absolute peak month showcases Calaca's highest earning potential, with monthly revenues capable of climbing to $1,980, occupancy reaching a high of 30.2%, and ADRs peaking at $182.
- Conversely, the slowest single month of the year, typically falling within the low season, marks the market's lowest point. In this month, revenue might dip to $984, occupancy could drop to 19.4%, and ADRs may adjust down to $170.
- Understanding both the seasonal averages and these monthly peaks and troughs in revenue, occupancy, and ADR is crucial for maximizing your Airbnb profit potential in Calaca.
Seasonal Strategies for Maximizing Profit
- Peak Season: Maximize revenue through premium pricing and potentially longer minimum stays. Ensure high availability.
- Low Season: Offer competitive pricing, special promotions (e.g., extended stay discounts), and flexible cancellation policies. Target off-season travelers like remote workers or budget-conscious guests.
- Shoulder Seasons: Implement dynamic pricing that balances peak and low rates. Target weekend travelers or specific events. Offer slightly more flexible terms than peak season.
- Regularly analyze your own performance against these Calaca seasonality benchmarks and adjust your pricing and availability strategy accordingly.
Best Areas for Airbnb Investment in Calaca (2026)
Exploring the top neighborhoods for short-term rentals in Calaca? This section highlights key areas, outlining why they are attractive for hosts and guests, along with notable local attractions. Consider these locations based on your target guest profile and investment strategy.
| Neighborhood / Area | Why Host Here? (Target Guests & Appeal) | Key Attractions & Landmarks |
|---|---|---|
| Calaca Beach | Beautiful coastal area with stunning beaches, ideal for tourists wanting relaxation and water activities. Great spot for beach lovers and family vacations. | Calaca Beach, Malbrugo Island, Buhay na Tubig Beach |
| Mount Batulao | Popular trekking destination for adventure seekers and nature enthusiasts. Perfect for those looking to escape the city and enjoy hiking and the outdoors. | Mount Batulao, Trekking and camping facilities, Scenic viewpoints |
| Calaca Heritage Park | A cultural and historical site that attracts visitors interested in local history and tradition. Ideal for tourists who appreciate heritage and local culture. | Historic monuments, Cultural festivals, Guided heritage tours |
| Cape Santiago Lighthouse | Historical landmark that offers beautiful coastal views and insights into local maritime history. Attractive for tourists interested in exploration and photography. | Cape Santiago Lighthouse, Coastal views, Birdwatching opportunities |
| Balay Ni Mayang | Iconic local restaurant famous for traditional Batangas cuisine, attracting food tourists and locals alike. Great for travelers looking to try local delicacies. | Batangas culinary tours, Local ambiance, Cultural dining experiences |
| Calaca Town Center | The bustling heart of Calaca, ideal for travelers wanting local shopping and dining experiences. Engaging for tourists looking to immerse in daily Filipino life. | Local markets, Shopping centers, Food stalls |
| San Juan | Adjacent area known for its surfing spots and vibrant beach scene. Attracts younger crowds and surf enthusiasts looking for adventure. | La Luz Beach Resort, Surfing spots, Beach parties |
| Taal Volcano | One of the most famous tourist attractions in the Philippines, attracting visitors for its unique geological features and stunning scenery. | Taal Volcano, Lake Taal, Scenic boat rides |
Understanding Airbnb License Requirements & STR Laws in Calaca (2026)
While Calaca, Batangas, Philippines currently shows low STR regulations, specific Airbnb license requirements might still exist or change. Always verify the latest short term rental regulations and Airbnb license requirements directly with local government authorities for Calaca to ensure full compliance before hosting.
(Source: AirROI data, 2026, finding no licensed listings among those analyzed)
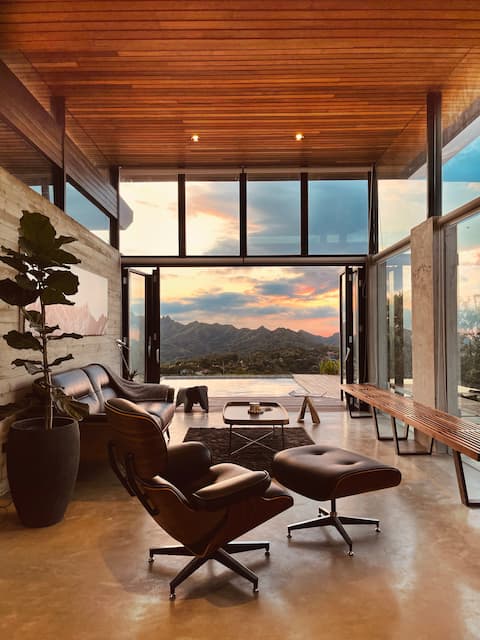
Top Performing Airbnb Properties in Calaca (2026)
Benchmark your potential! Explore examples of top-performing Airbnb properties in Calacabased on Trailing Twelve Month (TTM) revenue. Analyze their characteristics, revenue, occupancy rate, and ADR to understand what drives success in this market.
Cabin 1 - Mountainside luxury cabin w Batulao view
Entire Place • 2 bedrooms
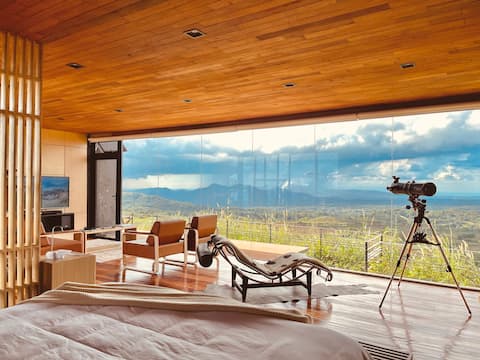
Cabin 2-Modern Cabin w/Tempur bed & stunning view
Entire Place • 1 bedroom
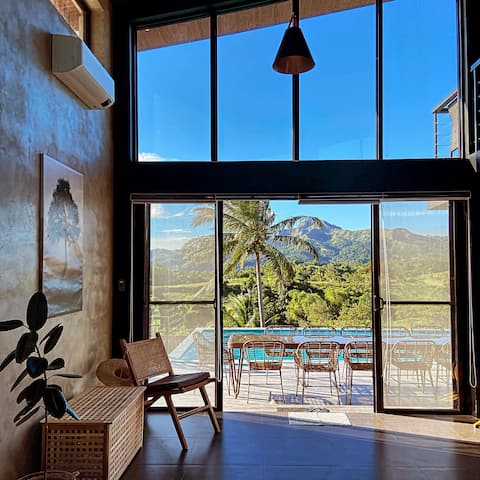
Stylish Getaway | Private Pool & Mountain Views
Entire Place • 3 bedrooms

Cedar Home Tagaytay | Poolside Stay + Taal View
Entire Place • 3 bedrooms
unbothered.
Entire Place • 1 bedroom
The Tudor Tagaytay at Canyon Woods
Entire Place • 3 bedrooms
Note: Performance varies based on location, size, amenities, seasonality, and management quality. Data reflects the past 12 months.
Top Performing Airbnb Hosts in Calaca (2026)
Learn from the best! This table showcases top-performing Airbnb hosts in Calaca based on the number of properties managed and estimated total revenue over the past year. Analyze their scale and performance metrics.
| Host Name | Properties | Grossing Revenue | Stay Reviews | Avg Rating |
|---|---|---|---|---|
| Camper And Cabin | 3 | $107,692 | 917 | 4.84/5.0 |
| Raymond | 1 | $27,914 | 40 | 4.98/5.0 |
| Reginald | 1 | $24,587 | 142 | 4.96/5.0 |
| Chezka | 1 | $24,032 | 110 | 4.93/5.0 |
| Daniella | 1 | $21,706 | 6 | 4.00/5.0 |
| Christine | 5 | $21,608 | 145 | 4.83/5.0 |
| Samuelle | 1 | $19,749 | 47 | 4.91/5.0 |
| Carlos | 1 | $19,144 | 27 | 4.85/5.0 |
| Z | 1 | $18,842 | 3 | 4.67/5.0 |
| Denison | 1 | $18,160 | 80 | 4.88/5.0 |
Analyzing the strategies of top hosts, such as their property selection, pricing, and guest communication, can offer valuable lessons for optimizing your own Airbnb operations in Calaca.
Dive Deeper: Advanced Calaca STR Market Data (2026)
Ready to unlock more insights? AirROI provides access to advanced metrics and comprehensive Airbnb data for Calaca. Explore detailed analytics beyond this report to refine your investment strategy, optimize pricing, and maximize your vacation rental profits.
Explore Advanced MetricsCalaca Short-Term Rental Market Composition (2026): Property & Room Types
Room Type Distribution
Property Type Distribution
Market Composition Insights for Calaca
- The Calaca Airbnb market composition is heavily skewed towards Entire Home/Apt listings, which make up 78% of the 41 active rentals. This indicates strong guest preference for privacy and space.
- Looking at the property type distribution in Calaca, House properties are the most common (51.2%), reflecting the local real estate landscape.
- Houses represent a significant 51.2% portion, catering likely to families or larger groups.
- The presence of 7.3% Hotel/Boutique listings indicates integration with traditional hospitality.
- Smaller segments like apartment/condo, unique stays (combined 7.3%) offer potential for unique stay experiences.
Calaca Airbnb Room Capacity Analysis (2026): Bedroom Distribution
Distribution of Listings by Number of Bedrooms
Room Capacity Insights for Calaca
- The dominant room capacity in Calaca is 1 bedroom listings, making up 24.4% of the market. This suggests a strong demand for properties suitable for couples or solo travelers.
- Together, 1 bedroom and 3 bedrooms properties represent 43.9% of the active Airbnb listings in Calaca, indicating a high concentration in these sizes.
- A significant 41.5% of listings offer 3+ bedrooms, catering to larger groups and families seeking more space in Calaca.
Calaca Vacation Rental Guest Capacity Trends (2026)
Distribution of Listings by Guest Capacity
Guest Capacity Insights for Calaca
- The most common guest capacity trend in Calaca vacation rentals is listings accommodating 8+ guests (58.5%). This suggests the primary traveler segment is likely larger groups.
- Properties designed for 8+ guests and 4 guests dominate the Calaca STR market, accounting for 78.0% of listings.
- 65.8% of properties accommodate 6+ guests, serving the market segment for larger families or group travel in Calaca.
- On average, properties in Calaca are equipped to host 6.2 guests.
Calaca Airbnb Booking Patterns (2026): Available vs. Booked Days
Available Days Distribution
Booked Days Distribution
Booking Pattern Insights for Calaca
- The most common availability pattern in Calaca falls within the 271-366 days range, representing 87.8% of listings. This suggests many properties have significant open periods on their calendars.
- Approximately 97.6% of listings show high availability (181+ days open annually), indicating potential for increased bookings or specific owner usage patterns.
- For booked days, the 31-90 days range is most frequent in Calaca (48.8%), reflecting common guest stay durations or potential owner blocking patterns.
- A notable 2.4% of properties secure long booking periods (181+ days booked per year), highlighting successful long-term rental strategies or significant owner usage.
Calaca Airbnb Minimum Stay Requirements Analysis
Distribution of Listings by Minimum Night Requirement
1 Night
38 listings
92.7% of total
2 Nights
2 listings
4.9% of total
30+ Nights
1 listings
2.4% of total
Key Insights
- The most prevalent minimum stay requirement in Calaca is 1 Night, adopted by 92.7% of listings. This highlights the market's preference for shorter, flexible bookings.
- A strong majority (97.6%) of the Calaca Airbnb data shows acceptance of very short stays (1-2 nights), indicating a dynamic, high-turnover market.
- Dedicated monthly rentals (30+ nights) represent a small niche (2.4%), possibly an untapped area for hosts.
Recommendations
- Align with the market by considering a 1 Night minimum stay, as 92.7% of Calaca hosts use this setting.
- Adjust minimum nights based on seasonality – potentially shorter during low season and longer during peak demand periods in Calaca.
Calaca Airbnb Cancellation Policy Trends Analysis (2026)
Limited
4 listings
9.8% of total
Flexible
9 listings
22% of total
Moderate
12 listings
29.3% of total
Firm
10 listings
24.4% of total
Strict
6 listings
14.6% of total
Cancellation Policy Insights for Calaca
- The prevailing Airbnb cancellation policy trend in Calaca is Moderate, used by 29.3% of listings.
- There's a relatively balanced mix between guest-friendly (51.3%) and stricter (39.0%) policies, offering choices for different guest needs.
Recommendations for Hosts
- Consider adopting a Moderate policy to align with the 29.3% market standard in Calaca.
- Using a Strict policy might deter some guests, as only 14.6% of listings use it. Evaluate if potential revenue protection outweighs possible lower booking rates.
- Regularly review your cancellation policy against competitors and market demand shifts in Calaca.
Calaca STR Booking Lead Time Analysis (2026)
Average Booking Lead Time by Month
Booking Lead Time Insights for Calaca
- The overall average booking lead time for vacation rentals in Calaca is 27 days.
- Guests book furthest in advance for stays during December (average 43 days), likely coinciding with peak travel demand or local events.
- The shortest booking windows occur for stays in September (average 13 days), indicating more last-minute travel plans during this time.
- Seasonally, Winter (29 days avg.) sees the longest lead times, while Summer (19 days avg.) has the shortest, reflecting typical travel planning cycles.
Recommendations for Hosts
- Use the overall average lead time (27 days) as a baseline for your pricing and availability strategy in Calaca.
- For December stays, consider implementing length-of-stay discounts or slightly higher rates for bookings made less than 43 days out to capitalize on advance planning.
- During September, focus on last-minute booking availability and promotions, as guests book with very short notice (13 days avg.).
- Target marketing efforts for the Winter season well in advance (at least 29 days) to capture early planners.
- Monitor your own booking lead times against these Calaca averages to identify opportunities for dynamic pricing adjustments.
Popular & Essential Airbnb Amenities in Calaca (2026)
Amenity Prevalence
Amenity Insights for Calaca
- Essential amenities in Calaca that guests expect include: Free parking on premises, Air conditioning. Lacking these (any) could significantly impact bookings.
- Popular amenities like Dishes and silverware, BBQ grill, TV are common but not universal. Offering these can provide a competitive edge.
- Warning: Wifi is not universally provided but is considered essential globally. Ensure reliable Wifi is offered.
Recommendations for Hosts
- Ensure your listing includes all essential amenities for Calaca: Free parking on premises, Air conditioning.
- Prioritize adding missing essentials: Air conditioning.
- Consider adding popular differentiators like Dishes and silverware or BBQ grill to increase appeal.
- Highlight unique or less common amenities you offer (e.g., hot tub, dedicated workspace, EV charger) in your listing description and photos.
- Regularly check competitor amenities in Calaca to stay competitive.
Calaca Airbnb Guest Demographics & Profile Analysis (2026)
Guest Profile Summary for Calaca
- The typical guest profile for Airbnb in Calaca consists of primarily domestic travelers (83%), often arriving from nearby Manila, typically belonging to the Post-2000s (Gen Z/Alpha) group (50%), primarily speaking English or Tagalog.
- Domestic travelers account for 83.2% of guests.
- Key international markets include Philippines (83.2%) and United States (5.6%).
- Top languages spoken are English (54.1%) followed by Tagalog (20.3%).
- A significant demographic segment is the Post-2000s (Gen Z/Alpha) group, representing 50% of guests.
Recommendations for Hosts
- Target domestic marketing efforts towards travelers from Manila and Quezon City.
- Tailor amenities and listing descriptions to appeal to the dominant Post-2000s (Gen Z/Alpha) demographic (e.g., highlight fast WiFi, smart home features, local guides).
- Highlight unique local experiences or amenities relevant to the primary guest profile.
- Consider seasonal promotions aligned with peak travel times for key origin markets.
Nearby Short-Term Rental Market Comparison
How does the Calaca Airbnb market stack up against its neighbors? Compare key performance metrics like average monthly revenue, ADR, and occupancy rates in surrounding areas to understand the broader regional STR landscape.
| Market | Active Properties | Monthly Revenue | Daily Rate | Avg. Occupancy |
|---|---|---|---|---|
| Bustos | 10 | $1,728 | $216.86 | 28% |
| Cabangan | 44 | $1,529 | $200.94 | 26% |
| Lian | 121 | $1,491 | $216.20 | 24% |
| Jalajala | 19 | $1,489 | $234.86 | 21% |
| Laoag | 17 | $1,412 | $158.39 | 33% |
| Beneg | 13 | $1,304 | $267.34 | 22% |
| Arew | 11 | $1,288 | $193.81 | 22% |
| Cabuyao | 25 | $1,202 | $114.93 | 36% |
| Binangonan | 49 | $1,191 | $135.12 | 29% |
| Porac | 51 | $1,157 | $203.91 | 21% |