Laurel Airbnb Market Analysis 2026: Short Term Rental Data & Vacation Rental Statistics in Batangas, Philippines
Is Airbnb profitable in Laurel in 2026? Explore comprehensive Airbnb analytics for Laurel, Batangas, Philippines to uncover income potential. This 2026 STR market report for Laurel, based on AirROI data from February 2025 to January 2026, reveals key trends in the niche market of 106 active listings.
Whether you're considering an Airbnb investment in Laurel, optimizing your existing vacation rental, or exploring rental arbitrage opportunities, understanding the Laurel Airbnb data is crucial. Leveraging the low regulation environment is key to maximizing your short term rental income potential. Let's dive into the specifics.
Key Laurel Airbnb Performance Metrics Overview
Monthly Airbnb Revenue Variations & Income Potential in Laurel (2026)
Understanding the monthly revenue variations for Airbnb listings in Laurel is key to maximizing your short term rental income potential. Seasonality significantly impacts earnings. Our analysis, based on data from the past 12 months, shows that the peak revenue month for STRs in Laurel is typically December, while August often presents the lowest earnings, highlighting opportunities for strategic pricing adjustments during shoulder and low seasons. Explore the typical Airbnb income in Laurel across different performance tiers:
- Best-in-class properties (Top 10%) achieve $1,424+ monthly, often utilizing dynamic pricing and superior guest experiences.
- Strong performing properties (Top 25%) earn $782 or more, indicating effective management and desirable locations/amenities.
- Typical properties (Median) generate around $354 per month, representing the average market performance.
- Entry-level properties (Bottom 25%) see earnings around $168, often with potential for optimization.
Average Monthly Airbnb Earnings Trend in Laurel
Laurel Airbnb Occupancy Rate Trends (2026)
Maximize your bookings by understanding the Laurel STR occupancy trends. Seasonal demand shifts significantly influence how often properties are booked. Typically, Decembersees the highest demand (peak season occupancy), while June experiences the lowest (low season). Effective strategies, like adjusting minimum stays or offering promotions, can boost occupancy during slower periods. Here's how different property tiers perform in Laurel:
- Best-in-class properties (Top 10%) achieve 44%+ occupancy, indicating high desirability and potentially optimized availability.
- Strong performing properties (Top 25%) maintain 30% or higher occupancy, suggesting good market fit and guest satisfaction.
- Typical properties (Median) have an occupancy rate around 16%.
- Entry-level properties (Bottom 25%) average 9% occupancy, potentially facing higher vacancy.
Average Monthly Occupancy Rate Trend in Laurel
Average Daily Rate (ADR) Airbnb Trends in Laurel (2026)
Effective short term rental pricing strategy in Laurel involves understanding monthly ADR fluctuations. The Average Daily Rate (ADR) for Airbnb in Laurel typically peaks in June and dips lowest during January. Leveraging Airbnb dynamic pricing tools or strategies based on this seasonality can significantly boost revenue. Here's a look at the typical nightly rates achieved:
- Best-in-class properties (Top 10%) command rates of $181+ per night, often due to premium features or locations.
- Strong performing properties (Top 25%) achieve nightly rates of $106 or more.
- Typical properties (Median) charge around $70 per night.
- Entry-level properties (Bottom 25%) earn around $53 per night.
Average Daily Rate (ADR) Trend by Month in Laurel
Get Live Laurel Market Intelligence 👇

Explore Real-time Analytics
Airbnb Seasonality Analysis & Trends in Laurel (2026)
Peak Season (December, March, February)
- Revenue averages $756 per month
- Occupancy rates average 27.5%
- Daily rates average $99
Shoulder Season
- Revenue averages $595 per month
- Occupancy maintains around 19.5%
- Daily rates hold near $100
Low Season (August, September, November)
- Revenue drops to average $521 per month
- Occupancy decreases to average 17.8%
- Daily rates adjust to average $99
Seasonality Insights for Laurel
- The Airbnb seasonality in Laurel shows moderate seasonality with distinct peak and low periods. While the sections above show seasonal averages, it's also insightful to look at the extremes:
- During the high season, the absolute peak month showcases Laurel's highest earning potential, with monthly revenues capable of climbing to $885, occupancy reaching a high of 30.6%, and ADRs peaking at $104.
- Conversely, the slowest single month of the year, typically falling within the low season, marks the market's lowest point. In this month, revenue might dip to $514, occupancy could drop to 17.0%, and ADRs may adjust down to $96.
- Understanding both the seasonal averages and these monthly peaks and troughs in revenue, occupancy, and ADR is crucial for maximizing your Airbnb profit potential in Laurel.
Seasonal Strategies for Maximizing Profit
- Peak Season: Maximize revenue through premium pricing and potentially longer minimum stays. Ensure high availability.
- Low Season: Offer competitive pricing, special promotions (e.g., extended stay discounts), and flexible cancellation policies. Target off-season travelers like remote workers or budget-conscious guests.
- Shoulder Seasons: Implement dynamic pricing that balances peak and low rates. Target weekend travelers or specific events. Offer slightly more flexible terms than peak season.
- Regularly analyze your own performance against these Laurel seasonality benchmarks and adjust your pricing and availability strategy accordingly.
Best Areas for Airbnb Investment in Laurel (2026)
Exploring the top neighborhoods for short-term rentals in Laurel? This section highlights key areas, outlining why they are attractive for hosts and guests, along with notable local attractions. Consider these locations based on your target guest profile and investment strategy.
| Neighborhood / Area | Why Host Here? (Target Guests & Appeal) | Key Attractions & Landmarks |
|---|---|---|
| Calatagan | A popular beach destination in Batangas known for its beautiful beaches and seaside resorts. Great for vacationers looking for relaxation and water sports. | Calatagan Beach, Burot Beach, Montemaria Shrine, Marina Bay, Laiya Beach Resort, Aninuan Beach |
| Nasugbu | Famous for its resorts and beach areas, Nasugbu is a favored getaway for locals and tourists alike. Ideal for water activities and family vacations. | Sombrero Island, Calubcub Beach, Nasugbu Mangrove Park, La Luz Beach Resort, Terrazas de Punta Fuego, Fortune Island |
| Lian | Known for its scenic beaches and quieter atmosphere, making it a perfect spot for travelers seeking a peaceful retreat. | Matabungkay Beach Resort, Brgy. Bagalangit Beach, Lian White Sand Beach, Mabini Beach, Reynaldo's Beach Resort |
| Agoncillo | Offers a unique lakefront experience with beautiful views of Taal Lake and the Taal Volcano, suitable for nature lovers and adventurers. | Taal Lake, Taal Volcano, Agoncillo Church, Pagkilatan Beach, Malagasang Beach |
| San Juan | Famous for its surfing beaches and vibrant local culture. Attracts surfers and beach lovers from all over. | Surfing spots at Urbiztondo, La Union's beach scene, San Juan Beach, Buhangin Beach, Laiya Beach |
| Taal | Rich in cultural heritage, Taal attracts visitors interested in history, architecture, and local cuisine, with opportunities for exploration. | Taal Heritage Town, Basilica of St. Martin de Tours, Galleria Taal, Taal Lake, Old Spanish Colonial Houses |
| Batangas City | As the capital of Batangas, it serves as a gateway with bustling local markets and is close to various tourist attractions. | Batangas Cathedral, Museo ng Batangas, Batangas Bay, Local markets, Sto. Domingo Church |
| Lemery | Known for its proximity to Taal Lake and volcano, attracting adventurous spirits and nature enthusiasts. | Taal Volcano views, Lemery Beach, Basilica de San Martin de Tours, Eco Park, Waterfalls Tours |
Understanding Airbnb License Requirements & STR Laws in Laurel (2026)
While Laurel, Batangas, Philippines currently shows low STR regulations, specific Airbnb license requirements might still exist or change. Always verify the latest short term rental regulations and Airbnb license requirements directly with local government authorities for Laurel to ensure full compliance before hosting.
(Source: AirROI data, 2026, finding no licensed listings among those analyzed)
Top Performing Airbnb Properties in Laurel (2026)
Benchmark your potential! Explore examples of top-performing Airbnb properties in Laurelbased on Trailing Twelve Month (TTM) revenue. Analyze their characteristics, revenue, occupancy rate, and ADR to understand what drives success in this market.
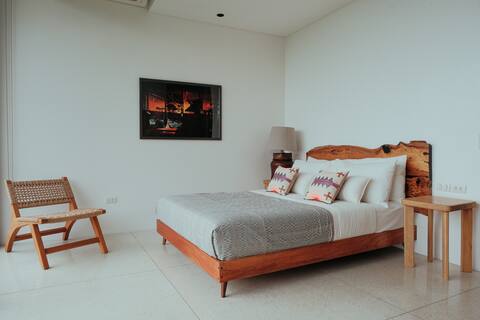
Hill House
Private Room • 4 bedrooms
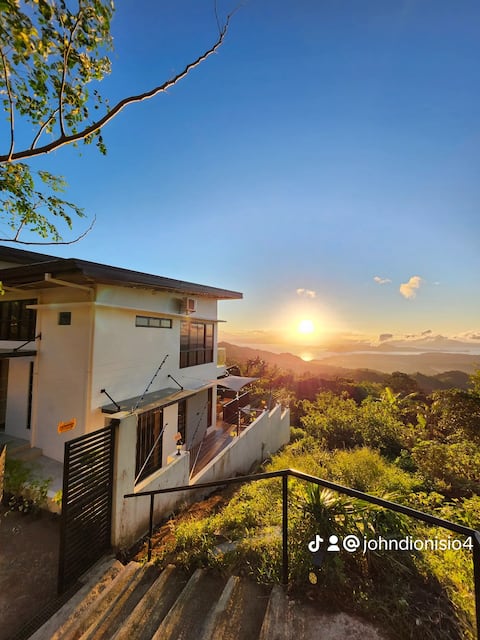
Tagaytay Villa. The Hillside Villa
Entire Place • 3 bedrooms
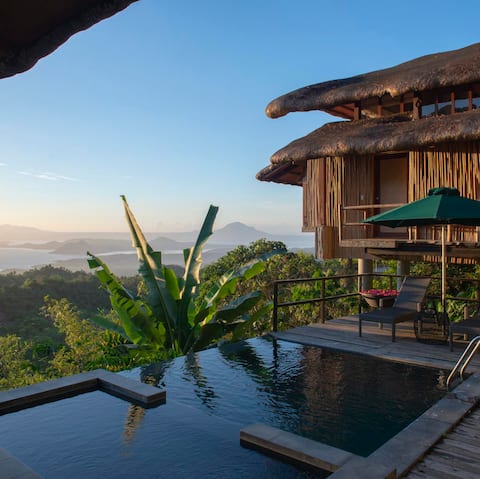
Narra Hill - Kubo 1 Suite
Private Room • 2 bedrooms

Twin Lakes Tagaytay Elegant 2-BR with Taal View
Entire Place • 2 bedrooms
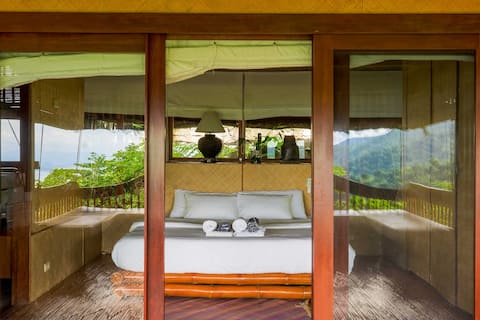
Narra Hill - Kubo 2, Suite
Private Room • 1 bedroom
Narra Hill - Balcony Room
Private Room • N/A
Note: Performance varies based on location, size, amenities, seasonality, and management quality. Data reflects the past 12 months.
Top Performing Airbnb Hosts in Laurel (2026)
Learn from the best! This table showcases top-performing Airbnb hosts in Laurel based on the number of properties managed and estimated total revenue over the past year. Analyze their scale and performance metrics.
| Host Name | Properties | Grossing Revenue | Stay Reviews | Avg Rating |
|---|---|---|---|---|
| Narra | 7 | $136,274 | 1413 | 4.71/5.0 |
| Kim | 20 | $76,924 | 899 | 4.88/5.0 |
| John Carlo | 1 | $31,287 | 55 | 4.87/5.0 |
| Cristina | 1 | $19,223 | 194 | 4.97/5.0 |
| Yen..(Dionelen) | 9 | $17,214 | 274 | 4.84/5.0 |
| Fairra | 1 | $13,547 | 248 | 4.84/5.0 |
| Kim And Chrys | 3 | $12,736 | 635 | 4.86/5.0 |
| Tricia & J | 1 | $12,192 | 146 | 4.71/5.0 |
| Mark | 1 | $11,935 | 58 | 4.91/5.0 |
| Judd | 1 | $9,984 | 654 | 4.94/5.0 |
Analyzing the strategies of top hosts, such as their property selection, pricing, and guest communication, can offer valuable lessons for optimizing your own Airbnb operations in Laurel.
Dive Deeper: Advanced Laurel STR Market Data (2026)
Ready to unlock more insights? AirROI provides access to advanced metrics and comprehensive Airbnb data for Laurel. Explore detailed analytics beyond this report to refine your investment strategy, optimize pricing, and maximize your vacation rental profits.
Explore Advanced MetricsLaurel Short-Term Rental Market Composition (2026): Property & Room Types
Room Type Distribution
Property Type Distribution
Market Composition Insights for Laurel
- The Laurel Airbnb market composition is heavily skewed towards Entire Home/Apt listings, which make up 84% of the 106 active rentals. This indicates strong guest preference for privacy and space.
- Looking at the property type distribution in Laurel, Apartment/Condo properties are the most common (71.7%), reflecting the local real estate landscape.
- The presence of 12.3% Hotel/Boutique listings indicates integration with traditional hospitality.
- Smaller segments like outdoor/unique, others (combined 3.7%) offer potential for unique stay experiences.
Laurel Airbnb Room Capacity Analysis (2026): Bedroom Distribution
Distribution of Listings by Number of Bedrooms
Room Capacity Insights for Laurel
- The dominant room capacity in Laurel is 1 bedroom listings, making up 57.5% of the market. This suggests a strong demand for properties suitable for couples or solo travelers.
- Together, 1 bedroom and 2 bedrooms properties represent 66.9% of the active Airbnb listings in Laurel, indicating a high concentration in these sizes.
- With over half the market (57.5%) consisting of studios or 1-bedroom units, Laurel is particularly well-suited for individuals or couples.
Laurel Vacation Rental Guest Capacity Trends (2026)
Distribution of Listings by Guest Capacity
Guest Capacity Insights for Laurel
- The most common guest capacity trend in Laurel vacation rentals is listings accommodating 6 guests (20.8%). This suggests the primary traveler segment is likely larger groups.
- Properties designed for 6 guests and 8+ guests dominate the Laurel STR market, accounting for 40.6% of listings.
- 42.5% of properties accommodate 6+ guests, serving the market segment for larger families or group travel in Laurel.
- On average, properties in Laurel are equipped to host 4.8 guests.
Laurel Airbnb Booking Patterns (2026): Available vs. Booked Days
Available Days Distribution
Booked Days Distribution
Booking Pattern Insights for Laurel
- The most common availability pattern in Laurel falls within the 271-366 days range, representing 81.1% of listings. This suggests many properties have significant open periods on their calendars.
- Approximately 98.1% of listings show high availability (181+ days open annually), indicating potential for increased bookings or specific owner usage patterns.
- For booked days, the 1-30 days range is most frequent in Laurel (44.3%), reflecting common guest stay durations or potential owner blocking patterns.
- A notable 1.9% of properties secure long booking periods (181+ days booked per year), highlighting successful long-term rental strategies or significant owner usage.
Laurel Airbnb Minimum Stay Requirements Analysis
Distribution of Listings by Minimum Night Requirement
1 Night
103 listings
97.2% of total
2 Nights
1 listings
0.9% of total
30+ Nights
2 listings
1.9% of total
Key Insights
- The most prevalent minimum stay requirement in Laurel is 1 Night, adopted by 97.2% of listings. This highlights the market's preference for shorter, flexible bookings.
- A strong majority (98.1%) of the Laurel Airbnb data shows acceptance of very short stays (1-2 nights), indicating a dynamic, high-turnover market.
- Dedicated monthly rentals (30+ nights) represent a small niche (1.9%), possibly an untapped area for hosts.
Recommendations
- Align with the market by considering a 1 Night minimum stay, as 97.2% of Laurel hosts use this setting.
- Adjust minimum nights based on seasonality – potentially shorter during low season and longer during peak demand periods in Laurel.
Laurel Airbnb Cancellation Policy Trends Analysis (2026)
Super Strict 30 Days
3 listings
2.8% of total
Limited
1 listings
0.9% of total
Flexible
18 listings
17% of total
Moderate
49 listings
46.2% of total
Firm
20 listings
18.9% of total
Strict
15 listings
14.2% of total
Cancellation Policy Insights for Laurel
- The prevailing Airbnb cancellation policy trend in Laurel is Moderate, used by 46.2% of listings.
- There's a relatively balanced mix between guest-friendly (63.2%) and stricter (33.1%) policies, offering choices for different guest needs.
Recommendations for Hosts
- Consider adopting a Moderate policy to align with the 46.2% market standard in Laurel.
- Using a Strict policy might deter some guests, as only 14.2% of listings use it. Evaluate if potential revenue protection outweighs possible lower booking rates.
- Regularly review your cancellation policy against competitors and market demand shifts in Laurel.
Laurel STR Booking Lead Time Analysis (2026)
Average Booking Lead Time by Month
Booking Lead Time Insights for Laurel
- The overall average booking lead time for vacation rentals in Laurel is 24 days.
- Guests book furthest in advance for stays during December (average 43 days), likely coinciding with peak travel demand or local events.
- The shortest booking windows occur for stays in September (average 16 days), indicating more last-minute travel plans during this time.
- Seasonally, Winter (29 days avg.) sees the longest lead times, while Summer (19 days avg.) has the shortest, reflecting typical travel planning cycles.
Recommendations for Hosts
- Use the overall average lead time (24 days) as a baseline for your pricing and availability strategy in Laurel.
- For December stays, consider implementing length-of-stay discounts or slightly higher rates for bookings made less than 43 days out to capitalize on advance planning.
- Target marketing efforts for the Winter season well in advance (at least 29 days) to capture early planners.
- Monitor your own booking lead times against these Laurel averages to identify opportunities for dynamic pricing adjustments.
Popular & Essential Airbnb Amenities in Laurel (2026)
Amenity Prevalence
Amenity Insights for Laurel
- Essential amenities in Laurel that guests expect include: Air conditioning, Free parking on premises. Lacking these (any) could significantly impact bookings.
- Popular amenities like Wifi, TV, Smoke alarm are common but not universal. Offering these can provide a competitive edge.
- Warning: Wifi is not universally provided but is considered essential globally. Ensure reliable Wifi is offered.
Recommendations for Hosts
- Ensure your listing includes all essential amenities for Laurel: Air conditioning, Free parking on premises.
- Prioritize adding missing essentials: Free parking on premises.
- Consider adding popular differentiators like Wifi or TV to increase appeal.
- Highlight unique or less common amenities you offer (e.g., hot tub, dedicated workspace, EV charger) in your listing description and photos.
- Regularly check competitor amenities in Laurel to stay competitive.
Laurel Airbnb Guest Demographics & Profile Analysis (2026)
Guest Profile Summary for Laurel
- The typical guest profile for Airbnb in Laurel consists of primarily domestic travelers (91%), often arriving from nearby Manila, typically belonging to the Post-2000s (Gen Z/Alpha) group (50%), primarily speaking English or Tagalog.
- Domestic travelers account for 90.6% of guests.
- Key international markets include Philippines (90.6%) and United States (2.9%).
- Top languages spoken are English (53.2%) followed by Tagalog (22.5%).
- A significant demographic segment is the Post-2000s (Gen Z/Alpha) group, representing 50% of guests.
Recommendations for Hosts
- Target domestic marketing efforts towards travelers from Manila and Quezon City.
- Tailor amenities and listing descriptions to appeal to the dominant Post-2000s (Gen Z/Alpha) demographic (e.g., highlight fast WiFi, smart home features, local guides).
- Highlight unique local experiences or amenities relevant to the primary guest profile.
- Consider seasonal promotions aligned with peak travel times for key origin markets.
Nearby Short-Term Rental Market Comparison
How does the Laurel Airbnb market stack up against its neighbors? Compare key performance metrics like average monthly revenue, ADR, and occupancy rates in surrounding areas to understand the broader regional STR landscape.
| Market | Active Properties | Monthly Revenue | Daily Rate | Avg. Occupancy |
|---|---|---|---|---|
| Bustos | 10 | $1,728 | $216.86 | 28% |
| Cabangan | 44 | $1,529 | $200.94 | 26% |
| Lian | 121 | $1,491 | $216.20 | 24% |
| Jalajala | 19 | $1,489 | $234.86 | 21% |
| Laoag | 17 | $1,412 | $158.39 | 33% |
| Beneg | 13 | $1,304 | $267.34 | 22% |
| Arew | 11 | $1,288 | $193.81 | 22% |
| Cabuyao | 25 | $1,202 | $114.93 | 36% |
| Binangonan | 49 | $1,191 | $135.12 | 29% |
| Porac | 51 | $1,157 | $203.91 | 21% |