Lemery Airbnb Market Analysis 2026: Short Term Rental Data & Vacation Rental Statistics in Batangas, Philippines
Is Airbnb profitable in Lemery in 2026? Explore comprehensive Airbnb analytics for Lemery, Batangas, Philippines to uncover income potential. This 2026 STR market report for Lemery, based on AirROI data from February 2025 to January 2026, reveals key trends in the niche market of 20 active listings.
Whether you're considering an Airbnb investment in Lemery, optimizing your existing vacation rental, or exploring rental arbitrage opportunities, understanding the Lemery Airbnb data is crucial. Leveraging the low regulation environment is key to maximizing your short term rental income potential. Let's dive into the specifics.
Key Lemery Airbnb Performance Metrics Overview
Monthly Airbnb Revenue Variations & Income Potential in Lemery (2026)
Understanding the monthly revenue variations for Airbnb listings in Lemery is key to maximizing your short term rental income potential. Seasonality significantly impacts earnings. Our analysis, based on data from the past 12 months, shows that the peak revenue month for STRs in Lemery is typically May, while October often presents the lowest earnings, highlighting opportunities for strategic pricing adjustments during shoulder and low seasons. Explore the typical Airbnb income in Lemery across different performance tiers:
- Best-in-class properties (Top 10%) achieve $1,840+ monthly, often utilizing dynamic pricing and superior guest experiences.
- Strong performing properties (Top 25%) earn $1,168 or more, indicating effective management and desirable locations/amenities.
- Typical properties (Median) generate around $526 per month, representing the average market performance.
- Entry-level properties (Bottom 25%) see earnings around $230, often with potential for optimization.
Average Monthly Airbnb Earnings Trend in Lemery
Lemery Airbnb Occupancy Rate Trends (2026)
Maximize your bookings by understanding the Lemery STR occupancy trends. Seasonal demand shifts significantly influence how often properties are booked. Typically, Decembersees the highest demand (peak season occupancy), while October experiences the lowest (low season). Effective strategies, like adjusting minimum stays or offering promotions, can boost occupancy during slower periods. Here's how different property tiers perform in Lemery:
- Best-in-class properties (Top 10%) achieve 29%+ occupancy, indicating high desirability and potentially optimized availability.
- Strong performing properties (Top 25%) maintain 20% or higher occupancy, suggesting good market fit and guest satisfaction.
- Typical properties (Median) have an occupancy rate around 13%.
- Entry-level properties (Bottom 25%) average 7% occupancy, potentially facing higher vacancy.
Average Monthly Occupancy Rate Trend in Lemery
Average Daily Rate (ADR) Airbnb Trends in Lemery (2026)
Effective short term rental pricing strategy in Lemery involves understanding monthly ADR fluctuations. The Average Daily Rate (ADR) for Airbnb in Lemery typically peaks in February and dips lowest during January. Leveraging Airbnb dynamic pricing tools or strategies based on this seasonality can significantly boost revenue. Here's a look at the typical nightly rates achieved:
- Best-in-class properties (Top 10%) command rates of $358+ per night, often due to premium features or locations.
- Strong performing properties (Top 25%) achieve nightly rates of $201 or more.
- Typical properties (Median) charge around $136 per night.
- Entry-level properties (Bottom 25%) earn around $80 per night.
Average Daily Rate (ADR) Trend by Month in Lemery
Get Live Lemery Market Intelligence 👇
Explore Real-time Analytics
Airbnb Seasonality Analysis & Trends in Lemery (2026)
Peak Season (May, June, December)
- Revenue averages $1,135 per month
- Occupancy rates average 22.0%
- Daily rates average $169
Shoulder Season
- Revenue averages $904 per month
- Occupancy maintains around 14.4%
- Daily rates hold near $176
Low Season (January, September, October)
- Revenue drops to average $493 per month
- Occupancy decreases to average 9.2%
- Daily rates adjust to average $139
Seasonality Insights for Lemery
- The Airbnb seasonality in Lemery shows highly seasonal trends requiring careful strategy. While the sections above show seasonal averages, it's also insightful to look at the extremes:
- During the high season, the absolute peak month showcases Lemery's highest earning potential, with monthly revenues capable of climbing to $1,283, occupancy reaching a high of 25.4%, and ADRs peaking at $189.
- Conversely, the slowest single month of the year, typically falling within the low season, marks the market's lowest point. In this month, revenue might dip to $437, occupancy could drop to 8.3%, and ADRs may adjust down to $129.
- Understanding both the seasonal averages and these monthly peaks and troughs in revenue, occupancy, and ADR is crucial for maximizing your Airbnb profit potential in Lemery.
Seasonal Strategies for Maximizing Profit
- Peak Season: Maximize revenue through premium pricing and potentially longer minimum stays. Ensure high availability.
- Low Season: Offer competitive pricing, special promotions (e.g., extended stay discounts), and flexible cancellation policies. Target off-season travelers like remote workers or budget-conscious guests.
- Shoulder Seasons: Implement dynamic pricing that balances peak and low rates. Target weekend travelers or specific events. Offer slightly more flexible terms than peak season.
- Regularly analyze your own performance against these Lemery seasonality benchmarks and adjust your pricing and availability strategy accordingly.
Best Areas for Airbnb Investment in Lemery (2026)
Exploring the top neighborhoods for short-term rentals in Lemery? This section highlights key areas, outlining why they are attractive for hosts and guests, along with notable local attractions. Consider these locations based on your target guest profile and investment strategy.
| Neighborhood / Area | Why Host Here? (Target Guests & Appeal) | Key Attractions & Landmarks |
|---|---|---|
| Anilao | Famous for diving and snorkeling, Anilao attracts tourists looking for underwater adventures, making it ideal for Airbnb investments. | Anilao Beach, Sepoc Beach, Batangas Bay, Sombrero Island, Sepoc Island |
| Taal Volcano | A popular tourist destination with stunning views and hiking opportunities, attracting nature lovers and adventure seekers. | Taal Lake, Taal Volcano hiking, Taal Heritage Town, Balay ni Mayang, People's Park in the Sky |
| Lemery Beach | A beautiful beach destination where tourists can enjoy sunbathing and water sports, making it attractive for Airbnb hosting. | Lemery Beach, Lemery Port, Local seafood restaurants, Water sports activities, Nearby resorts |
| San Juan | Known for its surf spots and beach resorts, San Juan draws surfers and beachgoers, providing a great market for short-term rentals. | Urbung Beach, La Luz Beach Resort, Surfing spots, Local surfing community, Night markets |
| Nasugbu | Famed for its beautiful beaches and luxury resorts, Nasugbu attracts affluent tourists looking for relaxation and leisure. | Fortune Island, Nasugbu beaches, Kaybiang Tunnel, Beach resorts, Nightlife spots |
| Calatagan | Known for its pristine beaches and laid-back atmosphere, it is perfect for families and individuals seeking relaxation. | Calatagan Beach, Burot Beach, Matabungkay Beach, Family-friendly resorts, Beach camping |
| Lemery town proper | The center of Lemery, offering access to local culture, food, and convenience for tourists, making it a strategic location for Airbnb. | Public market, Local food establishments, Cultural landmarks, Community events, Accessibility to transport |
| Laurel | Close to Taal Lake and the volcanic landscape, it offers a unique rural experience perfect for those looking to explore nature. | Taal Lake views, Hiking trails, Local farms, Cultural experiences, Historical sites |
Understanding Airbnb License Requirements & STR Laws in Lemery (2026)
While Lemery, Batangas, Philippines currently shows low STR regulations, specific Airbnb license requirements might still exist or change. Always verify the latest short term rental regulations and Airbnb license requirements directly with local government authorities for Lemery to ensure full compliance before hosting.
(Source: AirROI data, 2026, finding no licensed listings among those analyzed)
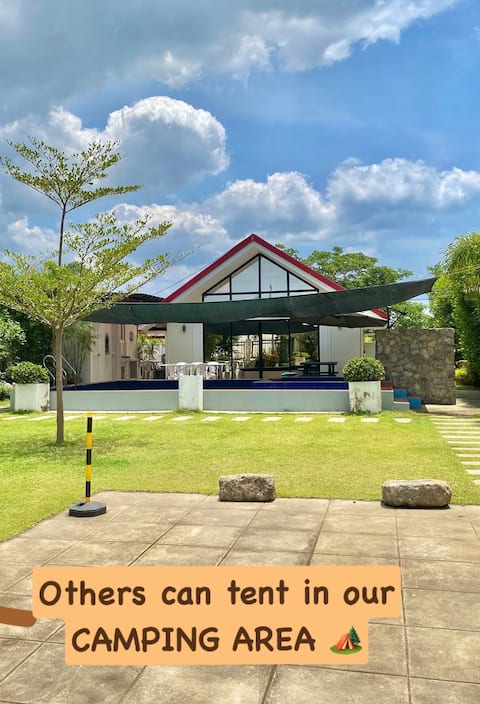
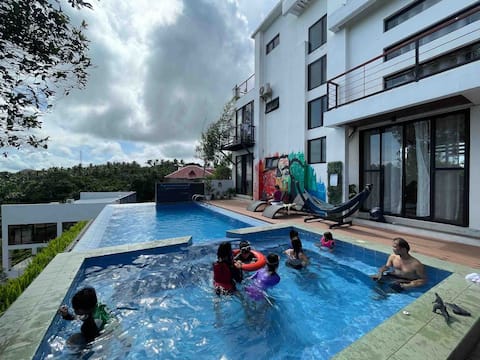
Top Performing Airbnb Properties in Lemery (2026)
Benchmark your potential! Explore examples of top-performing Airbnb properties in Lemerybased on Trailing Twelve Month (TTM) revenue. Analyze their characteristics, revenue, occupancy rate, and ADR to understand what drives success in this market.
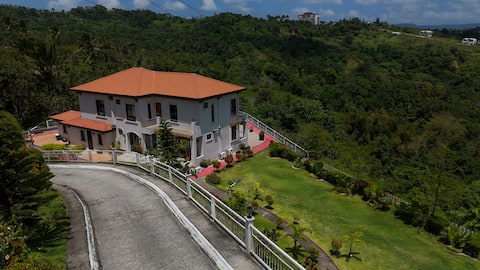
Serene Holiday Home Mt Taal View
Entire Place • 6 bedrooms
Private Lakeside Poolhouse
Entire Place • 2 bedrooms
ALTHEA’s ORCHARD PRIVATE RESORT & EVENTS PLACE
Entire Place • 4 bedrooms
Villa Rica House | Beachfront+WiFi+Bonfire+Karaoke
Entire Place • 2 bedrooms

Sampaguita House - Beach Access + WIFI + Bonfire
Entire Place • 2 bedrooms
Single Dome Pool Villa - Prana by Shanti
Entire Place • 1 bedroom
Note: Performance varies based on location, size, amenities, seasonality, and management quality. Data reflects the past 12 months.
Top Performing Airbnb Hosts in Lemery (2026)
Learn from the best! This table showcases top-performing Airbnb hosts in Lemery based on the number of properties managed and estimated total revenue over the past year. Analyze their scale and performance metrics.
| Host Name | Properties | Grossing Revenue | Stay Reviews | Avg Rating |
|---|---|---|---|---|
| Maria Maila | 1 | $32,433 | 11 | 4.73/5.0 |
| Rica Mabelle | 6 | $29,144 | 567 | 4.73/5.0 |
| Shanti | 4 | $15,836 | 37 | 4.83/5.0 |
| Ja | 1 | $14,063 | 6 | 4.83/5.0 |
| Althea | 1 | $14,020 | 2 | Not Rated |
| Jillie | 2 | $5,683 | 45 | 4.75/5.0 |
| Jen | 1 | $3,430 | 52 | 4.62/5.0 |
| Ma Ana Roberta “Robbie” | 1 | $3,223 | 34 | 4.76/5.0 |
| Tiano | 1 | $2,477 | 56 | 4.77/5.0 |
| Legends | 1 | $894 | 1 | Not Rated |
Analyzing the strategies of top hosts, such as their property selection, pricing, and guest communication, can offer valuable lessons for optimizing your own Airbnb operations in Lemery.
Dive Deeper: Advanced Lemery STR Market Data (2026)
Ready to unlock more insights? AirROI provides access to advanced metrics and comprehensive Airbnb data for Lemery. Explore detailed analytics beyond this report to refine your investment strategy, optimize pricing, and maximize your vacation rental profits.
Explore Advanced MetricsLemery Short-Term Rental Market Composition (2026): Property & Room Types
Room Type Distribution
Property Type Distribution
Market Composition Insights for Lemery
- The Lemery Airbnb market composition is heavily skewed towards Entire Home/Apt listings, which make up 95% of the 20 active rentals. This indicates strong guest preference for privacy and space.
- Looking at the property type distribution in Lemery, House properties are the most common (65%), reflecting the local real estate landscape.
- Houses represent a significant 65% portion, catering likely to families or larger groups.
Lemery Airbnb Room Capacity Analysis (2026): Bedroom Distribution
Distribution of Listings by Number of Bedrooms
Room Capacity Insights for Lemery
- The dominant room capacity in Lemery is 2 bedrooms listings, making up 45% of the market. This suggests a strong demand for properties suitable for couples or solo travelers.
- Together, 2 bedrooms and 1 bedroom properties represent 85.0% of the active Airbnb listings in Lemery, indicating a high concentration in these sizes.
Lemery Vacation Rental Guest Capacity Trends (2026)
Distribution of Listings by Guest Capacity
Guest Capacity Insights for Lemery
- The most common guest capacity trend in Lemery vacation rentals is listings accommodating 8+ guests (70%). This suggests the primary traveler segment is likely larger groups.
- Properties designed for 8+ guests and 3 guests dominate the Lemery STR market, accounting for 85.0% of listings.
- 80.0% of properties accommodate 6+ guests, serving the market segment for larger families or group travel in Lemery.
- On average, properties in Lemery are equipped to host 6.8 guests.
Lemery Airbnb Booking Patterns (2026): Available vs. Booked Days
Available Days Distribution
Booked Days Distribution
Booking Pattern Insights for Lemery
- The most common availability pattern in Lemery falls within the 271-366 days range, representing 100% of listings. This suggests many properties have significant open periods on their calendars.
- Approximately 100.0% of listings show high availability (181+ days open annually), indicating potential for increased bookings or specific owner usage patterns.
- For booked days, the 1-30 days range is most frequent in Lemery (65%), reflecting common guest stay durations or potential owner blocking patterns.
Lemery Airbnb Minimum Stay Requirements Analysis
Distribution of Listings by Minimum Night Requirement
1 Night
20 listings
100% of total
Key Insights
- The most prevalent minimum stay requirement in Lemery is 1 Night, adopted by 100% of listings. This highlights the market's preference for shorter, flexible bookings.
- A strong majority (100.0%) of the Lemery Airbnb data shows acceptance of very short stays (1-2 nights), indicating a dynamic, high-turnover market.
Recommendations
- Align with the market by considering a 1 Night minimum stay, as 100% of Lemery hosts use this setting.
- Adjust minimum nights based on seasonality – potentially shorter during low season and longer during peak demand periods in Lemery.
Lemery Airbnb Cancellation Policy Trends Analysis (2026)
Super Strict 60 Days
4 listings
20% of total
Flexible
7 listings
35% of total
Moderate
2 listings
10% of total
Firm
3 listings
15% of total
Strict
4 listings
20% of total
Cancellation Policy Insights for Lemery
- The prevailing Airbnb cancellation policy trend in Lemery is Flexible, used by 35% of listings.
- There's a relatively balanced mix between guest-friendly (45.0%) and stricter (35.0%) policies, offering choices for different guest needs.
Recommendations for Hosts
- Consider adopting a Flexible policy to align with the 35% market standard in Lemery.
- Regularly review your cancellation policy against competitors and market demand shifts in Lemery.
Lemery STR Booking Lead Time Analysis (2026)
Average Booking Lead Time by Month
Booking Lead Time Insights for Lemery
- The overall average booking lead time for vacation rentals in Lemery is 33 days.
- Guests book furthest in advance for stays during September (average 56 days), likely coinciding with peak travel demand or local events.
- The shortest booking windows occur for stays in March (average 12 days), indicating more last-minute travel plans during this time.
- Seasonally, Fall (51 days avg.) sees the longest lead times, while Spring (21 days avg.) has the shortest, reflecting typical travel planning cycles.
Recommendations for Hosts
- Use the overall average lead time (33 days) as a baseline for your pricing and availability strategy in Lemery.
- For September stays, consider implementing length-of-stay discounts or slightly higher rates for bookings made less than 56 days out to capitalize on advance planning.
- During March, focus on last-minute booking availability and promotions, as guests book with very short notice (12 days avg.).
- Target marketing efforts for the Fall season well in advance (at least 51 days) to capture early planners.
- Monitor your own booking lead times against these Lemery averages to identify opportunities for dynamic pricing adjustments.
Popular & Essential Airbnb Amenities in Lemery (2026)
Amenity Prevalence
Amenity Insights for Lemery
- Essential amenities in Lemery that guests expect include: Free parking on premises, Air conditioning, Wifi. Lacking these (any) could significantly impact bookings.
- Popular amenities like Refrigerator, Dishes and silverware, TV are common but not universal. Offering these can provide a competitive edge.
Recommendations for Hosts
- Ensure your listing includes all essential amenities for Lemery: Free parking on premises, Air conditioning, Wifi.
- Prioritize adding missing essentials: Air conditioning, Wifi.
- Consider adding popular differentiators like Refrigerator or Dishes and silverware to increase appeal.
- Highlight unique or less common amenities you offer (e.g., hot tub, dedicated workspace, EV charger) in your listing description and photos.
- Regularly check competitor amenities in Lemery to stay competitive.
Lemery Airbnb Guest Demographics & Profile Analysis (2026)
Guest Profile Summary for Lemery
- The typical guest profile for Airbnb in Lemery consists of primarily domestic travelers (93%), often arriving from nearby Manila, typically belonging to the Post-2000s (Gen Z/Alpha) group (50%), primarily speaking English or Filipino.
- Domestic travelers account for 92.6% of guests.
- Key international markets include Philippines (92.6%) and Germany (3.7%).
- Top languages spoken are English (52.4%) followed by Filipino (33.3%).
- A significant demographic segment is the Post-2000s (Gen Z/Alpha) group, representing 50% of guests.
Recommendations for Hosts
- Target domestic marketing efforts towards travelers from Manila and Quezon City.
- Tailor amenities and listing descriptions to appeal to the dominant Post-2000s (Gen Z/Alpha) demographic (e.g., highlight fast WiFi, smart home features, local guides).
- Highlight unique local experiences or amenities relevant to the primary guest profile.
- Consider seasonal promotions aligned with peak travel times for key origin markets.
Nearby Short-Term Rental Market Comparison
How does the Lemery Airbnb market stack up against its neighbors? Compare key performance metrics like average monthly revenue, ADR, and occupancy rates in surrounding areas to understand the broader regional STR landscape.
| Market | Active Properties | Monthly Revenue | Daily Rate | Avg. Occupancy |
|---|---|---|---|---|
| Bustos | 10 | $1,728 | $216.86 | 28% |
| Lian | 121 | $1,491 | $216.20 | 24% |
| Jalajala | 19 | $1,489 | $234.86 | 21% |
| Cabuyao | 25 | $1,202 | $114.93 | 36% |
| Binangonan | 49 | $1,191 | $135.12 | 29% |
| Los Baños | 158 | $1,129 | $242.23 | 21% |
| Busuanga | 52 | $1,094 | $160.44 | 31% |
| Lobo | 38 | $1,063 | $212.49 | 21% |
| Meycauayan | 10 | $1,054 | $142.86 | 24% |
| Alfonso | 189 | $1,049 | $191.29 | 19% |