Mabini Airbnb Market Analysis 2026: Short Term Rental Data & Vacation Rental Statistics in Batangas, Philippines
Is Airbnb profitable in Mabini in 2026? Explore comprehensive Airbnb analytics for Mabini, Batangas, Philippines to uncover income potential. This 2026 STR market report for Mabini, based on AirROI data from February 2025 to January 2026, reveals key trends in the niche market of 118 active listings.
Whether you're considering an Airbnb investment in Mabini, optimizing your existing vacation rental, or exploring rental arbitrage opportunities, understanding the Mabini Airbnb data is crucial. Leveraging the low regulation environment is key to maximizing your short term rental income potential. Let's dive into the specifics.
Key Mabini Airbnb Performance Metrics Overview
Monthly Airbnb Revenue Variations & Income Potential in Mabini (2026)
Understanding the monthly revenue variations for Airbnb listings in Mabini is key to maximizing your short term rental income potential. Seasonality significantly impacts earnings. Our analysis, based on data from the past 12 months, shows that the peak revenue month for STRs in Mabini is typically June, while January often presents the lowest earnings, highlighting opportunities for strategic pricing adjustments during shoulder and low seasons. Explore the typical Airbnb income in Mabini across different performance tiers:
- Best-in-class properties (Top 10%) achieve $2,443+ monthly, often utilizing dynamic pricing and superior guest experiences.
- Strong performing properties (Top 25%) earn $1,246 or more, indicating effective management and desirable locations/amenities.
- Typical properties (Median) generate around $599 per month, representing the average market performance.
- Entry-level properties (Bottom 25%) see earnings around $222, often with potential for optimization.
Average Monthly Airbnb Earnings Trend in Mabini
Mabini Airbnb Occupancy Rate Trends (2026)
Maximize your bookings by understanding the Mabini STR occupancy trends. Seasonal demand shifts significantly influence how often properties are booked. Typically, Junesees the highest demand (peak season occupancy), while September experiences the lowest (low season). Effective strategies, like adjusting minimum stays or offering promotions, can boost occupancy during slower periods. Here's how different property tiers perform in Mabini:
- Best-in-class properties (Top 10%) achieve 55%+ occupancy, indicating high desirability and potentially optimized availability.
- Strong performing properties (Top 25%) maintain 40% or higher occupancy, suggesting good market fit and guest satisfaction.
- Typical properties (Median) have an occupancy rate around 20%.
- Entry-level properties (Bottom 25%) average 9% occupancy, potentially facing higher vacancy.
Average Monthly Occupancy Rate Trend in Mabini
Average Daily Rate (ADR) Airbnb Trends in Mabini (2026)
Effective short term rental pricing strategy in Mabini involves understanding monthly ADR fluctuations. The Average Daily Rate (ADR) for Airbnb in Mabini typically peaks in October and dips lowest during February. Leveraging Airbnb dynamic pricing tools or strategies based on this seasonality can significantly boost revenue. Here's a look at the typical nightly rates achieved:
- Best-in-class properties (Top 10%) command rates of $236+ per night, often due to premium features or locations.
- Strong performing properties (Top 25%) achieve nightly rates of $119 or more.
- Typical properties (Median) charge around $69 per night.
- Entry-level properties (Bottom 25%) earn around $50 per night.
Average Daily Rate (ADR) Trend by Month in Mabini
Get Live Mabini Market Intelligence 👇

Explore Real-time Analytics
Airbnb Seasonality Analysis & Trends in Mabini (2026)
Peak Season (June, March, May)
- Revenue averages $1,262 per month
- Occupancy rates average 29.7%
- Daily rates average $111
Shoulder Season
- Revenue averages $1,038 per month
- Occupancy maintains around 27.0%
- Daily rates hold near $111
Low Season (January, September, November)
- Revenue drops to average $806 per month
- Occupancy decreases to average 21.1%
- Daily rates adjust to average $111
Seasonality Insights for Mabini
- The Airbnb seasonality in Mabini shows moderate seasonality with distinct peak and low periods. While the sections above show seasonal averages, it's also insightful to look at the extremes:
- During the high season, the absolute peak month showcases Mabini's highest earning potential, with monthly revenues capable of climbing to $1,300, occupancy reaching a high of 31.2%, and ADRs peaking at $113.
- Conversely, the slowest single month of the year, typically falling within the low season, marks the market's lowest point. In this month, revenue might dip to $720, occupancy could drop to 19.2%, and ADRs may adjust down to $107.
- Understanding both the seasonal averages and these monthly peaks and troughs in revenue, occupancy, and ADR is crucial for maximizing your Airbnb profit potential in Mabini.
Seasonal Strategies for Maximizing Profit
- Peak Season: Maximize revenue through premium pricing and potentially longer minimum stays. Ensure high availability.
- Low Season: Offer competitive pricing, special promotions (e.g., extended stay discounts), and flexible cancellation policies. Target off-season travelers like remote workers or budget-conscious guests.
- Shoulder Seasons: Implement dynamic pricing that balances peak and low rates. Target weekend travelers or specific events. Offer slightly more flexible terms than peak season.
- Regularly analyze your own performance against these Mabini seasonality benchmarks and adjust your pricing and availability strategy accordingly.
Best Areas for Airbnb Investment in Mabini (2026)
Exploring the top neighborhoods for short-term rentals in Mabini? This section highlights key areas, outlining why they are attractive for hosts and guests, along with notable local attractions. Consider these locations based on your target guest profile and investment strategy.
| Neighborhood / Area | Why Host Here? (Target Guests & Appeal) | Key Attractions & Landmarks |
|---|---|---|
| Anilao | Anilao is a world-renowned diving destination, making it popular among scuba divers and snorkeling enthusiasts. With its stunning coral reefs and vibrant marine life, it attracts tourists looking for underwater adventures. | Anilao Dive Sites, Sepoc Beach, Sombrero Island, Sepoc Island, Sepoc Beach Resort |
| Batangas Bay | Known for its beautiful beaches and serene waters, Batangas Bay offers a variety of water sports and relaxation opportunities. It's a prime spot for families and group travelers. | Batangas Bay Beaches, Island Hopping, Water Sports, Dive Shops, Beach Resorts |
| Laurel Beach | Laurel Beach is becoming increasingly popular for its picturesque views and tranquil environment. It's an ideal spot for those seeking a peaceful getaway. | Laurel Beach, Beachfront Rescued Areas, Relaxation Spots |
| Mabini Beach | Mabini Beach boasts stunning views and a laid-back atmosphere, attracting both local and foreign tourists looking for a beach retreat. | Mabini Beach, Marine Sanctuaries, Water Sports Activities |
| Mt. Arawat | This area offers beautiful hiking trails and panoramic views of Batangas. It's perfect for adventure seekers and nature lovers. | Hiking Trails, View Decks, Wildlife Viewing |
| Nairobian Beach | A hidden gem with fewer crowds, Nairobian Beach offers a more secluded experience for those wanting to escape the busier tourist spots. | Nairobian Beach, Cliffside Views, BBQ Areas |
| Peninsula de Punta Fuego | A premium seaside resort community, known for luxury accommodations and high-end amenities. Attracts affluent vacationers looking for a lavish experience. | Punta Fuego Beach, Club Punta Fuego, Private Beaches, Luxury Villas |
| Sambiray Beach | Sambiray Beach is a lesser-known but stunning area that appeals to travelers looking for a more local experience away from busy tourist spots. | Sambiray Beach, Local Cuisine Stalls, Fishing Activities |
Understanding Airbnb License Requirements & STR Laws in Mabini (2026)
While Mabini, Batangas, Philippines currently shows low STR regulations, specific Airbnb license requirements might still exist or change. Always verify the latest short term rental regulations and Airbnb license requirements directly with local government authorities for Mabini to ensure full compliance before hosting.
(Source: AirROI data, 2026, finding no licensed listings among those analyzed)
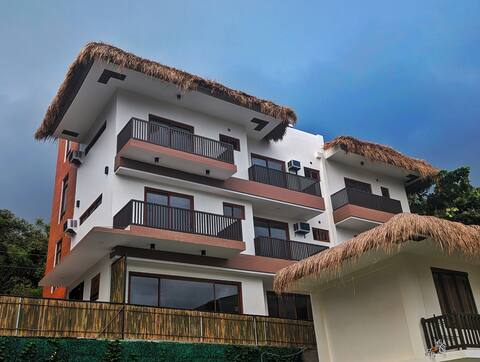
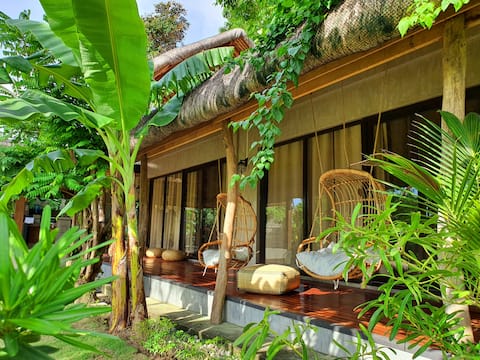
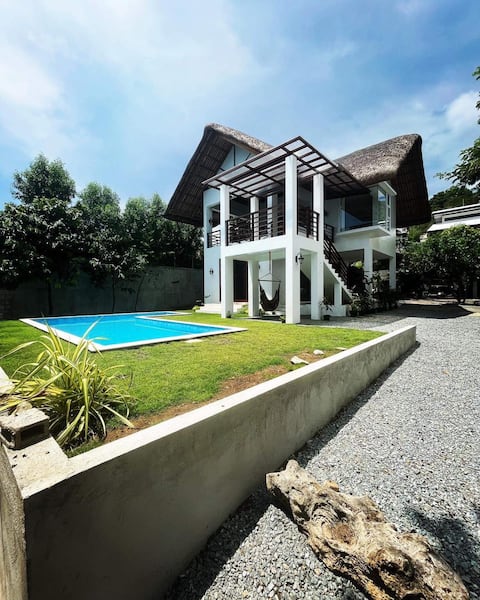
Top Performing Airbnb Properties in Mabini (2026)
Benchmark your potential! Explore examples of top-performing Airbnb properties in Mabinibased on Trailing Twelve Month (TTM) revenue. Analyze their characteristics, revenue, occupancy rate, and ADR to understand what drives success in this market.

Modern private beach front Anilao resort w/pool
Entire Place • 4 bedrooms

Beach-front Home in Mabini Batangas w/ pool
Private Room • 6 bedrooms
The Treehouse at the Asri - Entire home in Mabini
Entire Place • 4 bedrooms
BATALANG BATO- PRIVATE.EXCLUSIVE.MARINE SANCTUARY.
Entire Place • 2 bedrooms
Tatsulok Loft Villa w/Pool
Entire Place • 1 bedroom
Anahaw Marine Beach Retreat
Entire Place • 2 bedrooms
Note: Performance varies based on location, size, amenities, seasonality, and management quality. Data reflects the past 12 months.
Top Performing Airbnb Hosts in Mabini (2026)
Learn from the best! This table showcases top-performing Airbnb hosts in Mabini based on the number of properties managed and estimated total revenue over the past year. Analyze their scale and performance metrics.
| Host Name | Properties | Grossing Revenue | Stay Reviews | Avg Rating |
|---|---|---|---|---|
| Sean | 12 | $112,027 | 885 | 4.85/5.0 |
| Caecilia | 1 | $80,329 | 181 | 4.91/5.0 |
| Riz | 1 | $72,768 | 5 | 4.80/5.0 |
| Xiu | 2 | $59,769 | 429 | 4.89/5.0 |
| Ma Carla Dulce | 3 | $59,228 | 72 | 4.83/5.0 |
| Melissa | 2 | $47,117 | 83 | 4.94/5.0 |
| Magic | 3 | $44,436 | 77 | 4.87/5.0 |
| The Treehouse At The Asri | 1 | $43,235 | 7 | 5.00/5.0 |
| Luxe Finds | 8 | $41,121 | 69 | 4.76/5.0 |
| 태영 | 7 | $36,786 | 487 | 4.75/5.0 |
Analyzing the strategies of top hosts, such as their property selection, pricing, and guest communication, can offer valuable lessons for optimizing your own Airbnb operations in Mabini.
Dive Deeper: Advanced Mabini STR Market Data (2026)
Ready to unlock more insights? AirROI provides access to advanced metrics and comprehensive Airbnb data for Mabini. Explore detailed analytics beyond this report to refine your investment strategy, optimize pricing, and maximize your vacation rental profits.
Explore Advanced MetricsMabini Short-Term Rental Market Composition (2026): Property & Room Types
Room Type Distribution
Property Type Distribution
Market Composition Insights for Mabini
- The Mabini Airbnb market composition is heavily skewed towards Private Room listings, which make up 55.9% of the 118 active rentals. This indicates strong guest preference for privacy and space.
- Looking at the property type distribution in Mabini, Hotel/Boutique properties are the most common (45.8%), reflecting the local real estate landscape.
- Houses represent a significant 33.9% portion, catering likely to families or larger groups.
- The presence of 45.8% Hotel/Boutique listings indicates integration with traditional hospitality.
- Smaller segments like unique stays (combined 1.7%) offer potential for unique stay experiences.
Mabini Airbnb Room Capacity Analysis (2026): Bedroom Distribution
Distribution of Listings by Number of Bedrooms
Room Capacity Insights for Mabini
- The dominant room capacity in Mabini is 1 bedroom listings, making up 46.6% of the market. This suggests a strong demand for properties suitable for couples or solo travelers.
- Together, 1 bedroom and 2 bedrooms properties represent 62.7% of the active Airbnb listings in Mabini, indicating a high concentration in these sizes.
Mabini Vacation Rental Guest Capacity Trends (2026)
Distribution of Listings by Guest Capacity
Guest Capacity Insights for Mabini
- The most common guest capacity trend in Mabini vacation rentals is listings accommodating 2 guests (22%). This suggests the primary traveler segment is likely couples or solo travelers.
- Properties designed for 2 guests and 4 guests dominate the Mabini STR market, accounting for 43.2% of listings.
- 31.3% of properties accommodate 6+ guests, serving the market segment for larger families or group travel in Mabini.
- On average, properties in Mabini are equipped to host 4.2 guests.
Mabini Airbnb Booking Patterns (2026): Available vs. Booked Days
Available Days Distribution
Booked Days Distribution
Booking Pattern Insights for Mabini
- The most common availability pattern in Mabini falls within the 271-366 days range, representing 74.6% of listings. This suggests many properties have significant open periods on their calendars.
- Approximately 96.6% of listings show high availability (181+ days open annually), indicating potential for increased bookings or specific owner usage patterns.
- For booked days, the 1-30 days range is most frequent in Mabini (42.4%), reflecting common guest stay durations or potential owner blocking patterns.
- A notable 4.2% of properties secure long booking periods (181+ days booked per year), highlighting successful long-term rental strategies or significant owner usage.
Mabini Airbnb Minimum Stay Requirements Analysis
Distribution of Listings by Minimum Night Requirement
1 Night
109 listings
92.4% of total
2 Nights
6 listings
5.1% of total
30+ Nights
3 listings
2.5% of total
Key Insights
- The most prevalent minimum stay requirement in Mabini is 1 Night, adopted by 92.4% of listings. This highlights the market's preference for shorter, flexible bookings.
- A strong majority (97.5%) of the Mabini Airbnb data shows acceptance of very short stays (1-2 nights), indicating a dynamic, high-turnover market.
- Dedicated monthly rentals (30+ nights) represent a small niche (2.5%), possibly an untapped area for hosts.
Recommendations
- Align with the market by considering a 1 Night minimum stay, as 92.4% of Mabini hosts use this setting.
- Adjust minimum nights based on seasonality – potentially shorter during low season and longer during peak demand periods in Mabini.
Mabini Airbnb Cancellation Policy Trends Analysis (2026)
Limited
2 listings
1.7% of total
Flexible
19 listings
16.1% of total
Moderate
41 listings
34.7% of total
Firm
53 listings
44.9% of total
Strict
3 listings
2.5% of total
Cancellation Policy Insights for Mabini
- The prevailing Airbnb cancellation policy trend in Mabini is Firm, used by 44.9% of listings.
- There's a relatively balanced mix between guest-friendly (50.8%) and stricter (47.4%) policies, offering choices for different guest needs.
- Strict cancellation policies are quite rare (2.5%), potentially making listings with this policy less competitive unless justified by high demand or property type.
Recommendations for Hosts
- Consider adopting a Firm policy to align with the 44.9% market standard in Mabini.
- Using a Strict policy might deter some guests, as only 2.5% of listings use it. Evaluate if potential revenue protection outweighs possible lower booking rates.
- Regularly review your cancellation policy against competitors and market demand shifts in Mabini.
Mabini STR Booking Lead Time Analysis (2026)
Average Booking Lead Time by Month
Booking Lead Time Insights for Mabini
- The overall average booking lead time for vacation rentals in Mabini is 18 days.
- Guests book furthest in advance for stays during December (average 27 days), likely coinciding with peak travel demand or local events.
- The shortest booking windows occur for stays in September (average 14 days), indicating more last-minute travel plans during this time.
- Seasonally, Winter (25 days avg.) sees the longest lead times, while Fall (19 days avg.) has the shortest, reflecting typical travel planning cycles.
Recommendations for Hosts
- Use the overall average lead time (18 days) as a baseline for your pricing and availability strategy in Mabini.
- Target marketing efforts for the Winter season well in advance (at least 25 days) to capture early planners.
- Monitor your own booking lead times against these Mabini averages to identify opportunities for dynamic pricing adjustments.
Popular & Essential Airbnb Amenities in Mabini (2026)
Amenity Prevalence
Amenity Insights for Mabini
- Essential amenities in Mabini that guests expect include: Air conditioning, Wifi, Beach access. Lacking these (any) could significantly impact bookings.
- Popular amenities like Bed linens, Fire extinguisher, Free parking on premises are common but not universal. Offering these can provide a competitive edge.
Recommendations for Hosts
- Ensure your listing includes all essential amenities for Mabini: Air conditioning, Wifi, Beach access.
- Prioritize adding missing essentials: Air conditioning, Wifi, Beach access.
- Consider adding popular differentiators like Bed linens or Fire extinguisher to increase appeal.
- Highlight unique or less common amenities you offer (e.g., hot tub, dedicated workspace, EV charger) in your listing description and photos.
- Regularly check competitor amenities in Mabini to stay competitive.
Mabini Airbnb Guest Demographics & Profile Analysis (2026)
Guest Profile Summary for Mabini
- The typical guest profile for Airbnb in Mabini consists of primarily domestic travelers (71%), often arriving from nearby Manila, typically belonging to the Post-2000s (Gen Z/Alpha) group (50%), primarily speaking English or Tagalog.
- Domestic travelers account for 71.2% of guests.
- Key international markets include Philippines (71.2%) and United States (8%).
- Top languages spoken are English (50.2%) followed by Tagalog (18.1%).
- A significant demographic segment is the Post-2000s (Gen Z/Alpha) group, representing 50% of guests.
Recommendations for Hosts
- Target domestic marketing efforts towards travelers from Manila and Quezon City.
- Tailor amenities and listing descriptions to appeal to the dominant Post-2000s (Gen Z/Alpha) demographic (e.g., highlight fast WiFi, smart home features, local guides).
- Highlight unique local experiences or amenities relevant to the primary guest profile.
- Consider seasonal promotions aligned with peak travel times for key origin markets.
Nearby Short-Term Rental Market Comparison
How does the Mabini Airbnb market stack up against its neighbors? Compare key performance metrics like average monthly revenue, ADR, and occupancy rates in surrounding areas to understand the broader regional STR landscape.
| Market | Active Properties | Monthly Revenue | Daily Rate | Avg. Occupancy |
|---|---|---|---|---|
| Bustos | 10 | $1,728 | $216.86 | 28% |
| Lian | 121 | $1,491 | $216.20 | 24% |
| Jalajala | 19 | $1,489 | $234.86 | 21% |
| Cabuyao | 25 | $1,202 | $114.93 | 36% |
| Binangonan | 49 | $1,191 | $135.12 | 29% |
| Los Baños | 158 | $1,129 | $242.23 | 21% |
| Busuanga | 52 | $1,094 | $160.44 | 31% |
| Lobo | 38 | $1,063 | $212.49 | 21% |
| Meycauayan | 10 | $1,054 | $142.86 | 24% |
| Alfonso | 189 | $1,049 | $191.29 | 19% |