Nasugbu Airbnb Market Analysis 2026: Short Term Rental Data & Vacation Rental Statistics in Batangas, Philippines
Is Airbnb profitable in Nasugbu in 2026? Explore comprehensive Airbnb analytics for Nasugbu, Batangas, Philippines to uncover income potential. This 2026 STR market report for Nasugbu, based on AirROI data from February 2025 to January 2026, reveals key trends in the market of 529 active listings.
Whether you're considering an Airbnb investment in Nasugbu, optimizing your existing vacation rental, or exploring rental arbitrage opportunities, understanding the Nasugbu Airbnb data is crucial. Leveraging the low regulation environment is key to maximizing your short term rental income potential. Let's dive into the specifics.
Key Nasugbu Airbnb Performance Metrics Overview
Monthly Airbnb Revenue Variations & Income Potential in Nasugbu (2026)
Understanding the monthly revenue variations for Airbnb listings in Nasugbu is key to maximizing your short term rental income potential. Seasonality significantly impacts earnings. Our analysis, based on data from the past 12 months, shows that the peak revenue month for STRs in Nasugbu is typically April, while September often presents the lowest earnings, highlighting opportunities for strategic pricing adjustments during shoulder and low seasons. Explore the typical Airbnb income in Nasugbu across different performance tiers:
- Best-in-class properties (Top 10%) achieve $2,439+ monthly, often utilizing dynamic pricing and superior guest experiences.
- Strong performing properties (Top 25%) earn $1,268 or more, indicating effective management and desirable locations/amenities.
- Typical properties (Median) generate around $666 per month, representing the average market performance.
- Entry-level properties (Bottom 25%) see earnings around $299, often with potential for optimization.
Average Monthly Airbnb Earnings Trend in Nasugbu
Nasugbu Airbnb Occupancy Rate Trends (2026)
Maximize your bookings by understanding the Nasugbu STR occupancy trends. Seasonal demand shifts significantly influence how often properties are booked. Typically, Aprilsees the highest demand (peak season occupancy), while September experiences the lowest (low season). Effective strategies, like adjusting minimum stays or offering promotions, can boost occupancy during slower periods. Here's how different property tiers perform in Nasugbu:
- Best-in-class properties (Top 10%) achieve 47%+ occupancy, indicating high desirability and potentially optimized availability.
- Strong performing properties (Top 25%) maintain 31% or higher occupancy, suggesting good market fit and guest satisfaction.
- Typical properties (Median) have an occupancy rate around 18%.
- Entry-level properties (Bottom 25%) average 9% occupancy, potentially facing higher vacancy.
Average Monthly Occupancy Rate Trend in Nasugbu
Average Daily Rate (ADR) Airbnb Trends in Nasugbu (2026)
Effective short term rental pricing strategy in Nasugbu involves understanding monthly ADR fluctuations. The Average Daily Rate (ADR) for Airbnb in Nasugbu typically peaks in June and dips lowest during September. Leveraging Airbnb dynamic pricing tools or strategies based on this seasonality can significantly boost revenue. Here's a look at the typical nightly rates achieved:
- Best-in-class properties (Top 10%) command rates of $293+ per night, often due to premium features or locations.
- Strong performing properties (Top 25%) achieve nightly rates of $185 or more.
- Typical properties (Median) charge around $111 per night.
- Entry-level properties (Bottom 25%) earn around $80 per night.
Average Daily Rate (ADR) Trend by Month in Nasugbu
Get Live Nasugbu Market Intelligence 👇

Explore Real-time Analytics
Airbnb Seasonality Analysis & Trends in Nasugbu (2026)
Peak Season (April, May, December)
- Revenue averages $1,471 per month
- Occupancy rates average 29.9%
- Daily rates average $154
Shoulder Season
- Revenue averages $1,031 per month
- Occupancy maintains around 21.8%
- Daily rates hold near $154
Low Season (January, September, October)
- Revenue drops to average $789 per month
- Occupancy decreases to average 16.8%
- Daily rates adjust to average $146
Seasonality Insights for Nasugbu
- The Airbnb seasonality in Nasugbu shows moderate seasonality with distinct peak and low periods. While the sections above show seasonal averages, it's also insightful to look at the extremes:
- During the high season, the absolute peak month showcases Nasugbu's highest earning potential, with monthly revenues capable of climbing to $1,533, occupancy reaching a high of 32.3%, and ADRs peaking at $159.
- Conversely, the slowest single month of the year, typically falling within the low season, marks the market's lowest point. In this month, revenue might dip to $777, occupancy could drop to 15.9%, and ADRs may adjust down to $145.
- Understanding both the seasonal averages and these monthly peaks and troughs in revenue, occupancy, and ADR is crucial for maximizing your Airbnb profit potential in Nasugbu.
Seasonal Strategies for Maximizing Profit
- Peak Season: Maximize revenue through premium pricing and potentially longer minimum stays. Ensure high availability.
- Low Season: Offer competitive pricing, special promotions (e.g., extended stay discounts), and flexible cancellation policies. Target off-season travelers like remote workers or budget-conscious guests.
- Shoulder Seasons: Implement dynamic pricing that balances peak and low rates. Target weekend travelers or specific events. Offer slightly more flexible terms than peak season.
- Regularly analyze your own performance against these Nasugbu seasonality benchmarks and adjust your pricing and availability strategy accordingly.
Best Areas for Airbnb Investment in Nasugbu (2026)
Exploring the top neighborhoods for short-term rentals in Nasugbu? This section highlights key areas, outlining why they are attractive for hosts and guests, along with notable local attractions. Consider these locations based on your target guest profile and investment strategy.
| Neighborhood / Area | Why Host Here? (Target Guests & Appeal) | Key Attractions & Landmarks |
|---|---|---|
| Nasugbu Beachfront | The main area for beach lovers, known for its pristine beaches and clear waters. Perfect for tourists looking for beachfront accommodations and water activities. | Nasugbu Beach, Munting Buhangin Beach Resort, Calumpang Beach, Terrazas de Punta Fuego, Santelmo Beach |
| Punta Fuego | An exclusive beach resort area known for its luxury villas and tranquil environment. Ideal for travelers seeking a high-end getaway with easy access to water sports and relaxation. | Punta Fuego Beach Club, Aquario Beach, Kayaking and diving activities, Punta Fuego Golf Course |
| Bonito Island | A small, pristine beach area that is perfect for those looking to escape the crowds. Offers nature-based attractions and a serene atmosphere. | Bonito Island Beach, Snorkeling and diving spots, Hidden lagoons and rock formations |
| Tagaytay | Near Nasugbu, Tagaytay offers a cooler climate and stunning views of Taal Volcano. This area attracts both travelers and locals looking for a quick escape from the heat. | Taal Lake, People's Park in the Sky, Sky Ranch Tagaytay, Taal Vista Hotel |
| Buhay na Tubig | A quieter area known for its stunning natural scenery and relaxed vibe. Attracts tourists interested in eco-tourism and nature exploration. | Buhay na Tubig Beach, Hiking trails, Nature reserves |
| Marv's Beach House | A popular choice for family gatherings and events, offering comfortable accommodations with beachfront access. Great for larger groups looking to enjoy the beach. | Private beach area, BBQ facilities, Water activities |
| Calayo | A lesser-known gem with beautiful beaches and a laid-back atmosphere. Attracts couples and families seeking affordable lodging and local culture. | Calayo Beach, Local eateries, Fishing activities |
| Laiya | Although slightly farther, Laiya is known for its long stretches of white sand beaches and numerous resorts, making it popular for weekend getaways. | Laiya Beach, Beach resorts, Water sports activities |
Understanding Airbnb License Requirements & STR Laws in Nasugbu (2026)
While Nasugbu, Batangas, Philippines currently shows low STR regulations, specific Airbnb license requirements might still exist or change. Always verify the latest short term rental regulations and Airbnb license requirements directly with local government authorities for Nasugbu to ensure full compliance before hosting.
(Source: AirROI data, 2026, finding no licensed listings among those analyzed)
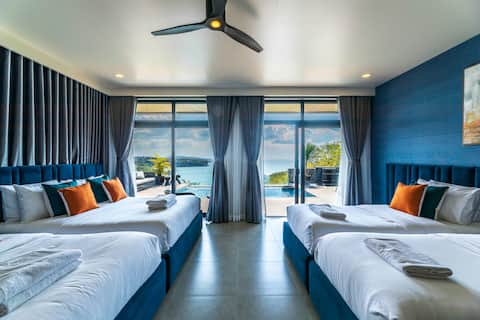
Top Performing Airbnb Properties in Nasugbu (2026)
Benchmark your potential! Explore examples of top-performing Airbnb properties in Nasugbubased on Trailing Twelve Month (TTM) revenue. Analyze their characteristics, revenue, occupancy rate, and ADR to understand what drives success in this market.
One Amalfi Nasugbu (cliffside, breathtaking view)
Entire Place • 4 bedrooms

Cliff House Nasugbu
Entire Place • 4 bedrooms

Angelscove Maya Beach House Villa Batangas
Entire Place • 8 bedrooms
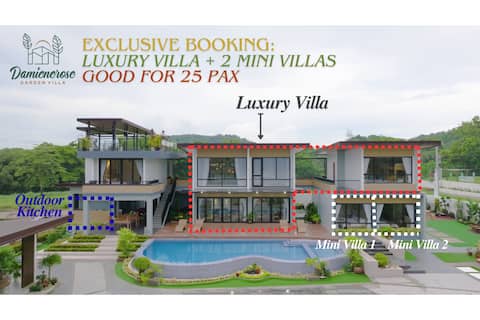
Damienerose Garden Villa Exclusive
Entire Place • 4 bedrooms
16 persons 4-bedroom 4-tnb at Pico Beach & Pools
Entire Place • 4 bedrooms

Ultimate getaway 3-bedroom resort unit in Batangas
Entire Place • 3 bedrooms
Note: Performance varies based on location, size, amenities, seasonality, and management quality. Data reflects the past 12 months.
Top Performing Airbnb Hosts in Nasugbu (2026)
Learn from the best! This table showcases top-performing Airbnb hosts in Nasugbu based on the number of properties managed and estimated total revenue over the past year. Analyze their scale and performance metrics.
| Host Name | Properties | Grossing Revenue | Stay Reviews | Avg Rating |
|---|---|---|---|---|
| Audrey | 40 | $218,467 | 431 | 4.74/5.0 |
| Joann | 40 | $186,037 | 475 | 4.68/5.0 |
| Raquel Joy | 25 | $146,302 | 667 | 4.69/5.0 |
| Tes | 4 | $140,487 | 224 | 4.97/5.0 |
| Lorie Oriondo | 3 | $130,516 | 26 | 4.84/5.0 |
| Joshua | 5 | $115,368 | 124 | 4.39/5.0 |
| Hazel | 1 | $114,495 | 75 | 4.97/5.0 |
| Au | 6 | $106,536 | 534 | 4.42/5.0 |
| Cliff House Nasugbu Batangas | 1 | $101,961 | 55 | 4.80/5.0 |
| Julie | 13 | $101,699 | 828 | 4.84/5.0 |
Analyzing the strategies of top hosts, such as their property selection, pricing, and guest communication, can offer valuable lessons for optimizing your own Airbnb operations in Nasugbu.
Dive Deeper: Advanced Nasugbu STR Market Data (2026)
Ready to unlock more insights? AirROI provides access to advanced metrics and comprehensive Airbnb data for Nasugbu. Explore detailed analytics beyond this report to refine your investment strategy, optimize pricing, and maximize your vacation rental profits.
Explore Advanced MetricsNasugbu Short-Term Rental Market Composition (2026): Property & Room Types
Room Type Distribution
Property Type Distribution
Market Composition Insights for Nasugbu
- The Nasugbu Airbnb market composition is heavily skewed towards Entire Home/Apt listings, which make up 90.4% of the 529 active rentals. This indicates strong guest preference for privacy and space.
- Looking at the property type distribution in Nasugbu, Apartment/Condo properties are the most common (71.6%), reflecting the local real estate landscape.
- Houses represent a significant 17.6% portion, catering likely to families or larger groups.
- The presence of 6% Hotel/Boutique listings indicates integration with traditional hospitality.
- Smaller segments like outdoor/unique, others, unique stays (combined 4.7%) offer potential for unique stay experiences.
Nasugbu Airbnb Room Capacity Analysis (2026): Bedroom Distribution
Distribution of Listings by Number of Bedrooms
Room Capacity Insights for Nasugbu
- The dominant room capacity in Nasugbu is 1 bedroom listings, making up 46.9% of the market. This suggests a strong demand for properties suitable for couples or solo travelers.
- Together, 1 bedroom and 2 bedrooms properties represent 73.6% of the active Airbnb listings in Nasugbu, indicating a high concentration in these sizes.
Nasugbu Vacation Rental Guest Capacity Trends (2026)
Distribution of Listings by Guest Capacity
Guest Capacity Insights for Nasugbu
- The most common guest capacity trend in Nasugbu vacation rentals is listings accommodating 8+ guests (41.2%). This suggests the primary traveler segment is likely larger groups.
- Properties designed for 8+ guests and 6 guests dominate the Nasugbu STR market, accounting for 65.0% of listings.
- 66.3% of properties accommodate 6+ guests, serving the market segment for larger families or group travel in Nasugbu.
- On average, properties in Nasugbu are equipped to host 6.1 guests.
Nasugbu Airbnb Booking Patterns (2026): Available vs. Booked Days
Available Days Distribution
Booked Days Distribution
Booking Pattern Insights for Nasugbu
- The most common availability pattern in Nasugbu falls within the 271-366 days range, representing 80% of listings. This suggests many properties have significant open periods on their calendars.
- Approximately 97.6% of listings show high availability (181+ days open annually), indicating potential for increased bookings or specific owner usage patterns.
- For booked days, the 1-30 days range is most frequent in Nasugbu (40.3%), reflecting common guest stay durations or potential owner blocking patterns.
- A notable 3.0% of properties secure long booking periods (181+ days booked per year), highlighting successful long-term rental strategies or significant owner usage.
Nasugbu Airbnb Minimum Stay Requirements Analysis
Distribution of Listings by Minimum Night Requirement
1 Night
506 listings
95.7% of total
2 Nights
10 listings
1.9% of total
7-29 Nights
1 listings
0.2% of total
30+ Nights
12 listings
2.3% of total
Key Insights
- The most prevalent minimum stay requirement in Nasugbu is 1 Night, adopted by 95.7% of listings. This highlights the market's preference for shorter, flexible bookings.
- A strong majority (97.6%) of the Nasugbu Airbnb data shows acceptance of very short stays (1-2 nights), indicating a dynamic, high-turnover market.
- Dedicated monthly rentals (30+ nights) represent a small niche (2.3%), possibly an untapped area for hosts.
Recommendations
- Align with the market by considering a 1 Night minimum stay, as 95.7% of Nasugbu hosts use this setting.
- Adjust minimum nights based on seasonality – potentially shorter during low season and longer during peak demand periods in Nasugbu.
Nasugbu Airbnb Cancellation Policy Trends Analysis (2026)
Super Strict 30 Days
3 listings
0.6% of total
Limited
23 listings
4.3% of total
Flexible
69 listings
13% of total
Moderate
168 listings
31.8% of total
Firm
186 listings
35.2% of total
Strict
80 listings
15.1% of total
Cancellation Policy Insights for Nasugbu
- The prevailing Airbnb cancellation policy trend in Nasugbu is Firm, used by 35.2% of listings.
- A majority (50.3%) of hosts in Nasugbu utilize Firm or Strict policies, indicating a market where hosts prioritize booking security.
Recommendations for Hosts
- Consider adopting a Firm policy to align with the 35.2% market standard in Nasugbu.
- Regularly review your cancellation policy against competitors and market demand shifts in Nasugbu.
Nasugbu STR Booking Lead Time Analysis (2026)
Average Booking Lead Time by Month
Booking Lead Time Insights for Nasugbu
- The overall average booking lead time for vacation rentals in Nasugbu is 25 days.
- Guests book furthest in advance for stays during November (average 40 days), likely coinciding with peak travel demand or local events.
- The shortest booking windows occur for stays in March (average 18 days), indicating more last-minute travel plans during this time.
- Seasonally, Fall (30 days avg.) sees the longest lead times, while Summer (22 days avg.) has the shortest, reflecting typical travel planning cycles.
Recommendations for Hosts
- Use the overall average lead time (25 days) as a baseline for your pricing and availability strategy in Nasugbu.
- For November stays, consider implementing length-of-stay discounts or slightly higher rates for bookings made less than 40 days out to capitalize on advance planning.
- Target marketing efforts for the Fall season well in advance (at least 30 days) to capture early planners.
- Monitor your own booking lead times against these Nasugbu averages to identify opportunities for dynamic pricing adjustments.
Popular & Essential Airbnb Amenities in Nasugbu (2026)
Amenity Prevalence
Amenity Insights for Nasugbu
- Essential amenities in Nasugbu that guests expect include: Air conditioning, Kitchen. Lacking these (any) could significantly impact bookings.
- Popular amenities like Free parking on premises, TV, Wifi are common but not universal. Offering these can provide a competitive edge.
- A pool is a highly desired but not standard amenity, making it a key feature for attracting guests seeking leisure in Nasugbu.
- Warning: Wifi is not universally provided but is considered essential globally. Ensure reliable Wifi is offered.
Recommendations for Hosts
- Ensure your listing includes all essential amenities for Nasugbu: Air conditioning, Kitchen.
- Prioritize adding missing essentials: Air conditioning, Kitchen.
- Consider adding popular differentiators like Free parking on premises or TV to increase appeal.
- Highlight unique or less common amenities you offer (e.g., hot tub, dedicated workspace, EV charger) in your listing description and photos.
- Regularly check competitor amenities in Nasugbu to stay competitive.
Nasugbu Airbnb Guest Demographics & Profile Analysis (2026)
Guest Profile Summary for Nasugbu
- The typical guest profile for Airbnb in Nasugbu consists of primarily domestic travelers (86%), often arriving from nearby Manila, typically belonging to the Post-2000s (Gen Z/Alpha) group (50%), primarily speaking English or Tagalog.
- Domestic travelers account for 85.8% of guests.
- Key international markets include Philippines (85.8%) and United States (5.3%).
- Top languages spoken are English (53.3%) followed by Tagalog (24.7%).
- A significant demographic segment is the Post-2000s (Gen Z/Alpha) group, representing 50% of guests.
Recommendations for Hosts
- Target domestic marketing efforts towards travelers from Manila and Quezon City.
- Tailor amenities and listing descriptions to appeal to the dominant Post-2000s (Gen Z/Alpha) demographic (e.g., highlight fast WiFi, smart home features, local guides).
- Highlight unique local experiences or amenities relevant to the primary guest profile.
- Consider seasonal promotions aligned with peak travel times for key origin markets.
Nearby Short-Term Rental Market Comparison
How does the Nasugbu Airbnb market stack up against its neighbors? Compare key performance metrics like average monthly revenue, ADR, and occupancy rates in surrounding areas to understand the broader regional STR landscape.
| Market | Active Properties | Monthly Revenue | Daily Rate | Avg. Occupancy |
|---|---|---|---|---|
| Bustos | 10 | $1,728 | $216.86 | 28% |
| Cabangan | 44 | $1,529 | $200.94 | 26% |
| Lian | 121 | $1,491 | $216.20 | 24% |
| Jalajala | 19 | $1,489 | $234.86 | 21% |
| Laoag | 17 | $1,412 | $158.39 | 33% |
| Beneg | 13 | $1,304 | $267.34 | 22% |
| Arew | 11 | $1,288 | $193.81 | 22% |
| Cabuyao | 25 | $1,202 | $114.93 | 36% |
| Binangonan | 49 | $1,191 | $135.12 | 29% |
| Porac | 51 | $1,157 | $203.91 | 21% |