Malolos Airbnb Market Analysis 2026: Short Term Rental Data & Vacation Rental Statistics in Bulacan, Philippines
Is Airbnb profitable in Malolos in 2026? Explore comprehensive Airbnb analytics for Malolos, Bulacan, Philippines to uncover income potential. This 2026 STR market report for Malolos, based on AirROI data from February 2025 to January 2026, reveals key trends in the niche market of 83 active listings.
Whether you're considering an Airbnb investment in Malolos, optimizing your existing vacation rental, or exploring rental arbitrage opportunities, understanding the Malolos Airbnb data is crucial. Leveraging the low regulation environment is key to maximizing your short term rental income potential. Let's dive into the specifics.
Key Malolos Airbnb Performance Metrics Overview
Monthly Airbnb Revenue Variations & Income Potential in Malolos (2026)
Understanding the monthly revenue variations for Airbnb listings in Malolos is key to maximizing your short term rental income potential. Seasonality significantly impacts earnings. Our analysis, based on data from the past 12 months, shows that the peak revenue month for STRs in Malolos is typically December, while July often presents the lowest earnings, highlighting opportunities for strategic pricing adjustments during shoulder and low seasons. Explore the typical Airbnb income in Malolos across different performance tiers:
- Best-in-class properties (Top 10%) achieve $968+ monthly, often utilizing dynamic pricing and superior guest experiences.
- Strong performing properties (Top 25%) earn $492 or more, indicating effective management and desirable locations/amenities.
- Typical properties (Median) generate around $242 per month, representing the average market performance.
- Entry-level properties (Bottom 25%) see earnings around $110, often with potential for optimization.
Average Monthly Airbnb Earnings Trend in Malolos
Malolos Airbnb Occupancy Rate Trends (2026)
Maximize your bookings by understanding the Malolos STR occupancy trends. Seasonal demand shifts significantly influence how often properties are booked. Typically, Augustsees the highest demand (peak season occupancy), while November experiences the lowest (low season). Effective strategies, like adjusting minimum stays or offering promotions, can boost occupancy during slower periods. Here's how different property tiers perform in Malolos:
- Best-in-class properties (Top 10%) achieve 53%+ occupancy, indicating high desirability and potentially optimized availability.
- Strong performing properties (Top 25%) maintain 32% or higher occupancy, suggesting good market fit and guest satisfaction.
- Typical properties (Median) have an occupancy rate around 16%.
- Entry-level properties (Bottom 25%) average 8% occupancy, potentially facing higher vacancy.
Average Monthly Occupancy Rate Trend in Malolos
Average Daily Rate (ADR) Airbnb Trends in Malolos (2026)
Effective short term rental pricing strategy in Malolos involves understanding monthly ADR fluctuations. The Average Daily Rate (ADR) for Airbnb in Malolos typically peaks in September and dips lowest during April. Leveraging Airbnb dynamic pricing tools or strategies based on this seasonality can significantly boost revenue. Here's a look at the typical nightly rates achieved:
- Best-in-class properties (Top 10%) command rates of $130+ per night, often due to premium features or locations.
- Strong performing properties (Top 25%) achieve nightly rates of $86 or more.
- Typical properties (Median) charge around $38 per night.
- Entry-level properties (Bottom 25%) earn around $29 per night.
Average Daily Rate (ADR) Trend by Month in Malolos
Get Live Malolos Market Intelligence 👇

Explore Real-time Analytics
Airbnb Seasonality Analysis & Trends in Malolos (2026)
Peak Season (December, August, May)
- Revenue averages $537 per month
- Occupancy rates average 25.4%
- Daily rates average $73
Shoulder Season
- Revenue averages $439 per month
- Occupancy maintains around 23.3%
- Daily rates hold near $72
Low Season (July, October, November)
- Revenue drops to average $341 per month
- Occupancy decreases to average 20.4%
- Daily rates adjust to average $74
Seasonality Insights for Malolos
- The Airbnb seasonality in Malolos shows moderate seasonality with distinct peak and low periods. While the sections above show seasonal averages, it's also insightful to look at the extremes:
- During the high season, the absolute peak month showcases Malolos's highest earning potential, with monthly revenues capable of climbing to $611, occupancy reaching a high of 29.3%, and ADRs peaking at $75.
- Conversely, the slowest single month of the year, typically falling within the low season, marks the market's lowest point. In this month, revenue might dip to $333, occupancy could drop to 19.4%, and ADRs may adjust down to $70.
- Understanding both the seasonal averages and these monthly peaks and troughs in revenue, occupancy, and ADR is crucial for maximizing your Airbnb profit potential in Malolos.
Seasonal Strategies for Maximizing Profit
- Peak Season: Maximize revenue through premium pricing and potentially longer minimum stays. Ensure high availability.
- Low Season: Offer competitive pricing, special promotions (e.g., extended stay discounts), and flexible cancellation policies. Target off-season travelers like remote workers or budget-conscious guests.
- Shoulder Seasons: Implement dynamic pricing that balances peak and low rates. Target weekend travelers or specific events. Offer slightly more flexible terms than peak season.
- Regularly analyze your own performance against these Malolos seasonality benchmarks and adjust your pricing and availability strategy accordingly.
Best Areas for Airbnb Investment in Malolos (2026)
Exploring the top neighborhoods for short-term rentals in Malolos? This section highlights key areas, outlining why they are attractive for hosts and guests, along with notable local attractions. Consider these locations based on your target guest profile and investment strategy.
| Neighborhood / Area | Why Host Here? (Target Guests & Appeal) | Key Attractions & Landmarks |
|---|---|---|
| Malolos City Proper | The bustling center of Malolos, offering various amenities, restaurants, and easy access to historical sites. Ideal for travelers seeking urban convenience and local experiences. | Barasoain Church, Malolos Museum, Bulacan Capitol Building, Cafe at the Park, NLEX for easy travel access |
| Pulilan | Famous for the Carabao Festival and scenic views, Pulilan attracts tourists looking for culture and heritage experiences. It's a great spot for unique stays away from the urban hustle. | Carabao Festival, Santuario de San Vicente, Pulilan Church, Miyamit Falls, local eateries |
| Bustos | Known for its agricultural landscape, Bustos offers a serene environment for travelers wanting a peaceful retreat while still being connected to urban Malolos. | Bustos Dam, The riverbanks for relaxation, local farms, Sunset viewing spots, agri-tourism spots |
| Balagtas | A growing town with a mix of industrial and rural settings, Balagtas is perfect for those looking for budget-friendly options and nearby attractions. | Balagtas Church, local markets, food stalls, rural landscapes, easy access to Manila |
| Plaridel | A strategic town close to the airport and Manila, Plaridel caters to business travelers and visitors needing a convenient location for quick travels. | Plaridel Airport, local shopping centers, riverside parks, historical sites, restaurants |
| Guiguinto | Known for its flower farms, Guiguinto is attractive to those looking to experience the local culture and beautiful landscapes of Bulacan. | Flower farms, local festivals, Guiguinto Church, Malolos River, community events |
| Hagonoy | A coastal town with a rich fishing tradition, Hagonoy offers a unique waterfront experience and seafood delights for guests. | Hagonoy Fish Port, river cruises, local seafood markets, beachfront views, Hagonoy Church |
| Bocaue | Home to the famous Bocaue River and local festivals, Bocaue has traditional culture and is perfect for families and cultural tourists. | Bocaue River, Bocaue Church, local parades, festivals, recreational parks |
Understanding Airbnb License Requirements & STR Laws in Malolos (2026)
While Malolos, Bulacan, Philippines currently shows low STR regulations, specific Airbnb license requirements might still exist or change. Always verify the latest short term rental regulations and Airbnb license requirements directly with local government authorities for Malolos to ensure full compliance before hosting.
(Source: AirROI data, 2026, finding no licensed listings among those analyzed)
Top Performing Airbnb Properties in Malolos (2026)
Benchmark your potential! Explore examples of top-performing Airbnb properties in Malolosbased on Trailing Twelve Month (TTM) revenue. Analyze their characteristics, revenue, occupancy rate, and ADR to understand what drives success in this market.

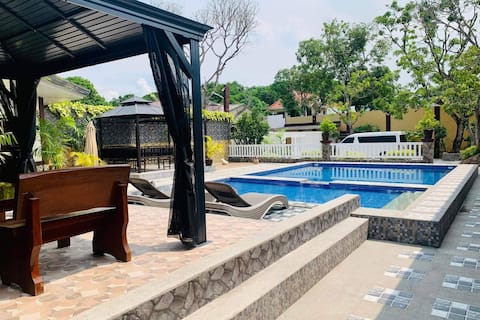
Family Villas
Entire Place • 3 bedrooms

Casa Cytriz - Cozy home w/mini pool in Bulacan
Entire Place • 1 bedroom

La Bella Vita Resort & Spa
Entire Place • 4 bedrooms
Villa Alfonso Bulacan Resort
Entire Place • 2 bedrooms
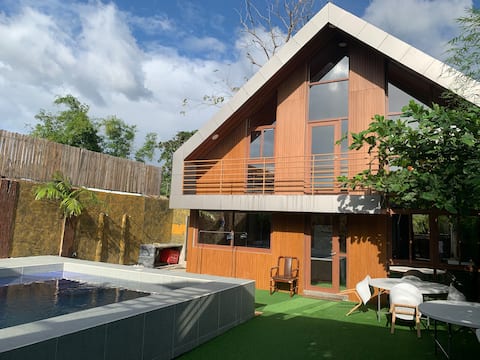
Backyard Cabin
Entire Place • N/A

3BR w/ Movie Room | Casa Bella Provence Malolos
Entire Place • 3 bedrooms
Note: Performance varies based on location, size, amenities, seasonality, and management quality. Data reflects the past 12 months.
Top Performing Airbnb Hosts in Malolos (2026)
Learn from the best! This table showcases top-performing Airbnb hosts in Malolos based on the number of properties managed and estimated total revenue over the past year. Analyze their scale and performance metrics.
| Host Name | Properties | Grossing Revenue | Stay Reviews | Avg Rating |
|---|---|---|---|---|
| Patrick Roniel | 1 | $37,865 | 27 | 4.89/5.0 |
| Raya | 13 | $34,237 | 101 | 4.77/5.0 |
| Mariebeth | 1 | $18,254 | 70 | 4.84/5.0 |
| Michelle | 1 | $14,889 | 12 | 4.92/5.0 |
| Jovelle | 1 | $12,888 | 4 | 5.00/5.0 |
| Ron Daniel | 1 | $10,462 | 14 | 4.50/5.0 |
| Rommel Luz And JannieRose | 4 | $9,911 | 334 | 4.95/5.0 |
| Jay | 3 | $9,865 | 28 | 4.76/5.0 |
| Kim | 1 | $9,623 | 7 | 4.57/5.0 |
| Katherine | 1 | $9,259 | 43 | 4.86/5.0 |
Analyzing the strategies of top hosts, such as their property selection, pricing, and guest communication, can offer valuable lessons for optimizing your own Airbnb operations in Malolos.
Dive Deeper: Advanced Malolos STR Market Data (2026)
Ready to unlock more insights? AirROI provides access to advanced metrics and comprehensive Airbnb data for Malolos. Explore detailed analytics beyond this report to refine your investment strategy, optimize pricing, and maximize your vacation rental profits.
Explore Advanced MetricsMalolos Short-Term Rental Market Composition (2026): Property & Room Types
Room Type Distribution
Property Type Distribution
Market Composition Insights for Malolos
- The Malolos Airbnb market composition is heavily skewed towards Entire Home/Apt listings, which make up 66.3% of the 83 active rentals. This indicates strong guest preference for privacy and space.
- However, a notable 33.7% share for Private Rooms suggests opportunities for budget-conscious travelers or hosts renting out spare rooms.
- Looking at the property type distribution in Malolos, House properties are the most common (51.8%), reflecting the local real estate landscape.
- Houses represent a significant 51.8% portion, catering likely to families or larger groups.
- The presence of 12% Hotel/Boutique listings indicates integration with traditional hospitality.
- Smaller segments like outdoor/unique, others (combined 4.8%) offer potential for unique stay experiences.
Malolos Airbnb Room Capacity Analysis (2026): Bedroom Distribution
Distribution of Listings by Number of Bedrooms
Room Capacity Insights for Malolos
- The dominant room capacity in Malolos is 1 bedroom listings, making up 49.4% of the market. This suggests a strong demand for properties suitable for couples or solo travelers.
- Together, 1 bedroom and 2 bedrooms properties represent 65.1% of the active Airbnb listings in Malolos, indicating a high concentration in these sizes.
Malolos Vacation Rental Guest Capacity Trends (2026)
Distribution of Listings by Guest Capacity
Guest Capacity Insights for Malolos
- The most common guest capacity trend in Malolos vacation rentals is listings accommodating 4 guests (30.1%). This suggests the primary traveler segment is likely small families or groups.
- Properties designed for 4 guests and 2 guests dominate the Malolos STR market, accounting for 47.0% of listings.
- 25.3% of properties accommodate 6+ guests, serving the market segment for larger families or group travel in Malolos.
- On average, properties in Malolos are equipped to host 3.8 guests.
Malolos Airbnb Booking Patterns (2026): Available vs. Booked Days
Available Days Distribution
Booked Days Distribution
Booking Pattern Insights for Malolos
- The most common availability pattern in Malolos falls within the 271-366 days range, representing 80.7% of listings. This suggests many properties have significant open periods on their calendars.
- Approximately 97.6% of listings show high availability (181+ days open annually), indicating potential for increased bookings or specific owner usage patterns.
- For booked days, the 1-30 days range is most frequent in Malolos (47%), reflecting common guest stay durations or potential owner blocking patterns.
- A notable 2.4% of properties secure long booking periods (181+ days booked per year), highlighting successful long-term rental strategies or significant owner usage.
Malolos Airbnb Minimum Stay Requirements Analysis
Distribution of Listings by Minimum Night Requirement
1 Night
77 listings
92.8% of total
2 Nights
4 listings
4.8% of total
30+ Nights
2 listings
2.4% of total
Key Insights
- The most prevalent minimum stay requirement in Malolos is 1 Night, adopted by 92.8% of listings. This highlights the market's preference for shorter, flexible bookings.
- A strong majority (97.6%) of the Malolos Airbnb data shows acceptance of very short stays (1-2 nights), indicating a dynamic, high-turnover market.
- Dedicated monthly rentals (30+ nights) represent a small niche (2.4%), possibly an untapped area for hosts.
Recommendations
- Align with the market by considering a 1 Night minimum stay, as 92.8% of Malolos hosts use this setting.
- Adjust minimum nights based on seasonality – potentially shorter during low season and longer during peak demand periods in Malolos.
Malolos Airbnb Cancellation Policy Trends Analysis (2026)
Flexible
21 listings
25.3% of total
Moderate
16 listings
19.3% of total
Firm
38 listings
45.8% of total
Strict
8 listings
9.6% of total
Cancellation Policy Insights for Malolos
- The prevailing Airbnb cancellation policy trend in Malolos is Firm, used by 45.8% of listings.
- A majority (55.4%) of hosts in Malolos utilize Firm or Strict policies, indicating a market where hosts prioritize booking security.
- Strict cancellation policies are quite rare (9.6%), potentially making listings with this policy less competitive unless justified by high demand or property type.
Recommendations for Hosts
- Consider adopting a Firm policy to align with the 45.8% market standard in Malolos.
- Using a Strict policy might deter some guests, as only 9.6% of listings use it. Evaluate if potential revenue protection outweighs possible lower booking rates.
- Regularly review your cancellation policy against competitors and market demand shifts in Malolos.
Malolos STR Booking Lead Time Analysis (2026)
Average Booking Lead Time by Month
Booking Lead Time Insights for Malolos
- The overall average booking lead time for vacation rentals in Malolos is 35 days.
- Guests book furthest in advance for stays during November (average 61 days), likely coinciding with peak travel demand or local events.
- The shortest booking windows occur for stays in April (average 17 days), indicating more last-minute travel plans during this time.
- Seasonally, Fall (40 days avg.) sees the longest lead times, while Summer (26 days avg.) has the shortest, reflecting typical travel planning cycles.
Recommendations for Hosts
- Use the overall average lead time (35 days) as a baseline for your pricing and availability strategy in Malolos.
- For November stays, consider implementing length-of-stay discounts or slightly higher rates for bookings made less than 61 days out to capitalize on advance planning.
- Target marketing efforts for the Fall season well in advance (at least 40 days) to capture early planners.
- Monitor your own booking lead times against these Malolos averages to identify opportunities for dynamic pricing adjustments.
Popular & Essential Airbnb Amenities in Malolos (2026)
Amenity Prevalence
Amenity Insights for Malolos
- Essential amenities in Malolos that guests expect include: Air conditioning, Wifi, Free parking on premises. Lacking these (any) could significantly impact bookings.
- Popular amenities like TV, Dishes and silverware, Bed linens are common but not universal. Offering these can provide a competitive edge.
Recommendations for Hosts
- Ensure your listing includes all essential amenities for Malolos: Air conditioning, Wifi, Free parking on premises.
- Prioritize adding missing essentials: Wifi, Free parking on premises.
- Consider adding popular differentiators like TV or Dishes and silverware to increase appeal.
- Highlight unique or less common amenities you offer (e.g., hot tub, dedicated workspace, EV charger) in your listing description and photos.
- Regularly check competitor amenities in Malolos to stay competitive.
Malolos Airbnb Guest Demographics & Profile Analysis (2026)
Guest Profile Summary for Malolos
- The typical guest profile for Airbnb in Malolos consists of primarily domestic travelers (79%), often arriving from nearby Malolos, typically belonging to the Post-2000s (Gen Z/Alpha) group (50%), primarily speaking English or Filipino.
- Domestic travelers account for 78.5% of guests.
- Key international markets include Philippines (78.5%) and Canada (6.2%).
- Top languages spoken are English (50.7%) followed by Filipino (23.5%).
- A significant demographic segment is the Post-2000s (Gen Z/Alpha) group, representing 50% of guests.
Recommendations for Hosts
- Target domestic marketing efforts towards travelers from Malolos and Manila.
- Tailor amenities and listing descriptions to appeal to the dominant Post-2000s (Gen Z/Alpha) demographic (e.g., highlight fast WiFi, smart home features, local guides).
- Highlight unique local experiences or amenities relevant to the primary guest profile.
- Consider seasonal promotions aligned with peak travel times for key origin markets.
Nearby Short-Term Rental Market Comparison
How does the Malolos Airbnb market stack up against its neighbors? Compare key performance metrics like average monthly revenue, ADR, and occupancy rates in surrounding areas to understand the broader regional STR landscape.
| Market | Active Properties | Monthly Revenue | Daily Rate | Avg. Occupancy |
|---|---|---|---|---|
| Bustos | 10 | $1,728 | $216.86 | 28% |
| Cabangan | 44 | $1,529 | $200.94 | 26% |
| Lian | 121 | $1,491 | $216.20 | 24% |
| Jalajala | 19 | $1,489 | $234.86 | 21% |
| Laoag | 17 | $1,412 | $158.39 | 33% |
| Beneg | 13 | $1,304 | $267.34 | 22% |
| Arew | 11 | $1,288 | $193.81 | 22% |
| Cabuyao | 25 | $1,202 | $114.93 | 36% |
| Binangonan | 49 | $1,191 | $135.12 | 29% |
| Porac | 51 | $1,157 | $203.91 | 21% |