Marilao Airbnb Market Analysis 2026: Short Term Rental Data & Vacation Rental Statistics in Bulacan, Philippines
Is Airbnb profitable in Marilao in 2026? Explore comprehensive Airbnb analytics for Marilao, Bulacan, Philippines to uncover income potential. This 2026 STR market report for Marilao, based on AirROI data from February 2025 to January 2026, reveals key trends in the niche market of 173 active listings.
Whether you're considering an Airbnb investment in Marilao, optimizing your existing vacation rental, or exploring rental arbitrage opportunities, understanding the Marilao Airbnb data is crucial. Leveraging the low regulation environment is key to maximizing your short term rental income potential. Let's dive into the specifics.
Key Marilao Airbnb Performance Metrics Overview
Monthly Airbnb Revenue Variations & Income Potential in Marilao (2026)
Understanding the monthly revenue variations for Airbnb listings in Marilao is key to maximizing your short term rental income potential. Seasonality significantly impacts earnings. Our analysis, based on data from the past 12 months, shows that the peak revenue month for STRs in Marilao is typically December, while January often presents the lowest earnings, highlighting opportunities for strategic pricing adjustments during shoulder and low seasons. Explore the typical Airbnb income in Marilao across different performance tiers:
- Best-in-class properties (Top 10%) achieve $633+ monthly, often utilizing dynamic pricing and superior guest experiences.
- Strong performing properties (Top 25%) earn $387 or more, indicating effective management and desirable locations/amenities.
- Typical properties (Median) generate around $189 per month, representing the average market performance.
- Entry-level properties (Bottom 25%) see earnings around $83, often with potential for optimization.
Average Monthly Airbnb Earnings Trend in Marilao
Marilao Airbnb Occupancy Rate Trends (2026)
Maximize your bookings by understanding the Marilao STR occupancy trends. Seasonal demand shifts significantly influence how often properties are booked. Typically, Decembersees the highest demand (peak season occupancy), while October experiences the lowest (low season). Effective strategies, like adjusting minimum stays or offering promotions, can boost occupancy during slower periods. Here's how different property tiers perform in Marilao:
- Best-in-class properties (Top 10%) achieve 52%+ occupancy, indicating high desirability and potentially optimized availability.
- Strong performing properties (Top 25%) maintain 32% or higher occupancy, suggesting good market fit and guest satisfaction.
- Typical properties (Median) have an occupancy rate around 15%.
- Entry-level properties (Bottom 25%) average 7% occupancy, potentially facing higher vacancy.
Average Monthly Occupancy Rate Trend in Marilao
Average Daily Rate (ADR) Airbnb Trends in Marilao (2026)
Effective short term rental pricing strategy in Marilao involves understanding monthly ADR fluctuations. The Average Daily Rate (ADR) for Airbnb in Marilao typically peaks in June and dips lowest during April. Leveraging Airbnb dynamic pricing tools or strategies based on this seasonality can significantly boost revenue. Here's a look at the typical nightly rates achieved:
- Best-in-class properties (Top 10%) command rates of $57+ per night, often due to premium features or locations.
- Strong performing properties (Top 25%) achieve nightly rates of $46 or more.
- Typical properties (Median) charge around $37 per night.
- Entry-level properties (Bottom 25%) earn around $30 per night.
Average Daily Rate (ADR) Trend by Month in Marilao
Get Live Marilao Market Intelligence 👇

Explore Real-time Analytics
Airbnb Seasonality Analysis & Trends in Marilao (2026)
Peak Season (December, April, February)
- Revenue averages $369 per month
- Occupancy rates average 27.5%
- Daily rates average $43
Shoulder Season
- Revenue averages $297 per month
- Occupancy maintains around 21.7%
- Daily rates hold near $44
Low Season (January, September, October)
- Revenue drops to average $247 per month
- Occupancy decreases to average 19.3%
- Daily rates adjust to average $44
Seasonality Insights for Marilao
- The Airbnb seasonality in Marilao shows moderate seasonality with distinct peak and low periods. While the sections above show seasonal averages, it's also insightful to look at the extremes:
- During the high season, the absolute peak month showcases Marilao's highest earning potential, with monthly revenues capable of climbing to $406, occupancy reaching a high of 28.1%, and ADRs peaking at $45.
- Conversely, the slowest single month of the year, typically falling within the low season, marks the market's lowest point. In this month, revenue might dip to $234, occupancy could drop to 17.0%, and ADRs may adjust down to $42.
- Understanding both the seasonal averages and these monthly peaks and troughs in revenue, occupancy, and ADR is crucial for maximizing your Airbnb profit potential in Marilao.
Seasonal Strategies for Maximizing Profit
- Peak Season: Maximize revenue through premium pricing and potentially longer minimum stays. Ensure high availability.
- Low Season: Offer competitive pricing, special promotions (e.g., extended stay discounts), and flexible cancellation policies. Target off-season travelers like remote workers or budget-conscious guests.
- Shoulder Seasons: Implement dynamic pricing that balances peak and low rates. Target weekend travelers or specific events. Offer slightly more flexible terms than peak season.
- Regularly analyze your own performance against these Marilao seasonality benchmarks and adjust your pricing and availability strategy accordingly.
Best Areas for Airbnb Investment in Marilao (2026)
Exploring the top neighborhoods for short-term rentals in Marilao? This section highlights key areas, outlining why they are attractive for hosts and guests, along with notable local attractions. Consider these locations based on your target guest profile and investment strategy.
| Neighborhood / Area | Why Host Here? (Target Guests & Appeal) | Key Attractions & Landmarks |
|---|---|---|
| Malhacan | A growing residential area in Marilao, ideal for families and visitors alike. Located near schools and business establishments, making it a convenient spot for both long-term and short-term rentals. | SM City Marilao, Marilao Sports Complex, Malhacan River, Nearby educational institutions |
| Bical | Known for its accessibility and proximity to major transport routes. Attracts both locals and tourists due to its residential charm and local attractions. | Local markets, Public transport access, Community parks, Festivals and events |
| Layong Mabilog | A peaceful locality that offers a retreat from city life. It’s popular among travelers looking for a quiet stay while still having access to city amenities. | Layong Mabilog Eco-Park, Natural scenery, Community events |
| Bulihan | Strategically located and well-connected, Bulihan is ideal for visitors looking for easy accessibility to other regions in Bulacan. | Bulihan River Park, Cultural events, Night markets |
| Poblacion | The main center of Marilao with historical significance and local culture. Great for tourists wanting to explore the heritage of the town. | Historical landmarks, Churches, Local festivals |
| Marilao Heights | This area offers beautiful views and a serene environment, often preferred by families and nature enthusiasts. | Nature parks, Scenic views, Community gatherings |
| Sta. Rosa | A residential area that supports local tourism with convenient amenities and access to recreational options. | Local cuisine spots, Cultural events, Nearby shopping centers |
| Longos | A vibrant community that showcases local life and culture. An attractive spot for those wanting an authentic experience. | Community festivals, Local shops, Proximity to major roads |
Understanding Airbnb License Requirements & STR Laws in Marilao (2026)
While Marilao, Bulacan, Philippines currently shows low STR regulations, specific Airbnb license requirements might still exist or change. Always verify the latest short term rental regulations and Airbnb license requirements directly with local government authorities for Marilao to ensure full compliance before hosting.
(Source: AirROI data, 2026, based on 1% licensed listings)
Top Performing Airbnb Properties in Marilao (2026)
Benchmark your potential! Explore examples of top-performing Airbnb properties in Marilaobased on Trailing Twelve Month (TTM) revenue. Analyze their characteristics, revenue, occupancy rate, and ADR to understand what drives success in this market.
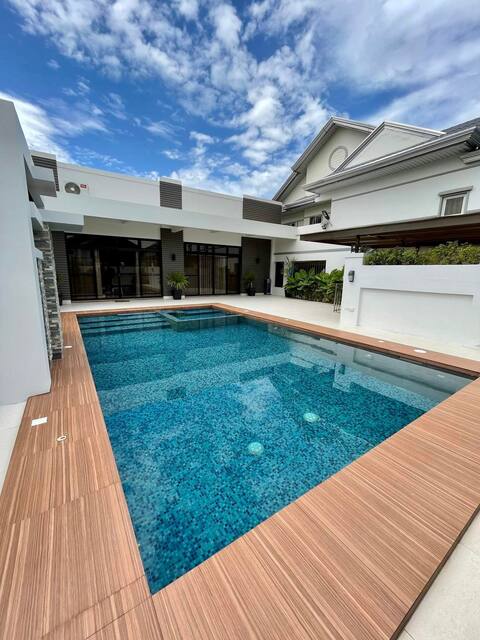
Luxurious Private Pool Villa in Bulacan
Entire Place • 1 bedroom

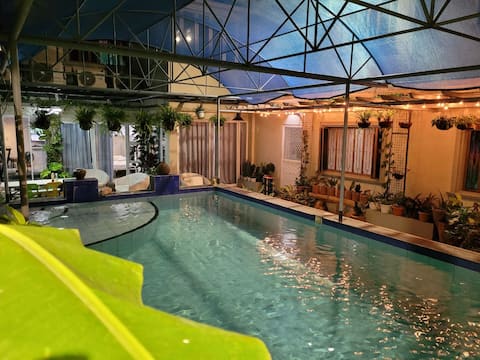
Good Life Private Pool Resort
Entire Place • 4 bedrooms

For Couples |50 Shades of Grey Inspired Staycation
Entire Place • 1 bedroom
Marcelia’s Place - Private Villa with Pool and KTV
Entire Place • 2 bedrooms
![APT@G-207 in Cheer Residences [w/automatic washer]](https://a0.muscache.com/im/pictures/hosting/Hosting-U3RheVN1cHBseUxpc3Rpbmc6MTMwNjAyNDk3NTkxMjA3NTI4Ng%3D%3D/original/c7c8023d-fb05-476e-9f7f-fc77f1cc4bc7.png?im_w=480&im_format=avif)
APT@G-207 in Cheer Residences [w/automatic washer]
Entire Place • 1 bedroom
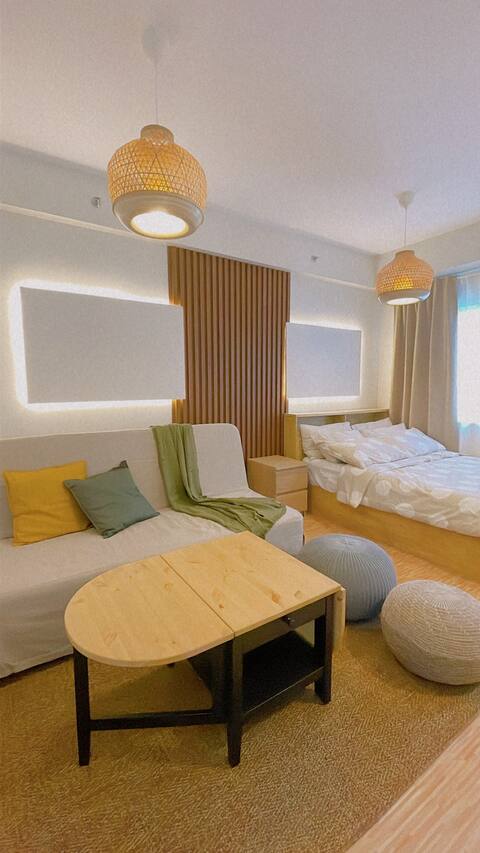
Aesthetic Living by P&R at SMDC Cheer Residences
Entire Place • 1 bedroom
Note: Performance varies based on location, size, amenities, seasonality, and management quality. Data reflects the past 12 months.
Top Performing Airbnb Hosts in Marilao (2026)
Learn from the best! This table showcases top-performing Airbnb hosts in Marilao based on the number of properties managed and estimated total revenue over the past year. Analyze their scale and performance metrics.
| Host Name | Properties | Grossing Revenue | Stay Reviews | Avg Rating |
|---|---|---|---|---|
| Mr. Lee | 9 | $43,427 | 308 | 4.91/5.0 |
| Mary | 4 | $36,836 | 95 | 4.91/5.0 |
| Rowena | 1 | $20,021 | 2 | Not Rated |
| Aniko | 1 | $9,635 | 16 | 5.00/5.0 |
| Stephen | 1 | $9,565 | 10 | 4.90/5.0 |
| Osmund | 1 | $8,705 | 187 | 4.96/5.0 |
| Ae | 2 | $8,607 | 75 | 4.74/5.0 |
| Christine | 2 | $7,997 | 29 | 4.98/5.0 |
| May | 3 | $7,295 | 21 | 5.00/5.0 |
| Francis Mark | 2 | $6,801 | 10 | 4.93/5.0 |
Analyzing the strategies of top hosts, such as their property selection, pricing, and guest communication, can offer valuable lessons for optimizing your own Airbnb operations in Marilao.
Dive Deeper: Advanced Marilao STR Market Data (2026)
Ready to unlock more insights? AirROI provides access to advanced metrics and comprehensive Airbnb data for Marilao. Explore detailed analytics beyond this report to refine your investment strategy, optimize pricing, and maximize your vacation rental profits.
Explore Advanced MetricsMarilao Short-Term Rental Market Composition (2026): Property & Room Types
Room Type Distribution
Property Type Distribution
Market Composition Insights for Marilao
- The Marilao Airbnb market composition is heavily skewed towards Entire Home/Apt listings, which make up 83.2% of the 173 active rentals. This indicates strong guest preference for privacy and space.
- Looking at the property type distribution in Marilao, Apartment/Condo properties are the most common (80.3%), reflecting the local real estate landscape.
- The presence of 7.5% Hotel/Boutique listings indicates integration with traditional hospitality.
- Smaller segments like unique stays (combined 0.6%) offer potential for unique stay experiences.
Marilao Airbnb Room Capacity Analysis (2026): Bedroom Distribution
Distribution of Listings by Number of Bedrooms
Room Capacity Insights for Marilao
- The dominant room capacity in Marilao is 1 bedroom listings, making up 63% of the market. This suggests a strong demand for properties suitable for couples or solo travelers.
- Together, 1 bedroom and 2 bedrooms properties represent 82.7% of the active Airbnb listings in Marilao, indicating a high concentration in these sizes.
- With over half the market (63%) consisting of studios or 1-bedroom units, Marilao is particularly well-suited for individuals or couples.
- Listings with 3+ bedrooms (1.8%) represent a smaller niche, potentially indicating an underserved market for larger group accommodations in Marilao.
Marilao Vacation Rental Guest Capacity Trends (2026)
Distribution of Listings by Guest Capacity
Guest Capacity Insights for Marilao
- The most common guest capacity trend in Marilao vacation rentals is listings accommodating 4 guests (37%). This suggests the primary traveler segment is likely small families or groups.
- Properties designed for 4 guests and 2 guests dominate the Marilao STR market, accounting for 50.9% of listings.
- 26.0% of properties accommodate 6+ guests, serving the market segment for larger families or group travel in Marilao.
- On average, properties in Marilao are equipped to host 4.1 guests.
Marilao Airbnb Booking Patterns (2026): Available vs. Booked Days
Available Days Distribution
Booked Days Distribution
Booking Pattern Insights for Marilao
- The most common availability pattern in Marilao falls within the 271-366 days range, representing 82.7% of listings. This suggests many properties have significant open periods on their calendars.
- Approximately 98.3% of listings show high availability (181+ days open annually), indicating potential for increased bookings or specific owner usage patterns.
- For booked days, the 31-90 days range is most frequent in Marilao (40.5%), reflecting common guest stay durations or potential owner blocking patterns.
- A notable 1.7% of properties secure long booking periods (181+ days booked per year), highlighting successful long-term rental strategies or significant owner usage.
Marilao Airbnb Minimum Stay Requirements Analysis
Distribution of Listings by Minimum Night Requirement
1 Night
148 listings
85.5% of total
2 Nights
13 listings
7.5% of total
7-29 Nights
1 listings
0.6% of total
30+ Nights
11 listings
6.4% of total
Key Insights
- The most prevalent minimum stay requirement in Marilao is 1 Night, adopted by 85.5% of listings. This highlights the market's preference for shorter, flexible bookings.
- A strong majority (93.0%) of the Marilao Airbnb data shows acceptance of very short stays (1-2 nights), indicating a dynamic, high-turnover market.
Recommendations
- Align with the market by considering a 1 Night minimum stay, as 85.5% of Marilao hosts use this setting.
- Explore offering discounts for stays of 30+ nights to attract the 6.4% of the market seeking extended stays.
- Adjust minimum nights based on seasonality – potentially shorter during low season and longer during peak demand periods in Marilao.
Marilao Airbnb Cancellation Policy Trends Analysis (2026)
Limited
15 listings
8.7% of total
Flexible
44 listings
25.4% of total
Moderate
37 listings
21.4% of total
Firm
55 listings
31.8% of total
Strict
22 listings
12.7% of total
Cancellation Policy Insights for Marilao
- The prevailing Airbnb cancellation policy trend in Marilao is Firm, used by 31.8% of listings.
- There's a relatively balanced mix between guest-friendly (46.8%) and stricter (44.5%) policies, offering choices for different guest needs.
Recommendations for Hosts
- Consider adopting a Firm policy to align with the 31.8% market standard in Marilao.
- Using a Strict policy might deter some guests, as only 12.7% of listings use it. Evaluate if potential revenue protection outweighs possible lower booking rates.
- Regularly review your cancellation policy against competitors and market demand shifts in Marilao.
Marilao STR Booking Lead Time Analysis (2026)
Average Booking Lead Time by Month
Booking Lead Time Insights for Marilao
- The overall average booking lead time for vacation rentals in Marilao is 34 days.
- Guests book furthest in advance for stays during November (average 89 days), likely coinciding with peak travel demand or local events.
- The shortest booking windows occur for stays in September (average 10 days), indicating more last-minute travel plans during this time.
- Seasonally, Fall (41 days avg.) sees the longest lead times, while Summer (16 days avg.) has the shortest, reflecting typical travel planning cycles.
Recommendations for Hosts
- Use the overall average lead time (34 days) as a baseline for your pricing and availability strategy in Marilao.
- For November stays, consider implementing length-of-stay discounts or slightly higher rates for bookings made less than 89 days out to capitalize on advance planning.
- During September, focus on last-minute booking availability and promotions, as guests book with very short notice (10 days avg.).
- Target marketing efforts for the Fall season well in advance (at least 41 days) to capture early planners.
- Monitor your own booking lead times against these Marilao averages to identify opportunities for dynamic pricing adjustments.
Popular & Essential Airbnb Amenities in Marilao (2026)
Amenity Prevalence
Amenity Insights for Marilao
- Essential amenities in Marilao that guests expect include: Air conditioning, TV, Wifi. Lacking these (any) could significantly impact bookings.
- Popular amenities like Kitchen, Smoke alarm, Pool are common but not universal. Offering these can provide a competitive edge.
- A pool is a highly desired but not standard amenity, making it a key feature for attracting guests seeking leisure in Marilao.
Recommendations for Hosts
- Ensure your listing includes all essential amenities for Marilao: Air conditioning, TV, Wifi.
- Prioritize adding missing essentials: TV, Wifi.
- Consider adding popular differentiators like Kitchen or Smoke alarm to increase appeal.
- Highlight unique or less common amenities you offer (e.g., hot tub, dedicated workspace, EV charger) in your listing description and photos.
- Regularly check competitor amenities in Marilao to stay competitive.
Marilao Airbnb Guest Demographics & Profile Analysis (2026)
Guest Profile Summary for Marilao
- The typical guest profile for Airbnb in Marilao consists of primarily domestic travelers (77%), often arriving from nearby Manila, typically belonging to the Post-2000s (Gen Z/Alpha) group (50%), primarily speaking English or Tagalog.
- Domestic travelers account for 77.3% of guests.
- Key international markets include Philippines (77.3%) and United States (8.1%).
- Top languages spoken are English (50.7%) followed by Tagalog (23.2%).
- A significant demographic segment is the Post-2000s (Gen Z/Alpha) group, representing 50% of guests.
Recommendations for Hosts
- Target domestic marketing efforts towards travelers from Manila and Makati.
- Tailor amenities and listing descriptions to appeal to the dominant Post-2000s (Gen Z/Alpha) demographic (e.g., highlight fast WiFi, smart home features, local guides).
- Highlight unique local experiences or amenities relevant to the primary guest profile.
- Consider seasonal promotions aligned with peak travel times for key origin markets.
Nearby Short-Term Rental Market Comparison
How does the Marilao Airbnb market stack up against its neighbors? Compare key performance metrics like average monthly revenue, ADR, and occupancy rates in surrounding areas to understand the broader regional STR landscape.
| Market | Active Properties | Monthly Revenue | Daily Rate | Avg. Occupancy |
|---|---|---|---|---|
| Bustos | 10 | $1,728 | $216.86 | 28% |
| Cabangan | 44 | $1,529 | $200.94 | 26% |
| Lian | 121 | $1,491 | $216.20 | 24% |
| Jalajala | 19 | $1,489 | $234.86 | 21% |
| Laoag | 17 | $1,412 | $158.39 | 33% |
| Beneg | 13 | $1,304 | $267.34 | 22% |
| Arew | 11 | $1,288 | $193.81 | 22% |
| Cabuyao | 25 | $1,202 | $114.93 | 36% |
| Binangonan | 49 | $1,191 | $135.12 | 29% |
| Porac | 51 | $1,157 | $203.91 | 21% |