Cebu City, Central Visayas Airbnb Market Data 2026: STR Report & Statistics
How much can you earn on Airbnb in Cebu City, Central Visayas? Based on AirROI's 2026 dataset (June 2025 – May 2026), the short answer is $3,692 per year — at a $40 nightly rate, 34.6% occupancy, and a $14 RevPAR that reflects moderate rate-to-revenue efficiency with room to optimize.
Cebu City's 3,932 active listings and selective demand that rewards strong listing quality and pricing strategy make it a major short-term rental market. Supply grew 48.2% and nightly rates have risen, creating an environment where the most bookable listings stand to capture outsized share. Hosts who pair competitive pricing with strong guest experience are well-positioned to convert the growing traveler base into consistent bookings.
Regulation is low with minimal registration requirements, pointing to an operator-friendly environment. For data-driven hosts, the opportunity lies in reading these signals and positioning accordingly.

Table of Contents [hide] [show]
What Are the Key Airbnb Metrics in Cebu City?
In Cebu City, the headline Airbnb metrics are $3,692 in average annual revenue,34.6% occupancy, $40 ADR, and $14 in RevPAR, and guests book about 30 days in advance.
How Much Do Airbnb Hosts Earn Monthly in Cebu City?
Understanding the monthly revenue variations for Airbnb listings in Cebu City is key to maximizing your short term rental income potential. Seasonality significantly impacts earnings. Our analysis, based on data from the past 12 months, shows that the peak revenue month for STRs in Cebu City is typically January, while May often presents the lowest earnings, highlighting opportunities for strategic pricing adjustments during shoulder and low seasons. Explore the typical Airbnb income in Cebu City across different performance tiers:
- Best-in-class properties (Top 10%) achieve $1,056+ monthly, often utilizing dynamic pricing and superior guest experiences.
- Strong performing properties (Top 25%) earn $690 or more, indicating effective management and desirable locations/amenities.
- Typical properties (Median) generate around $382 per month, representing the average market performance.
- Entry-level properties (Bottom 25%) see earnings around $160, often with potential for optimization.
Average Monthly Airbnb Earnings Trend in Cebu City
What Is the Monthly Airbnb Occupancy Rate in Cebu City?
Maximize your bookings by understanding the Cebu City STR occupancy trends. Seasonal demand shifts significantly influence how often properties are booked. Typically, Decembersees the highest demand (peak season occupancy), while May experiences the lowest (low season). Effective strategies, like adjusting minimum stays or offering promotions, can boost occupancy during slower periods. Here's how different property tiers perform in Cebu City:
- Best-in-class properties (Top 10%) achieve 81%+ occupancy, indicating high desirability and potentially optimized availability.
- Strong performing properties (Top 25%) maintain 61% or higher occupancy, suggesting good market fit and guest satisfaction.
- Typical properties (Median) have an occupancy rate around 36%.
- Entry-level properties (Bottom 25%) average 16% occupancy, potentially facing higher vacancy.
Average Monthly Occupancy Rate Trend in Cebu City
What Is the Average Airbnb Nightly Rate in Cebu City?
Effective short term rental pricing strategy in Cebu City involves understanding monthly ADR fluctuations. The Average Daily Rate (ADR) for Airbnb in Cebu City typically peaks in January and dips lowest during November. Leveraging Airbnb dynamic pricing tools or strategies based on this seasonality can significantly boost revenue. Here's a look at the typical nightly rates achieved:
- Best-in-class properties (Top 10%) command rates of $66+ per night, often due to premium features or locations.
- Strong performing properties (Top 25%) achieve nightly rates of $43 or more.
- Typical properties (Median) charge around $32 per night.
- Entry-level properties (Bottom 25%) earn around $26 per night.
Average Daily Rate (ADR) Trend by Month in Cebu City
What Is the RevPAR for Airbnb in Cebu City?
RevPAR in Cebu City is currently $14. Because RevPAR combines nightly rates with realized occupancy, it is one of the cleanest ways to compare how efficiently listings turn demand into revenue across the market.
- Entry-level properties (Bottom 25%) see $6 RevPAR.
- Typical properties (Median) generate $11 RevPAR.
- Strong performers (Top 25%) earn $18 RevPAR.
- Best-in-class (Top 10%) achieve $27 RevPAR.
Average Monthly RevPAR Trend in Cebu City
RevPAR Insights for Cebu City
- The average RevPAR in Cebu City is $14. This metric combines nightly rates with realized occupancy, making it one of the best single-number indicators of market efficiency.
- The gap between the top 10% ($27) and bottom 25% ($6) is $21, suggesting a relatively compressed market where operational differences yield moderate returns.
- RevPAR peaks in Jan and bottoms out in May, mirroring the broader seasonal demand pattern and suggesting opportunities for dynamic pricing.
Recommendations for Hosts
- Track your own RevPAR monthly against these Cebu City benchmarks. If your RevPAR falls below the median of $11, examine whether low occupancy or low ADR is the primary drag.
- Top-quartile listings achieve $18+ RevPAR through a combination of competitive pricing, strong reviews, and strategic amenities. Target this tier through incremental improvements.
- Use RevPAR rather than revenue alone when comparing properties of different sizes — it normalizes for available nights and gives a more accurate picture of performance.
Get Live Cebu City Market Intelligence 👇
Explore Real-time Analytics
When Is the Peak Season for Airbnb in Cebu City?
Cebu City's peak Airbnb season falls in January, July, December, while the softest stretch is May, September, October. Overall, the market shows relatively stable year-round demand, which should guide pricing, minimum stays, and cash-flow planning.
Peak Season (January, July, December)
- Revenue averages $562 per month
- Occupancy rates average 42.2%
- Daily rates average $41
Shoulder Season
- Revenue averages $522 per month
- Occupancy maintains around 40.6%
- Daily rates hold near $41
Low Season (May, September, October)
- Revenue drops to average $466 per month
- Occupancy decreases to average 36.3%
- Daily rates adjust to average $40
Seasonality Insights for Cebu City
- Airbnb seasonality in Cebu City is subdued — revenue stays within a narrow band throughout the year. This is advantageous for hosts who value predictable cash flow and simpler pricing management.
- During the high season, the absolute peak month showcases Cebu City's highest earning potential, with monthly revenues climbing to $578, occupancy reaching 44.1%, and ADRs peaking at $44.
- Conversely, the slowest single month marks the market's lowest point — revenue may dip to $438, occupancy could drop to 31.6%, and ADRs may adjust to $39.
- Understanding both the seasonal averages and these monthly peaks and troughs in revenue, occupancy, and ADR is crucial for maximizing your Airbnb profit potential in Cebu City.
Seasonal Strategies for Maximizing Profit
- Peak Season: Maximize revenue through premium pricing and potentially longer minimum stays. Ensure high availability and consider tightening cancellation policies to reduce last-minute gaps.
- Low Season: Offer competitive pricing, extended-stay discounts, and flexible cancellation policies. Target off-season travelers like remote workers, budget-conscious guests, and travelers with flexible schedules.
- Shoulder Seasons: Implement dynamic pricing that bridges peak and low rates. Target weekend travelers, local events, and business visitors. Slightly more flexible terms than peak season can help maintain occupancy without deep discounting.
- With stable year-round demand, Cebu City hosts can focus less on seasonal pricing swings and more on incremental improvements — better photos, faster response times, and amenity upgrades that compound over time.
Do You Need a License for Airbnb in Cebu City?
Cebu City, Central Visayas, Philippines currently shows a low regulation profile despite having 3,932 active listings. Larger markets with light regulation can attract new supply quickly, but that also means regulatory frameworks may evolve as local governments respond to growth — staying informed protects your investment. Always verify the latest short-term rental regulations and Airbnb license requirements directly with local government authorities for Cebu City to ensure full compliance before hosting.
(Source: AirROI data, 2026, based on 0% licensed listings)
What Are the Best Neighborhoods for Airbnb in Cebu City?
Cebu City is a large short-term rental market, and performance varies significantly by location within the city. The neighborhoods below are among the most active areas for Airbnb hosts — each with distinct guest demographics, demand drivers, and local attractions. Use this as a starting point for neighborhood-level investment analysis in Cebu City, Central Visayas.
| Neighborhood / Area | Why Host Here? (Target Guests & Appeal) | Key Attractions & Landmarks |
|---|---|---|
| Ayala Center | Cebu's premier shopping and business district, making it attractive for tourists and business travelers. Proximity to offices and amenities ensures high occupancy. | Ayala Center Cebu, Cebu Business Park, The Terraces, Cebu I.T. Park, Cebu Provincial Capitol |
| IT Park | A bustling hub for startups and tech companies, this area is popular among young professionals and expatriates, providing a modern living environment with plenty of eateries and activities. | Cebu IT Park, The Walk, S&R Membership Shopping, Cebu City Sports Club, People's Park |
| Mactan Island | Known for beautiful beaches and resorts, it's a prime location for tourists looking for relaxation and water activities, making it excellent for vacation rentals. | Mactan Island beaches, Hukad Restaurant, Mactan Island Aquarium, Lapu-Lapu Shrine, Lapu-Lapu City |
| Fort San Pedro | Historic area with attractions that draw tourists interested in cultural heritage, ideal for short-term rental units. | Fort San Pedro, Plaza Independencia, Cebu Metropolitan Cathedral, Magellan's Cross, Basilica del Santo Niño |
| Cebu Downtown | Cebu City's central business district filled with historical sites and local attractions, appealing to both domestic and international tourists. | Cebu Heritage Monument, Yap-Sandiego Ancestral House, Carbon Market, Colon Street, Cebu Doctor's University |
| Banilad | A residential area that is close to shopping malls and educational institutions, appealing to families and long-term renters as well as tourists. | Gaisano Country Mall, Banilad Town Centre, Cebu International School, University of San Carlos, Cebu Country Club |
| Talamban | A suburban area known for its peaceful environment, suitable for families and tourists looking for a relaxed stay while still being close to the city. | J Centre Mall, Talamban Park, Bamboo Grove, Cebu International School, Garden Blooms |
| Talisay City | Just south of Cebu City, this area has access to beautiful beaches and local culture, making it great for Airbnb investments. | Talisay City beach resorts, The Queen City of the South, Paradise Beach, Talisay City Park, San Isidro Labrador Parish |
With 8 distinct neighborhoods showing meaningful short-term rental activity, Cebu City offers diversification within a single market. Investors can tailor their strategy — from high-turnover tourist zones to quieter residential areas that attract longer stays and remote workers.
What Types of Properties Are on Airbnb in Cebu City?
Room Type Distribution
Property Type Distribution
Market Composition Insights for Cebu City
- The Cebu City Airbnb market composition is heavily skewed towards Entire Home/Apt listings, which make up 82.3% of the 3,932 active rentals. This indicates strong guest preference for privacy and space.
- Looking at the property type distribution in Cebu City, Apartment/Condo properties are the most common (89.2%), reflecting the local real estate landscape.
- Smaller segments like hotel/boutique, house, unique stays, others, outdoor/unique (combined 10.8%) offer potential for unique stay experiences.
Cebu City Airbnb Room Capacity Analysis (2026): Bedroom Distribution
Distribution of Listings by Number of Bedrooms
Room Capacity Insights for Cebu City
- The dominant room capacity in Cebu City is 1 bedroom listings, making up 47.7% of the market. This suggests a strong demand for properties suitable for couples or solo travelers.
- Together, 1 bedroom and 2 bedrooms properties represent 59.2% of the active Airbnb listings in Cebu City, indicating a high concentration in these sizes.
- Listings with 3+ bedrooms (2.8%) represent a smaller niche, potentially indicating an underserved market for larger group accommodations in Cebu City.
Cebu City Vacation Rental Guest Capacity Trends (2026)
Distribution of Listings by Guest Capacity
Guest Capacity Insights for Cebu City
- The most common guest capacity trend in Cebu City vacation rentals is listings accommodating 2 guests (29.5%). This suggests the primary traveler segment is likely couples or solo travelers.
- Properties designed for 2 guests and 4 guests dominate the Cebu City STR market, accounting for 54.4% of listings.
- 13.8% of properties accommodate 6+ guests, serving the market segment for larger families or group travel in Cebu City.
- On average, properties in Cebu City are equipped to host 3.4 guests.
How Do Listings in Cebu City Compare on Quality?
Listing quality in Cebu City can be approximated through presentation depth, bedroom count, and how often hosts disclose exact locations. These signals show how professionally the local supply base is merchandised.
Listing Quality Insights for Cebu City
- At 28 photos per listing on average, Cebu City hosts invest well in visual presentation. Listings with 20+ photos consistently outperform in search ranking and conversion.
- 39.1% of listings show their exact location. Lower disclosure rates can increase booking hesitation — guests want to know exactly where they are staying.
Recommendations for Hosts
- Enable exact location if possible — it removes a common source of guest uncertainty and can improve your listing's position in map-based searches.
- Use these quality indicators as a self-audit checklist. Listings that exceed the Cebu City averages across all three metrics are better positioned for premium pricing.
What Amenities Do Airbnb Guests Expect in Cebu City?
Amenity Prevalence
Amenity Insights for Cebu City
- Essential amenities in Cebu City that guests expect include: Wifi, Air conditioning, TV. Lacking these (any) could significantly impact bookings.
- Popular amenities like Smoke alarm, Kitchen, Pool are common but not universal. Offering these can provide a competitive edge.
- A pool is a highly desired but not standard amenity, making it a key feature for attracting guests seeking leisure in Cebu City.
Recommendations for Hosts
- Ensure your listing includes all essential amenities for Cebu City: Wifi, Air conditioning, TV.
- Prioritize adding missing essentials: Wifi, Air conditioning, TV.
- Consider adding popular differentiators like Smoke alarm or Kitchen to increase appeal.
- Highlight unique or less common amenities you offer (e.g., hot tub, dedicated workspace, EV charger) in your listing description and photos.
- Regularly check competitor amenities in Cebu City to stay competitive.
Which Airbnb Amenities Boost Revenue in Cebu City?
Not every amenity matters equally. This table focuses on the amenities most associated with higher revenue in Cebu City, which makes it more useful for prioritizing upgrades than a simple popularity list alone.
| Amenity | Prevalence | Revenue With | Revenue Without | Revenue Uplift |
|---|---|---|---|---|
Barbecue utensilsHigh opportunity | 0.4% | $19,511 | $3,623 | 438.6% |
Changing tableHigh opportunity | 0.2% | $19,008 | $3,656 | 419.9% |
Baby bathHigh opportunity | 0.2% | $19,011 | $3,660 | 419.4% |
Outdoor kitchenHigh opportunity | 0.5% | $17,049 | $3,627 | 370.1% |
Game consoleHigh opportunity | 0.5% | $16,169 | $3,634 | 344.9% |
Pack ’n play/Travel cribHigh opportunity | 0.4% | $13,993 | $3,652 | 283.1% |
Babysitter recommendationsHigh opportunity | 0.4% | $13,455 | $3,652 | 268.5% |
Hot tubHigh opportunity | 0.9% | $11,080 | $3,627 | 205.5% |
Fire pitHigh opportunity | 0.8% | $10,648 | $3,636 | 192.8% |
Baking sheetHigh opportunity | 0.9% | $8,940 | $3,644 | 145.3% |
Revenue Impact Insights for Cebu City
- Barbecue utensils tops the revenue impact list with a 438.6% uplift — listings with this amenity earn $19,511 vs. $3,623 without it.
- High-opportunity amenities — Barbecue utensils, Changing table, Baby bath — combine revenue uplift above 100% with prevalence under 10%, meaning most competitors haven't adopted them yet.
Recommendations for Hosts
- Prioritize adding Barbecue utensils — it has the best combination of high revenue impact and low market saturation in Cebu City.
- Focus your upgrade budget on amenities in the top half of this table. Below-median amenities may improve guest experience but contribute less to revenue growth.
- Highlight revenue-impacting amenities prominently in your listing title, photos, and description — guests can't value what they don't notice.
Dive Deeper: Advanced Cebu City STR Market Data (2026)
Ready to unlock more insights? AirROI provides access to advanced metrics and comprehensive Airbnb data for Cebu City. Explore detailed analytics beyond this report to refine your investment strategy, optimize pricing, and maximize your vacation rental profits.
Explore Advanced MetricsCebu City Airbnb Guest Demographics & Profile Analysis (2026)
Guest Profile Summary for Cebu City
- The typical guest profile for Airbnb in Cebu City consists of a mix of domestic (49%) and international guests, with top international origins including United States, typically belonging to the Post-2000s (Gen Z/Alpha) group (50%), primarily speaking English or Filipino.
- Domestic travelers account for 49.0% of guests.
- Key international markets include Philippines (49%) and United States (20.3%).
- Top languages spoken are English (51.8%) followed by Filipino (14.1%).
- A significant demographic segment is the Post-2000s (Gen Z/Alpha) group, representing 50% of guests.
Recommendations for Hosts
- Balance marketing efforts between domestic and international channels based on the guest mix.
- Tailor amenities and listing descriptions to appeal to the dominant Post-2000s (Gen Z/Alpha) demographic (e.g., highlight fast WiFi, smart home features, local guides).
- Highlight unique local experiences or amenities relevant to the primary guest profile.
- Consider seasonal promotions aligned with peak travel times for key origin markets.
What Are Airbnb Guest Ratings in Cebu City?
Listings in Cebu City average 4.73 out of 5 overall, with about 40.3 reviews per active listing and 33.7% of listings carrying the Guest Favorite badge.
Rating Breakdown by Category
Guest Rating Insights for Cebu City
- An average rating of 4.73 places Cebu City in solid territory. Most guests leave satisfied, though there is room for hosts to push toward the top tier.
- The strongest subcategory is Check-in (4.83), while Cleanliness (4.7) trails behind — a useful signal for hosts looking to prioritize upgrades.
- 33.7% of listings carry the Guest Favorite badge, a strong trust signal that can meaningfully lift click-through and booking rates.
Recommendations for Hosts
- Focus improvement efforts on Cleanliness — even small gains in the weakest subcategory can lift overall ratings and search ranking.
- Encourage guests to leave reviews after checkout. Listings with more reviews rank higher in search results and convert browsers into bookers more effectively.
Cebu City Airbnb Booking Patterns (2026): Available vs. Booked Days
Available Days Distribution
Booked Days Distribution
Booking Pattern Insights for Cebu City
- The most common availability pattern in Cebu City falls within the 271-366 days range, representing 61.8% of listings. This suggests many properties have significant open periods on their calendars.
- Approximately 84.7% of listings show high availability (181+ days open annually), indicating potential for increased bookings or specific owner usage patterns.
- For booked days, the 1-30 days range is most frequent in Cebu City (33.1%), reflecting common guest stay durations or potential owner blocking patterns.
- A notable 15.9% of properties secure long booking periods (181+ days booked per year), highlighting successful long-term rental strategies or significant owner usage.
How Far in Advance Do Guests Book Airbnb in Cebu City?
Average Booking Lead Time by Month
Booking Lead Time Insights for Cebu City
- The overall average booking lead time for vacation rentals in Cebu City is 30 days.
- Guests book furthest in advance for stays during January (average 61 days), likely coinciding with peak travel demand or local events.
- The shortest booking windows occur for stays in June (average 18 days), indicating more last-minute travel plans during this time.
- Seasonally, Winter (36 days avg.) sees the longest lead times, while Summer (21 days avg.) has the shortest, reflecting typical travel planning cycles.
Recommendations for Hosts
- Use the overall average lead time (30 days) as a baseline for your pricing and availability strategy in Cebu City.
- For January stays, consider implementing length-of-stay discounts or slightly higher rates for bookings made less than 61 days out to capitalize on advance planning.
- Target marketing efforts for the Winter season well in advance (at least 36 days) to capture early planners.
- Monitor your own booking lead times against these Cebu City averages to identify opportunities for dynamic pricing adjustments.
What Is the Average Length of Stay for Airbnb in Cebu City?
Guests in Cebu City stay about 5.5 nights on average, generating roughly 62,793 reservations and 16.1 bookings per listing in the latest AirROI dataset. The most common check-in time is 2:00 PM and check-out is 11:00 AM.
Monthly Length of Stay in Cebu City
Check-in Time Distribution
Check-out Time Distribution
Stay Pattern Insights for Cebu City
- A mid-range stay length points to leisure-driven demand — weekend getaways and short vacations. Hosts should optimize for quick turnover efficiency while keeping the guest experience smooth.
- 16.1 bookings per listing is a manageable pace that balances revenue with operational overhead.
- Stay lengths peak in Jul (5.5 nights) and shorten in Mar (4.7 nights). Adjust minimum-night requirements seasonally to match.
Recommendations for Hosts
- Leverage the longer-stay pattern by offering weekly discounts — even 5-10% off can convert browsing into bookings for guests considering an extended stay.
- Set your check-in time to match or beat the market standard of 2:00 PM. Offering early check-in flexibility can be a low-cost differentiator.
- Monitor length-of-stay seasonality to adjust minimum-night requirements — longer minimums during peak periods maximize revenue while shorter minimums fill gaps in shoulder seasons.
Cebu City Airbnb Minimum Stay Requirements Analysis
Distribution of Listings by Minimum Night Requirement
1 Night
1596 listings
40.6% of total
2 Nights
803 listings
20.4% of total
3 Nights
289 listings
7.3% of total
4-6 Nights
179 listings
4.6% of total
7-29 Nights
143 listings
3.6% of total
30+ Nights
922 listings
23.4% of total
Key Insights
- The most prevalent minimum stay requirement in Cebu City is 1 Night, adopted by 40.6% of listings. This highlights the market's preference for shorter, flexible bookings.
- A strong majority (61.0%) of the Cebu City Airbnb data shows acceptance of very short stays (1-2 nights), indicating a dynamic, high-turnover market.
- A significant segment (23.4%) caters to monthly stays (30+ nights) in Cebu City, pointing to opportunities in the extended-stay market.
Recommendations
- Align with the market by considering a 1 Night minimum stay, as 40.6% of Cebu City hosts use this setting.
- Explore offering discounts for stays of 30+ nights to attract the 23.4% of the market seeking extended stays.
- Adjust minimum nights based on seasonality – potentially shorter during low season and longer during peak demand periods in Cebu City.
Cebu City Airbnb Cancellation Policy Trends Analysis (2026)
Limited
177 listings
4.5% of total
Super Strict 30 Days
1 listings
0% of total
Super Strict 60 Days
46 listings
1.2% of total
Flexible
1239 listings
31.5% of total
Moderate
953 listings
24.2% of total
Firm
1173 listings
29.8% of total
Strict
341 listings
8.7% of total
Cancellation Policy Insights for Cebu City
- The prevailing Airbnb cancellation policy trend in Cebu City is Flexible, used by 31.5% of listings.
- There's a relatively balanced mix between guest-friendly (55.7%) and stricter (38.5%) policies, offering choices for different guest needs.
- Strict cancellation policies are quite rare (8.7%), potentially making listings with this policy less competitive unless justified by high demand or property type.
Recommendations for Hosts
- Consider adopting a Flexible policy to align with the 31.5% market standard in Cebu City.
- Using a Strict policy might deter some guests, as only 8.7% of listings use it. Evaluate if potential revenue protection outweighs possible lower booking rates.
- Regularly review your cancellation policy against competitors and market demand shifts in Cebu City.
How Much Are Airbnb Cleaning Fees in Cebu City?
Cleaning fees in Cebu City are meaningful operating levers, not just pass-through charges. What matters most is how often hosts charge them, how high they run relative to market norms, and how large a share of gross revenue they consume.
Cleaning Fee Insights for Cebu City
- 73.4% of listings charge a cleaning fee, making it standard practice in Cebu City. Guests expect it and factor it into their booking decisions.
- The average cleaning fee of $21 is close to the median ($8), suggesting a relatively consistent fee structure across the market.
- Cleaning fees represent 4.8% of gross revenue on average — a modest component of the overall booking price.
Recommendations for Hosts
- Price your cleaning fee competitively against the Cebu City median of $8. Fees significantly above market norms can deter bookings, especially for shorter stays.
- Monitor competitor cleaning fees regularly. Airbnb's search algorithm factors in total price, so a well-calibrated cleaning fee can improve your listing's ranking.
What Do the Top Airbnb Listings in Cebu City Look Like?
Benchmark your potential! Explore examples of top-performing Airbnb properties in Cebu Citybased on Trailing Twelve Month (TTM) revenue. Analyze their characteristics, revenue, occupancy rate, and ADR to understand what drives success in this market.
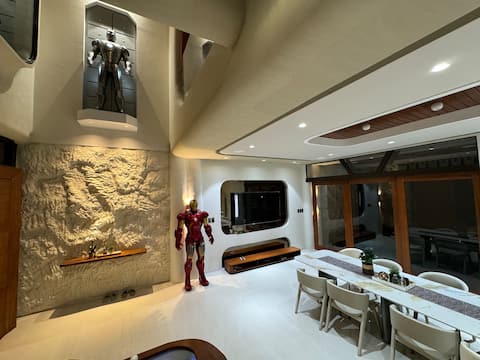
Amazing 5Bedrm Themed House at City Center w/ Maid
Entire Place • 5 bedrooms

Luxury Villa Busay
Entire Place • 4 bedrooms
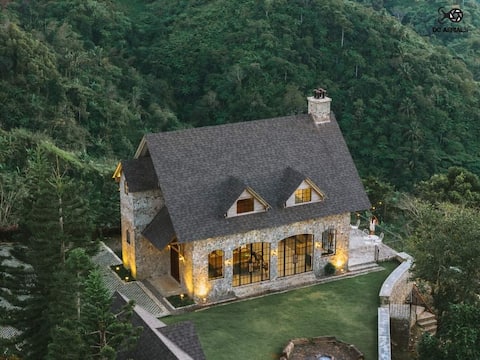
Country Stone House w/ Breathtaking view of Cebu
Entire Place • 3 bedrooms
Penthouse Suite 4Bedroom Unit near Ayala Mall Cebu
Entire Place • 4 bedrooms

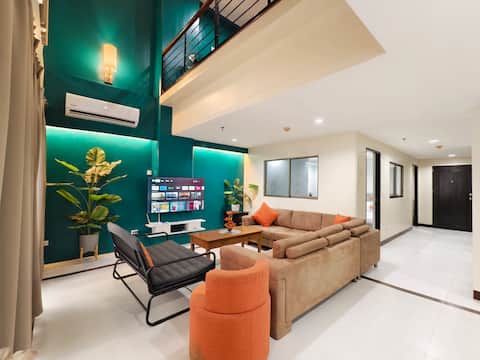
NEWLY RENOVATED PENTHOUSE Apartment in the city
Entire Place • 4 bedrooms

New Starwars 4BR Townhome in ❤ of Cebu + Wifi
Entire Place • 5 bedrooms
Note: Performance varies based on location, size, amenities, seasonality, and management quality. Data reflects the past 12 months.
Who Are the Top Airbnb Hosts in Cebu City?
Learn from the best! This table showcases top-performing Airbnb hosts in Cebu City based on the number of properties managed and estimated total revenue over the past year. Analyze their scale and performance metrics.
| Host Name | Properties | Grossing Revenue | Stay Reviews | Avg Rating |
|---|---|---|---|---|
| Cebu Condotels | 62 | $667,066 | 5476 | 4.83/5.0 |
| Jeanne And Justine | 52 | $303,730 | 1779 | 4.64/5.0 |
| Mia & Pau | 47 | $286,831 | 2814 | 4.92/5.0 |
| Justine | 34 | $249,844 | 1101 | 4.59/5.0 |
| Park | 14 | $246,300 | 1306 | 4.84/5.0 |
| Mikheyla Fox | 26 | $239,918 | 2403 | 4.82/5.0 |
| Rodney | 4 | $218,489 | 1105 | 4.88/5.0 |
| Aya | 26 | $187,653 | 1269 | 4.79/5.0 |
| Bnbâi | 13 | $141,003 | 351 | 4.85/5.0 |
| Leyla & Mickey | 13 | $127,455 | 1381 | 4.86/5.0 |
Analyzing the strategies of top hosts, such as their property selection, pricing, and guest communication, can offer valuable lessons for optimizing your own Airbnb operations in Cebu City.
Who Are the Airbnb Hosts in Cebu City?
Cebu City has a relatively balanced host base.
Host Profile Insights for Cebu City
- A 42.4% Superhost share is healthy — enough experienced operators to anchor quality without making the market impenetrable for newcomers.
- 0.3% of listings are professionally managed, reflecting a market still dominated by individual hosts.
- 10.5% of listings have Instant Book enabled. Lower Instant Book adoption means many guests must request approval, which can slow conversions.
- 64.7% of listings use Airbnb's simplified pricing (host-only fee), where the host pays the entire platform service fee and the guest sees one all-in price with no separate Airbnb service charge. High adoption signals a professional, PMS-connected host base — Airbnb mandates simplified pricing for software-connected listings.
Recommendations for Hosts
- Earning Superhost status can significantly improve search ranking and guest trust. Focus on maintaining high response rates, low cancellations, and strong reviews.
- Consider enabling Instant Book — it reduces booking friction and Airbnb's algorithm tends to favor Instant Book listings in search results.
- With 41.4% cohosted listings, there may be a growing local market for property management services.
- Benchmark your host metrics against these Cebu City averages regularly and adjust your hosting strategy based on what top performers do differently.
Top Professional Management Companies in Cebu City
These are the highest-grossing professional property management operations in Cebu City, ranked by total revenue across their portfolio. Their performance metrics offer a benchmark for what institutional-level hosting looks like in this market.
| Company | Listings | Revenue | ADR | Occ. | Rating |
|---|---|---|---|---|---|
| Mia & Pau | 47 | $286,831 | $50 | 42.4% | 4.92/5 |
| Bnbâi | 13 | $141,003 | $98 | 35.8% | 4.85/5 |
| Ted Ian | 1 | $4,170 | $26 | 45.6% | 4.84/5 |
| Jinky Diaz | 1 | $2,144 | $40 | 25.1% | 5.00/5 |
| Managed By Williams Cebu | 2 | $1,484 | $34 | 34.7% | N/A |
Management Company Insights for Cebu City
- The leading management company, Mia & Pau, operates 47 listings with $286,831 in gross revenue — a useful benchmark for what scale looks like in Cebu City.
- Top managers average 13 properties each, suggesting professional management in Cebu City still operates at a relatively boutique scale.
- Professionally managed listings in the top tier average 4.9/5 in guest ratings — demonstrating that scale and quality can coexist.
Recommendations
- With only 0.3% of listings professionally managed, there may be an opportunity to differentiate through more structured operations and consistent guest experiences.
- Study how top management companies price, position, and maintain their portfolios — their ADR and occupancy rates reflect strategies refined across dozens of listings.
- If you're considering hiring a property manager, compare their portfolio performance against these benchmarks before committing.
How Does Cebu City's Airbnb Market Compare to Nearby Cities?
How does the Cebu City Airbnb market stack up against its neighbors? Compare key performance metrics like average monthly revenue, ADR, and occupancy rates in surrounding areas to understand the broader regional STR landscape.
Compared with Balabagon, Cebu City has 17 percentage points lower occupancy and about $6 lower ADR. That helps frame whether this market is winning more on demand, pricing, or both.
| Market | Active Properties | Monthly Revenue | Daily Rate | Avg. Occupancy |
|---|---|---|---|---|
| Mantalongon | 11 | $1,319 | $128.45 | 35% |
| Samboan | 13 | $1,090 | $115.74 | 24% |
| Gaas | 10 | $1,003 | $181.23 | 27% |
| Santander | 17 | $945 | $109.08 | 32% |
| Banhigan | 10 | $815 | $88.39 | 23% |
| Dalaguete | 12 | $663 | $135.35 | 24% |
| Don Salvador Benedicto | 10 | $646 | $173.41 | 16% |
| Basdiot | 139 | $618 | $60.91 | 36% |
| Balabagon | 13 | $601 | $45.94 | 52% |
| Tuble | 33 | $583 | $63.87 | 29% |
Frequently Asked Questions About Airbnb in Cebu City
These quick answers summarize the most common investor and operator questions using AirROI's latest market data for Cebu City.
How much do Airbnb hosts make in Cebu City?
Cebu City hosts earn about $3,692 per year on average, with an average nightly rate of $40 and RevPAR of $14. Those figures describe the typical revenue environment for active listings in Cebu City, Central Visayas, not the ceiling for the best operators. Source: AirROI 2026 data, Cebu City market, June 2025 to May 2026.
What is the average Airbnb occupancy rate in Cebu City?
The average Airbnb occupancy rate in Cebu City is 34.6%. January is the strongest month and May is the softest, so hosts should expect demand to move meaningfully throughout the year rather than stay flat.
What is the average Airbnb daily rate in Cebu City?
Listings in Cebu City average $40 per night. The broader pricing spread also matters: lower-performing listings cluster closer to the lower quartiles, while premium homes can price materially above the city average when demand spikes or listing quality stands out.
How many Airbnb listings are active in Cebu City?
Cebu City currently has about 3,932 active Airbnb listings in AirROI's market dataset. That supply count helps explain how competitive the market is, how much depth there is for benchmarking, and whether the market behaves like a niche destination or a scaled urban market.
How strict are short-term rental regulations in Cebu City?
AirROI currently classifies the short-term rental regulation level in Cebu City as Low. The dataset also shows about 0.1% of listings with registration evidence. That is a market signal, not legal advice, so hosts should still confirm current licensing and compliance rules locally before listing.
What is the RevPAR for Airbnb in Cebu City?
RevPAR in Cebu City is about $14. That metric combines pricing and occupancy into one efficiency number, so it is often a better quick benchmark than ADR alone when investors want to compare how well listings convert nightly rates into realized revenue.
Is Airbnb profitable in Cebu City?
Occupancy of 34.6% means Cebu City is a more selective market. Profitability is achievable but requires careful cost management, premium positioning, or targeting longer stays to reduce turnover. Average annual revenue is $3,692, but individual returns depend on property type, location within the city, and the host's operating efficiency.
How far in advance do guests book Airbnb in Cebu City?
The average booking lead time in Cebu City is about 30 days — a moderate lead time that gives hosts planning visibility while still benefiting from last-minute bookings. Hosts who understand their market's booking cadence can adjust minimum stays and pricing windows accordingly.
What are the best neighborhoods for Airbnb in Cebu City?
Based on AirROI's analysis, some of the top neighborhoods for short-term rentals in Cebu City include Ayala Center, IT Park, Mactan Island. Each area attracts different guest profiles — from business travelers to leisure visitors — so the best location depends on the property type and target audience a host is aiming for. See the full neighborhood breakdown above.
What type of property performs best on Airbnb in Cebu City?
entire_home listings make up 82.3% of the active supply in Cebu City. The most common configuration does not always mean the most profitable — operators who identify underserved property types or bedroom counts can sometimes outperform the market average by filling a gap in local supply.
How does Cebu City compare to nearby Airbnb markets?
Among neighboring markets, Mantalongon posts $15,823 in average annual revenue with 34.8% occupancy, compared to Cebu City's $3,692 and 34.6%. Comparing nearby markets helps investors understand whether a destination's performance reflects local demand or broader regional trends.
What is the average length of stay in Cebu City?
The average Airbnb stay length in Cebu City is about 5.5 nights. That matters for turnover, cleaning operations, and pricing strategy because shorter stays increase changeovers while longer stays can smooth occupancy and reduce operational friction.
What is the average Airbnb guest rating in Cebu City?
Airbnb listings in Cebu City average 4.73 out of 5 overall. About 33.7% of listings carry the guest favorite badge, which suggests a meaningful share of inventory is competing on review quality rather than price alone.
Which amenities boost Airbnb revenue in Cebu City?
Barbecue utensils and Changing table are among the strongest revenue-linked amenities in Cebu City. In AirROI's latest dataset, listings with these amenities outperform those without on average revenue, which makes amenities analysis useful for prioritizing investment and listing upgrades.
Do Airbnb hosts charge cleaning fees in Cebu City?
Yes. About 73.4% of active Airbnb listings in Cebu City charge a cleaning fee, and the average fee is $21. The more important operating benchmark is how much of gross revenue that fee consumes, not just the absolute dollar amount.
What percentage of Airbnb hosts are Superhosts in Cebu City?
A 42.4% Superhost rate signals a highly competitive market where review quality and responsiveness are table stakes, not differentiators.
About AirROI Market Data
AirROI tracks over 20 million properties across 190+ countries and maintains 15+ years of historical performance data, making it one of the deepest Airbnb and STR intelligence platforms available. The analytics pipeline aggregates listing-level data monthly — revenue, occupancy, nightly rates, RevPAR, guest demographics, booking patterns, and competitive supply — so investors and operators can benchmark any market against its own history and against neighboring destinations.
Real estate investors, property managers, financial institutions, hedge funds, tourism boards, hospitality consultants, tech platforms, and academic researchers rely on AirROI data to underwrite acquisitions, optimize pricing, model macro trends, and conduct peer-reviewed research. Data is available through in-depth market reports like this one and the Airbnb API with 22 endpoints and an Airbnb MCP Server for AI agents.
AirROI proprietary analytics as of 2026-05-31. Metrics reflect trailing twelve-month aggregates from active listings. Revenue figures are market averages, not projections. Neighborhood descriptions are AI-generated and reviewed for accuracy. For full methodology, see the data methodology page.