Calamba Airbnb Market Analysis 2026: Short Term Rental Data & Vacation Rental Statistics in Laguna, Philippines
Is Airbnb profitable in Calamba in 2026? Explore comprehensive Airbnb analytics for Calamba, Laguna, Philippines to uncover income potential. This 2026 STR market report for Calamba, based on AirROI data from February 2025 to January 2026, reveals key trends in the market of 268 active listings.
Whether you're considering an Airbnb investment in Calamba, optimizing your existing vacation rental, or exploring rental arbitrage opportunities, understanding the Calamba Airbnb data is crucial. Leveraging the low regulation environment is key to maximizing your short term rental income potential. Let's dive into the specifics.
Key Calamba Airbnb Performance Metrics Overview
Monthly Airbnb Revenue Variations & Income Potential in Calamba (2026)
Understanding the monthly revenue variations for Airbnb listings in Calamba is key to maximizing your short term rental income potential. Seasonality significantly impacts earnings. Our analysis, based on data from the past 12 months, shows that the peak revenue month for STRs in Calamba is typically December, while September often presents the lowest earnings, highlighting opportunities for strategic pricing adjustments during shoulder and low seasons. Explore the typical Airbnb income in Calamba across different performance tiers:
- Best-in-class properties (Top 10%) achieve $3,628+ monthly, often utilizing dynamic pricing and superior guest experiences.
- Strong performing properties (Top 25%) earn $1,962 or more, indicating effective management and desirable locations/amenities.
- Typical properties (Median) generate around $712 per month, representing the average market performance.
- Entry-level properties (Bottom 25%) see earnings around $261, often with potential for optimization.
Average Monthly Airbnb Earnings Trend in Calamba
Calamba Airbnb Occupancy Rate Trends (2026)
Maximize your bookings by understanding the Calamba STR occupancy trends. Seasonal demand shifts significantly influence how often properties are booked. Typically, Decembersees the highest demand (peak season occupancy), while September experiences the lowest (low season). Effective strategies, like adjusting minimum stays or offering promotions, can boost occupancy during slower periods. Here's how different property tiers perform in Calamba:
- Best-in-class properties (Top 10%) achieve 50%+ occupancy, indicating high desirability and potentially optimized availability.
- Strong performing properties (Top 25%) maintain 32% or higher occupancy, suggesting good market fit and guest satisfaction.
- Typical properties (Median) have an occupancy rate around 17%.
- Entry-level properties (Bottom 25%) average 8% occupancy, potentially facing higher vacancy.
Average Monthly Occupancy Rate Trend in Calamba
Average Daily Rate (ADR) Airbnb Trends in Calamba (2026)
Effective short term rental pricing strategy in Calamba involves understanding monthly ADR fluctuations. The Average Daily Rate (ADR) for Airbnb in Calamba typically peaks in December and dips lowest during January. Leveraging Airbnb dynamic pricing tools or strategies based on this seasonality can significantly boost revenue. Here's a look at the typical nightly rates achieved:
- Best-in-class properties (Top 10%) command rates of $407+ per night, often due to premium features or locations.
- Strong performing properties (Top 25%) achieve nightly rates of $309 or more.
- Typical properties (Median) charge around $172 per night.
- Entry-level properties (Bottom 25%) earn around $38 per night.
Average Daily Rate (ADR) Trend by Month in Calamba
Get Live Calamba Market Intelligence 👇

Explore Real-time Analytics
Airbnb Seasonality Analysis & Trends in Calamba (2026)
Peak Season (December, May, April)
- Revenue averages $1,856 per month
- Occupancy rates average 27.2%
- Daily rates average $201
Shoulder Season
- Revenue averages $1,302 per month
- Occupancy maintains around 21.8%
- Daily rates hold near $197
Low Season (February, September, October)
- Revenue drops to average $1,047 per month
- Occupancy decreases to average 20.1%
- Daily rates adjust to average $195
Seasonality Insights for Calamba
- The Airbnb seasonality in Calamba shows highly seasonal trends requiring careful strategy. While the sections above show seasonal averages, it's also insightful to look at the extremes:
- During the high season, the absolute peak month showcases Calamba's highest earning potential, with monthly revenues capable of climbing to $2,272, occupancy reaching a high of 33.1%, and ADRs peaking at $202.
- Conversely, the slowest single month of the year, typically falling within the low season, marks the market's lowest point. In this month, revenue might dip to $878, occupancy could drop to 16.6%, and ADRs may adjust down to $192.
- Understanding both the seasonal averages and these monthly peaks and troughs in revenue, occupancy, and ADR is crucial for maximizing your Airbnb profit potential in Calamba.
Seasonal Strategies for Maximizing Profit
- Peak Season: Maximize revenue through premium pricing and potentially longer minimum stays. Ensure high availability.
- Low Season: Offer competitive pricing, special promotions (e.g., extended stay discounts), and flexible cancellation policies. Target off-season travelers like remote workers or budget-conscious guests.
- Shoulder Seasons: Implement dynamic pricing that balances peak and low rates. Target weekend travelers or specific events. Offer slightly more flexible terms than peak season.
- Regularly analyze your own performance against these Calamba seasonality benchmarks and adjust your pricing and availability strategy accordingly.
Best Areas for Airbnb Investment in Calamba (2026)
Exploring the top neighborhoods for short-term rentals in Calamba? This section highlights key areas, outlining why they are attractive for hosts and guests, along with notable local attractions. Consider these locations based on your target guest profile and investment strategy.
| Neighborhood / Area | Why Host Here? (Target Guests & Appeal) | Key Attractions & Landmarks |
|---|---|---|
| Robinsons Starmills | A top shopping destination in Calamba with numerous retail outlets, dining options, and entertainment venues, drawing both locals and tourists. | Robinsons Starmills Mall, SM City Calamba, Food Street, Calamba Lake, Crisologo Museum |
| Lake Caliraya | A beautiful natural attraction that offers various water activities and scenic views ideal for weekend getaways, appealing to nature lovers and tourists. | Caliraya Lake, Lagoona Resort, water sports activities, Camp Caliraya, Caliraya Ecovillage |
| Calamba Springs | Known for its hot springs, this area is a popular destination for relaxation and leisure, attracting health-conscious tourists and families. | Pansol Hot Springs, The Pond Resort, Dolphy's Resort, Surreal Garden Resort, Calamba Springs Resort |
| Enchanted Kingdom | A world-renowned theme park that attracts visitors of all ages, offering a magical experience for tourists and families, making it a prime spot for short-term rentals. | Enchanted Kingdom Theme Park, The Grand Carousel, The Space Shuttle, Concert Grounds, Water Park |
| Sampaguita Gardens | An iconic spot in Calamba, known for its picturesque gardens and native architecture. It's a popular venue for events and tourists looking for a unique experience. | Sampaguita Gardens, Villar SIPAG, local cultural shows, nature trails, photo spots |
| Malaueg Beach | A hidden gem offering a serene beach atmosphere, attracting local and international visitors looking for a peaceful beach experience away from the crowds. | Malaueg Beach, beachfront cabanas, fishing spots, scenic views, camping areas |
| Calamba City Center | The bustling heart of Calamba, with a mix of historical sites, commercial establishments, and local eateries, appealing to both locals and tourists. | Rizal Shrine, Calamba Church, park areas, local food markets, shopping centers |
| Mount Makiling | A popular hiking destination with breathtaking views, attracting outdoor enthusiasts and tourists looking for adventure in nature. | Mount Makiling, Makiling Botanical Gardens, hiking trails, natural hot springs, wildlife viewing |
Understanding Airbnb License Requirements & STR Laws in Calamba (2026)
While Calamba, Laguna, Philippines currently shows low STR regulations, specific Airbnb license requirements might still exist or change. Always verify the latest short term rental regulations and Airbnb license requirements directly with local government authorities for Calamba to ensure full compliance before hosting.
(Source: AirROI data, 2026, finding no licensed listings among those analyzed)
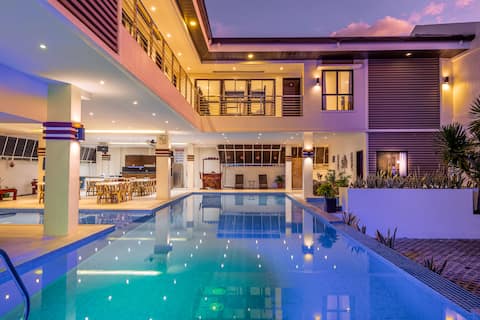
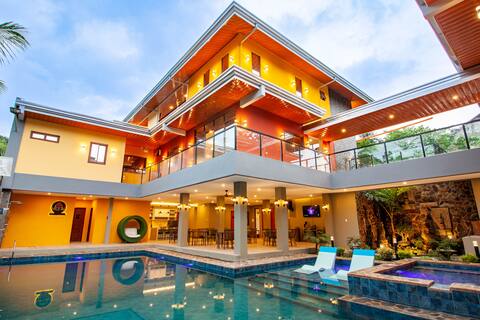
Top Performing Airbnb Properties in Calamba (2026)
Benchmark your potential! Explore examples of top-performing Airbnb properties in Calambabased on Trailing Twelve Month (TTM) revenue. Analyze their characteristics, revenue, occupancy rate, and ADR to understand what drives success in this market.
Casa Gerardo Private Resort - Natural hot spring
Entire Place • 6 bedrooms

Tranquilina Private Resort~max 25 guests
Entire Place • 5 bedrooms
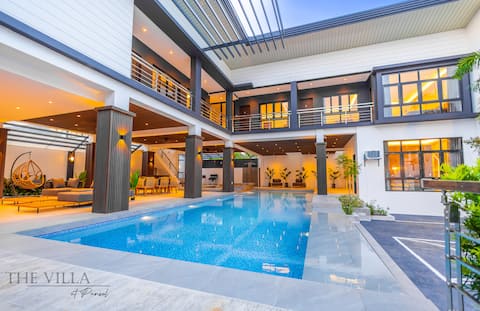
The Villa at Pansol - Natural Hot Spring Resort
Entire Place • 6 bedrooms
Entire Resort (Max. 60pax;9 Rms)
Entire Place • 9 bedrooms
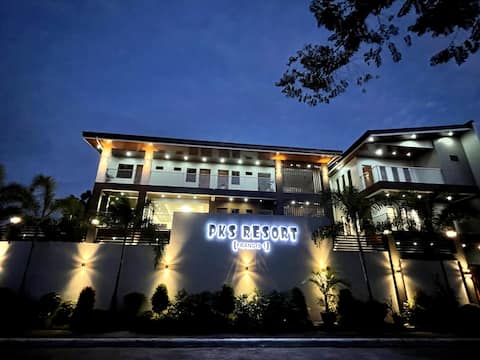
Private Resort in Calamba (PKS Resort Francis 1)
Entire Place • 7 bedrooms
Hannahs Place Luxury Resort Pansol
Private Room • 6 bedrooms
Note: Performance varies based on location, size, amenities, seasonality, and management quality. Data reflects the past 12 months.
Top Performing Airbnb Hosts in Calamba (2026)
Learn from the best! This table showcases top-performing Airbnb hosts in Calamba based on the number of properties managed and estimated total revenue over the past year. Analyze their scale and performance metrics.
| Host Name | Properties | Grossing Revenue | Stay Reviews | Avg Rating |
|---|---|---|---|---|
| Olivia | 9 | $256,680 | 180 | 4.75/5.0 |
| Elva Mae | 7 | $247,653 | 450 | 4.70/5.0 |
| Jasmin | 4 | $148,368 | 393 | 4.83/5.0 |
| Casa Ferta | 3 | $127,103 | 11 | 5.00/5.0 |
| Ben | 3 | $91,155 | 196 | 4.93/5.0 |
| Nash | 2 | $81,263 | 8 | 4.83/5.0 |
| James | 2 | $74,400 | 104 | 4.88/5.0 |
| Kathleen | 7 | $67,728 | 311 | 4.58/5.0 |
| Martin | 1 | $64,430 | 118 | 4.97/5.0 |
| Anna | 3 | $61,178 | 71 | 4.86/5.0 |
Analyzing the strategies of top hosts, such as their property selection, pricing, and guest communication, can offer valuable lessons for optimizing your own Airbnb operations in Calamba.
Dive Deeper: Advanced Calamba STR Market Data (2026)
Ready to unlock more insights? AirROI provides access to advanced metrics and comprehensive Airbnb data for Calamba. Explore detailed analytics beyond this report to refine your investment strategy, optimize pricing, and maximize your vacation rental profits.
Explore Advanced MetricsCalamba Short-Term Rental Market Composition (2026): Property & Room Types
Room Type Distribution
Property Type Distribution
Market Composition Insights for Calamba
- The Calamba Airbnb market composition is heavily skewed towards Entire Home/Apt listings, which make up 92.9% of the 268 active rentals. This indicates strong guest preference for privacy and space.
- Looking at the property type distribution in Calamba, House properties are the most common (52.2%), reflecting the local real estate landscape.
- Houses represent a significant 52.2% portion, catering likely to families or larger groups.
- The presence of 11.6% Hotel/Boutique listings indicates integration with traditional hospitality.
- Smaller segments like outdoor/unique, others (combined 5.6%) offer potential for unique stay experiences.
Calamba Airbnb Room Capacity Analysis (2026): Bedroom Distribution
Distribution of Listings by Number of Bedrooms
Room Capacity Insights for Calamba
- The dominant room capacity in Calamba is 1 bedroom listings, making up 22.8% of the market. This suggests a strong demand for properties suitable for couples or solo travelers.
- Together, 1 bedroom and 3 bedrooms properties represent 42.6% of the active Airbnb listings in Calamba, indicating a high concentration in these sizes.
- A significant 52.7% of listings offer 3+ bedrooms, catering to larger groups and families seeking more space in Calamba.
Calamba Vacation Rental Guest Capacity Trends (2026)
Distribution of Listings by Guest Capacity
Guest Capacity Insights for Calamba
- The most common guest capacity trend in Calamba vacation rentals is listings accommodating 8+ guests (57.5%). This suggests the primary traveler segment is likely larger groups.
- Properties designed for 8+ guests and 4 guests dominate the Calamba STR market, accounting for 68.7% of listings.
- 65.7% of properties accommodate 6+ guests, serving the market segment for larger families or group travel in Calamba.
- On average, properties in Calamba are equipped to host 6.2 guests.
Calamba Airbnb Booking Patterns (2026): Available vs. Booked Days
Available Days Distribution
Booked Days Distribution
Booking Pattern Insights for Calamba
- The most common availability pattern in Calamba falls within the 271-366 days range, representing 83.2% of listings. This suggests many properties have significant open periods on their calendars.
- Approximately 97.4% of listings show high availability (181+ days open annually), indicating potential for increased bookings or specific owner usage patterns.
- For booked days, the 31-90 days range is most frequent in Calamba (41%), reflecting common guest stay durations or potential owner blocking patterns.
- A notable 2.6% of properties secure long booking periods (181+ days booked per year), highlighting successful long-term rental strategies or significant owner usage.
Calamba Airbnb Minimum Stay Requirements Analysis
Distribution of Listings by Minimum Night Requirement
1 Night
236 listings
88.1% of total
2 Nights
12 listings
4.5% of total
3 Nights
4 listings
1.5% of total
7-29 Nights
6 listings
2.2% of total
30+ Nights
10 listings
3.7% of total
Key Insights
- The most prevalent minimum stay requirement in Calamba is 1 Night, adopted by 88.1% of listings. This highlights the market's preference for shorter, flexible bookings.
- A strong majority (92.6%) of the Calamba Airbnb data shows acceptance of very short stays (1-2 nights), indicating a dynamic, high-turnover market.
Recommendations
- Align with the market by considering a 1 Night minimum stay, as 88.1% of Calamba hosts use this setting.
- Adjust minimum nights based on seasonality – potentially shorter during low season and longer during peak demand periods in Calamba.
Calamba Airbnb Cancellation Policy Trends Analysis (2026)
Limited
6 listings
2.2% of total
Super Strict 30 Days
1 listings
0.4% of total
Flexible
60 listings
22.5% of total
Moderate
49 listings
18.4% of total
Firm
110 listings
41.2% of total
Strict
41 listings
15.4% of total
Cancellation Policy Insights for Calamba
- The prevailing Airbnb cancellation policy trend in Calamba is Firm, used by 41.2% of listings.
- A majority (56.6%) of hosts in Calamba utilize Firm or Strict policies, indicating a market where hosts prioritize booking security.
Recommendations for Hosts
- Consider adopting a Firm policy to align with the 41.2% market standard in Calamba.
- Regularly review your cancellation policy against competitors and market demand shifts in Calamba.
Calamba STR Booking Lead Time Analysis (2026)
Average Booking Lead Time by Month
Booking Lead Time Insights for Calamba
- The overall average booking lead time for vacation rentals in Calamba is 19 days.
- Guests book furthest in advance for stays during December (average 28 days), likely coinciding with peak travel demand or local events.
- The shortest booking windows occur for stays in June (average 14 days), indicating more last-minute travel plans during this time.
- Seasonally, Winter (24 days avg.) sees the longest lead times, while Summer (16 days avg.) has the shortest, reflecting typical travel planning cycles.
Recommendations for Hosts
- Use the overall average lead time (19 days) as a baseline for your pricing and availability strategy in Calamba.
- Target marketing efforts for the Winter season well in advance (at least 24 days) to capture early planners.
- Monitor your own booking lead times against these Calamba averages to identify opportunities for dynamic pricing adjustments.
Popular & Essential Airbnb Amenities in Calamba (2026)
Amenity Prevalence
Amenity Insights for Calamba
- Essential amenities in Calamba that guests expect include: Air conditioning, Kitchen. Lacking these (any) could significantly impact bookings.
- Popular amenities like Wifi, TV, Pool are common but not universal. Offering these can provide a competitive edge.
- A pool is a highly desired but not standard amenity, making it a key feature for attracting guests seeking leisure in Calamba.
- Warning: Wifi is not universally provided but is considered essential globally. Ensure reliable Wifi is offered.
Recommendations for Hosts
- Ensure your listing includes all essential amenities for Calamba: Air conditioning, Kitchen.
- Prioritize adding missing essentials: Air conditioning, Kitchen.
- Consider adding popular differentiators like Wifi or TV to increase appeal.
- Highlight unique or less common amenities you offer (e.g., hot tub, dedicated workspace, EV charger) in your listing description and photos.
- Regularly check competitor amenities in Calamba to stay competitive.
Calamba Airbnb Guest Demographics & Profile Analysis (2026)
Guest Profile Summary for Calamba
- The typical guest profile for Airbnb in Calamba consists of primarily domestic travelers (82%), often arriving from nearby Manila, typically belonging to the Post-2000s (Gen Z/Alpha) group (50%), primarily speaking English or Tagalog.
- Domestic travelers account for 82.4% of guests.
- Key international markets include Philippines (82.4%) and United States (7.5%).
- Top languages spoken are English (51.3%) followed by Tagalog (21.9%).
- A significant demographic segment is the Post-2000s (Gen Z/Alpha) group, representing 50% of guests.
Recommendations for Hosts
- Target domestic marketing efforts towards travelers from Manila and Quezon City.
- Tailor amenities and listing descriptions to appeal to the dominant Post-2000s (Gen Z/Alpha) demographic (e.g., highlight fast WiFi, smart home features, local guides).
- Highlight unique local experiences or amenities relevant to the primary guest profile.
- Consider seasonal promotions aligned with peak travel times for key origin markets.
Nearby Short-Term Rental Market Comparison
How does the Calamba Airbnb market stack up against its neighbors? Compare key performance metrics like average monthly revenue, ADR, and occupancy rates in surrounding areas to understand the broader regional STR landscape.
| Market | Active Properties | Monthly Revenue | Daily Rate | Avg. Occupancy |
|---|---|---|---|---|
| Bustos | 10 | $1,728 | $216.86 | 28% |
| Cabangan | 44 | $1,529 | $200.94 | 26% |
| Lian | 121 | $1,491 | $216.20 | 24% |
| Jalajala | 19 | $1,489 | $234.86 | 21% |
| Laoag | 17 | $1,412 | $158.39 | 33% |
| Beneg | 13 | $1,304 | $267.34 | 22% |
| Arew | 11 | $1,288 | $193.81 | 22% |
| Cabuyao | 25 | $1,202 | $114.93 | 36% |
| Binangonan | 49 | $1,191 | $135.12 | 29% |
| Porac | 51 | $1,157 | $203.91 | 21% |