San Pedro Airbnb Market Analysis 2026: Short Term Rental Data & Vacation Rental Statistics in Laguna, Philippines
Is Airbnb profitable in San Pedro in 2026? Explore comprehensive Airbnb analytics for San Pedro, Laguna, Philippines to uncover income potential. This 2026 STR market report for San Pedro, based on AirROI data from February 2025 to January 2026, reveals key trends in the niche market of 19 active listings.
Whether you're considering an Airbnb investment in San Pedro, optimizing your existing vacation rental, or exploring rental arbitrage opportunities, understanding the San Pedro Airbnb data is crucial. Leveraging the low regulation environment is key to maximizing your short term rental income potential. Let's dive into the specifics.
Key San Pedro Airbnb Performance Metrics Overview
Monthly Airbnb Revenue Variations & Income Potential in San Pedro (2026)
Understanding the monthly revenue variations for Airbnb listings in San Pedro is key to maximizing your short term rental income potential. Seasonality significantly impacts earnings. Our analysis, based on data from the past 12 months, shows that the peak revenue month for STRs in San Pedro is typically December, while August often presents the lowest earnings, highlighting opportunities for strategic pricing adjustments during shoulder and low seasons. Explore the typical Airbnb income in San Pedro across different performance tiers:
- Best-in-class properties (Top 10%) achieve $766+ monthly, often utilizing dynamic pricing and superior guest experiences.
- Strong performing properties (Top 25%) earn $636 or more, indicating effective management and desirable locations/amenities.
- Typical properties (Median) generate around $391 per month, representing the average market performance.
- Entry-level properties (Bottom 25%) see earnings around $210, often with potential for optimization.
Average Monthly Airbnb Earnings Trend in San Pedro
San Pedro Airbnb Occupancy Rate Trends (2026)
Maximize your bookings by understanding the San Pedro STR occupancy trends. Seasonal demand shifts significantly influence how often properties are booked. Typically, Aprilsees the highest demand (peak season occupancy), while July experiences the lowest (low season). Effective strategies, like adjusting minimum stays or offering promotions, can boost occupancy during slower periods. Here's how different property tiers perform in San Pedro:
- Best-in-class properties (Top 10%) achieve 76%+ occupancy, indicating high desirability and potentially optimized availability.
- Strong performing properties (Top 25%) maintain 58% or higher occupancy, suggesting good market fit and guest satisfaction.
- Typical properties (Median) have an occupancy rate around 32%.
- Entry-level properties (Bottom 25%) average 17% occupancy, potentially facing higher vacancy.
Average Monthly Occupancy Rate Trend in San Pedro
Average Daily Rate (ADR) Airbnb Trends in San Pedro (2026)
Effective short term rental pricing strategy in San Pedro involves understanding monthly ADR fluctuations. The Average Daily Rate (ADR) for Airbnb in San Pedro typically peaks in June and dips lowest during January. Leveraging Airbnb dynamic pricing tools or strategies based on this seasonality can significantly boost revenue. Here's a look at the typical nightly rates achieved:
- Best-in-class properties (Top 10%) command rates of $106+ per night, often due to premium features or locations.
- Strong performing properties (Top 25%) achieve nightly rates of $58 or more.
- Typical properties (Median) charge around $28 per night.
- Entry-level properties (Bottom 25%) earn around $24 per night.
Average Daily Rate (ADR) Trend by Month in San Pedro
Get Live San Pedro Market Intelligence 👇

Explore Real-time Analytics
Airbnb Seasonality Analysis & Trends in San Pedro (2026)
Peak Season (December, April, May)
- Revenue averages $605 per month
- Occupancy rates average 44.3%
- Daily rates average $54
Shoulder Season
- Revenue averages $441 per month
- Occupancy maintains around 39.3%
- Daily rates hold near $52
Low Season (July, August, September)
- Revenue drops to average $363 per month
- Occupancy decreases to average 33.3%
- Daily rates adjust to average $56
Seasonality Insights for San Pedro
- The Airbnb seasonality in San Pedro shows moderate seasonality with distinct peak and low periods. While the sections above show seasonal averages, it's also insightful to look at the extremes:
- During the high season, the absolute peak month showcases San Pedro's highest earning potential, with monthly revenues capable of climbing to $661, occupancy reaching a high of 47.7%, and ADRs peaking at $60.
- Conversely, the slowest single month of the year, typically falling within the low season, marks the market's lowest point. In this month, revenue might dip to $351, occupancy could drop to 29.9%, and ADRs may adjust down to $45.
- Understanding both the seasonal averages and these monthly peaks and troughs in revenue, occupancy, and ADR is crucial for maximizing your Airbnb profit potential in San Pedro.
Seasonal Strategies for Maximizing Profit
- Peak Season: Maximize revenue through premium pricing and potentially longer minimum stays. Ensure high availability.
- Low Season: Offer competitive pricing, special promotions (e.g., extended stay discounts), and flexible cancellation policies. Target off-season travelers like remote workers or budget-conscious guests.
- Shoulder Seasons: Implement dynamic pricing that balances peak and low rates. Target weekend travelers or specific events. Offer slightly more flexible terms than peak season.
- Regularly analyze your own performance against these San Pedro seasonality benchmarks and adjust your pricing and availability strategy accordingly.
Best Areas for Airbnb Investment in San Pedro (2026)
Exploring the top neighborhoods for short-term rentals in San Pedro? This section highlights key areas, outlining why they are attractive for hosts and guests, along with notable local attractions. Consider these locations based on your target guest profile and investment strategy.
| Neighborhood / Area | Why Host Here? (Target Guests & Appeal) | Key Attractions & Landmarks |
|---|---|---|
| Pahimis Coffee Festival | A cultural event celebrating the local coffee industry, attracting coffee enthusiasts and tourists interested in agriculture and local produce. | Pahimis Festival activities, Coffee farms, Local markets |
| Lake Sampaloc | A scenic lake perfect for families and couples, providing recreational activities such as boating, picnicking, and scenic walks. | Lake Sampaloc, Riverside parks, Boating activities |
| Caliraya Lake | A popular spot for water sports and outdoor activities, attracting adventure seekers and nature lovers. | Caliraya Lake water sports, Camping sites, Scenic views |
| San Pedro Town Proper | The heart of the town with access to local cuisine, shopping, and cultural sites, ideal for travelers wanting an authentic experience. | San Pedro Cathedral, Food markets, Local shops |
| Eco-park | A green sanctuary for nature lovers, perfect for families and those wishing to enjoy outdoor recreational activities. | Nature trails, Picnic areas, Wildlife viewing |
| Tres Rios | Known for its natural springs and serene environment, it attracts visitors looking for relaxation and leisure activities. | Natural springs, Hiking areas, Picnic spots |
| Molino Road | A busy commercial area with restaurants, shops, and access to public transport, suitable for business travelers and tourists alike. | Shopping centers, Local eateries, Access to transport |
| Santo Niño de Caloocan | A historic site with cultural significance, attracting visitors interested in history and local traditions. | Santo Niño Church, Cultural festivities, Local heritage sites |
Understanding Airbnb License Requirements & STR Laws in San Pedro (2026)
While San Pedro, Laguna, Philippines currently shows low STR regulations, specific Airbnb license requirements might still exist or change. Always verify the latest short term rental regulations and Airbnb license requirements directly with local government authorities for San Pedro to ensure full compliance before hosting.
(Source: AirROI data, 2026, finding no licensed listings among those analyzed)
Top Performing Airbnb Properties in San Pedro (2026)
Benchmark your potential! Explore examples of top-performing Airbnb properties in San Pedrobased on Trailing Twelve Month (TTM) revenue. Analyze their characteristics, revenue, occupancy rate, and ADR to understand what drives success in this market.

Casa Luisa- Beautiful Pool Resort 40min frm Makati
Entire Place • 3 bedrooms
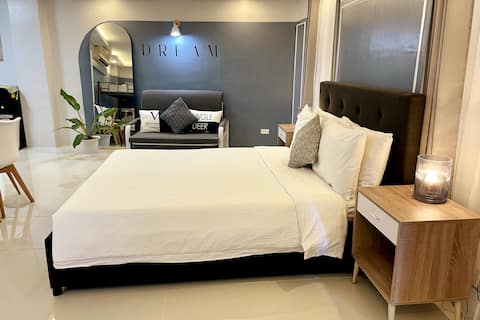
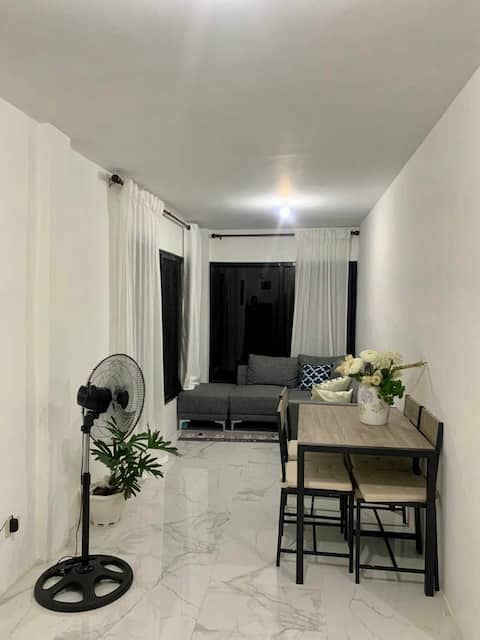
DREAM Studio Apartment 39sqm
Entire Place • N/A
Guest House at San Pedro
Entire Place • 1 bedroom

FAITH 1-Bedroom Apartment 42sqm
Entire Place • 1 bedroom

HOPE Studio Apartment with bunked room 39sqm
Entire Place • 1 bedroom

LOVE Spacious Studio Apartment 42sqm
Entire Place • N/A
Note: Performance varies based on location, size, amenities, seasonality, and management quality. Data reflects the past 12 months.
Top Performing Airbnb Hosts in San Pedro (2026)
Learn from the best! This table showcases top-performing Airbnb hosts in San Pedro based on the number of properties managed and estimated total revenue over the past year. Analyze their scale and performance metrics.
| Host Name | Properties | Grossing Revenue | Stay Reviews | Avg Rating |
|---|---|---|---|---|
| Raph | 4 | $25,694 | 415 | 4.83/5.0 |
| Jenilee | 1 | $14,757 | 134 | 4.78/5.0 |
| Rene | 3 | $9,271 | 165 | 4.64/5.0 |
| Cesar | 1 | $6,070 | 132 | 4.97/5.0 |
| Rosie | 1 | $4,635 | 70 | 4.91/5.0 |
| Daphne | 1 | $3,280 | 17 | 5.00/5.0 |
| Kaila Sharlene | 3 | $2,751 | 76 | 4.94/5.0 |
| Leny | 1 | $1,507 | 11 | 4.73/5.0 |
| Mary | 1 | $1,145 | 2 | Not Rated |
| Josephine | 1 | $1,140 | 5 | 5.00/5.0 |
Analyzing the strategies of top hosts, such as their property selection, pricing, and guest communication, can offer valuable lessons for optimizing your own Airbnb operations in San Pedro.
Dive Deeper: Advanced San Pedro STR Market Data (2026)
Ready to unlock more insights? AirROI provides access to advanced metrics and comprehensive Airbnb data for San Pedro. Explore detailed analytics beyond this report to refine your investment strategy, optimize pricing, and maximize your vacation rental profits.
Explore Advanced MetricsSan Pedro Short-Term Rental Market Composition (2026): Property & Room Types
Room Type Distribution
Property Type Distribution
Market Composition Insights for San Pedro
- The San Pedro Airbnb market composition is heavily skewed towards Entire Home/Apt listings, which make up 78.9% of the 19 active rentals. This indicates strong guest preference for privacy and space.
- Looking at the property type distribution in San Pedro, House properties are the most common (63.2%), reflecting the local real estate landscape.
- Houses represent a significant 63.2% portion, catering likely to families or larger groups.
San Pedro Airbnb Room Capacity Analysis (2026): Bedroom Distribution
Distribution of Listings by Number of Bedrooms
Room Capacity Insights for San Pedro
- The dominant room capacity in San Pedro is 1 bedroom listings, making up 26.3% of the market. This suggests a strong demand for properties suitable for couples or solo travelers.
- Together, 1 bedroom and 2 bedrooms properties represent 52.6% of the active Airbnb listings in San Pedro, indicating a high concentration in these sizes.
- A significant 21.1% of listings offer 3+ bedrooms, catering to larger groups and families seeking more space in San Pedro.
San Pedro Vacation Rental Guest Capacity Trends (2026)
Distribution of Listings by Guest Capacity
Guest Capacity Insights for San Pedro
- The most common guest capacity trend in San Pedro vacation rentals is listings accommodating 8+ guests (31.6%). This suggests the primary traveler segment is likely larger groups.
- Properties designed for 8+ guests and 4 guests dominate the San Pedro STR market, accounting for 52.7% of listings.
- 36.9% of properties accommodate 6+ guests, serving the market segment for larger families or group travel in San Pedro.
- On average, properties in San Pedro are equipped to host 4.5 guests.
San Pedro Airbnb Booking Patterns (2026): Available vs. Booked Days
Available Days Distribution
Booked Days Distribution
Booking Pattern Insights for San Pedro
- The most common availability pattern in San Pedro falls within the 271-366 days range, representing 57.9% of listings. This suggests many properties have significant open periods on their calendars.
- Approximately 73.7% of listings show high availability (181+ days open annually), indicating potential for increased bookings or specific owner usage patterns.
- For booked days, the 1-30 days range is most frequent in San Pedro (31.6%), reflecting common guest stay durations or potential owner blocking patterns.
- A notable 26.3% of properties secure long booking periods (181+ days booked per year), highlighting successful long-term rental strategies or significant owner usage.
San Pedro Airbnb Minimum Stay Requirements Analysis
Distribution of Listings by Minimum Night Requirement
1 Night
18 listings
94.7% of total
2 Nights
1 listings
5.3% of total
Key Insights
- The most prevalent minimum stay requirement in San Pedro is 1 Night, adopted by 94.7% of listings. This highlights the market's preference for shorter, flexible bookings.
- A strong majority (100.0%) of the San Pedro Airbnb data shows acceptance of very short stays (1-2 nights), indicating a dynamic, high-turnover market.
Recommendations
- Align with the market by considering a 1 Night minimum stay, as 94.7% of San Pedro hosts use this setting.
- Adjust minimum nights based on seasonality – potentially shorter during low season and longer during peak demand periods in San Pedro.
San Pedro Airbnb Cancellation Policy Trends Analysis (2026)
Flexible
7 listings
36.8% of total
Moderate
3 listings
15.8% of total
Firm
9 listings
47.4% of total
Cancellation Policy Insights for San Pedro
- The prevailing Airbnb cancellation policy trend in San Pedro is Firm, used by 47.4% of listings.
- There's a relatively balanced mix between guest-friendly (52.6%) and stricter (47.4%) policies, offering choices for different guest needs.
Recommendations for Hosts
- Consider adopting a Firm policy to align with the 47.4% market standard in San Pedro.
- Regularly review your cancellation policy against competitors and market demand shifts in San Pedro.
San Pedro STR Booking Lead Time Analysis (2026)
Average Booking Lead Time by Month
Booking Lead Time Insights for San Pedro
- The overall average booking lead time for vacation rentals in San Pedro is 27 days.
- Guests book furthest in advance for stays during April (average 47 days), likely coinciding with peak travel demand or local events.
- The shortest booking windows occur for stays in August (average 12 days), indicating more last-minute travel plans during this time.
- Seasonally, Spring (33 days avg.) sees the longest lead times, while Winter (26 days avg.) has the shortest, reflecting typical travel planning cycles.
Recommendations for Hosts
- Use the overall average lead time (27 days) as a baseline for your pricing and availability strategy in San Pedro.
- For April stays, consider implementing length-of-stay discounts or slightly higher rates for bookings made less than 47 days out to capitalize on advance planning.
- During August, focus on last-minute booking availability and promotions, as guests book with very short notice (12 days avg.).
- Target marketing efforts for the Spring season well in advance (at least 33 days) to capture early planners.
- Monitor your own booking lead times against these San Pedro averages to identify opportunities for dynamic pricing adjustments.
Popular & Essential Airbnb Amenities in San Pedro (2026)
Amenity Prevalence
Amenity Insights for San Pedro
- Essential amenities in San Pedro that guests expect include: Wifi, Kitchen, Air conditioning. Lacking these (any) could significantly impact bookings.
- Popular amenities like TV, Free parking on premises, Bed linens are common but not universal. Offering these can provide a competitive edge.
Recommendations for Hosts
- Ensure your listing includes all essential amenities for San Pedro: Wifi, Kitchen, Air conditioning.
- Consider adding popular differentiators like TV or Free parking on premises to increase appeal.
- Highlight unique or less common amenities you offer (e.g., hot tub, dedicated workspace, EV charger) in your listing description and photos.
- Regularly check competitor amenities in San Pedro to stay competitive.
San Pedro Airbnb Guest Demographics & Profile Analysis (2026)
Guest Profile Summary for San Pedro
- The typical guest profile for Airbnb in San Pedro consists of primarily domestic travelers (72%), often arriving from nearby Quezon City, typically belonging to the Post-2000s (Gen Z/Alpha) group (50%), primarily speaking English or Filipino.
- Domestic travelers account for 72.3% of guests.
- Key international markets include Philippines (72.3%) and United States (12.8%).
- Top languages spoken are English (56.5%) followed by Filipino (19.6%).
- A significant demographic segment is the Post-2000s (Gen Z/Alpha) group, representing 50% of guests.
Recommendations for Hosts
- Target domestic marketing efforts towards travelers from Quezon City and Bacoor.
- Tailor amenities and listing descriptions to appeal to the dominant Post-2000s (Gen Z/Alpha) demographic (e.g., highlight fast WiFi, smart home features, local guides).
- Highlight unique local experiences or amenities relevant to the primary guest profile.
- Consider seasonal promotions aligned with peak travel times for key origin markets.
Nearby Short-Term Rental Market Comparison
How does the San Pedro Airbnb market stack up against its neighbors? Compare key performance metrics like average monthly revenue, ADR, and occupancy rates in surrounding areas to understand the broader regional STR landscape.
| Market | Active Properties | Monthly Revenue | Daily Rate | Avg. Occupancy |
|---|---|---|---|---|
| Bustos | 10 | $1,728 | $216.86 | 28% |
| Cabangan | 44 | $1,529 | $200.94 | 26% |
| Lian | 121 | $1,491 | $216.20 | 24% |
| Jalajala | 19 | $1,489 | $234.86 | 21% |
| Laoag | 17 | $1,412 | $158.39 | 33% |
| Beneg | 13 | $1,304 | $267.34 | 22% |
| Arew | 11 | $1,288 | $193.81 | 22% |
| Cabuyao | 25 | $1,202 | $114.93 | 36% |
| Binangonan | 49 | $1,191 | $135.12 | 29% |
| Porac | 51 | $1,157 | $203.91 | 21% |