Marikina Airbnb Market Analysis 2026: Short Term Rental Data & Vacation Rental Statistics in Metro Manila, Philippines
Is Airbnb profitable in Marikina in 2026? Explore comprehensive Airbnb analytics for Marikina, Metro Manila, Philippines to uncover income potential. This 2026 STR market report for Marikina, based on AirROI data from February 2025 to January 2026, reveals key trends in the niche market of 77 active listings.
Whether you're considering an Airbnb investment in Marikina, optimizing your existing vacation rental, or exploring rental arbitrage opportunities, understanding the Marikina Airbnb data is crucial. Leveraging the low regulation environment is key to maximizing your short term rental income potential. Let's dive into the specifics.
Key Marikina Airbnb Performance Metrics Overview
Monthly Airbnb Revenue Variations & Income Potential in Marikina (2026)
Understanding the monthly revenue variations for Airbnb listings in Marikina is key to maximizing your short term rental income potential. Seasonality significantly impacts earnings. Our analysis, based on data from the past 12 months, shows that the peak revenue month for STRs in Marikina is typically December, while January often presents the lowest earnings, highlighting opportunities for strategic pricing adjustments during shoulder and low seasons. Explore the typical Airbnb income in Marikina across different performance tiers:
- Best-in-class properties (Top 10%) achieve $1,110+ monthly, often utilizing dynamic pricing and superior guest experiences.
- Strong performing properties (Top 25%) earn $720 or more, indicating effective management and desirable locations/amenities.
- Typical properties (Median) generate around $367 per month, representing the average market performance.
- Entry-level properties (Bottom 25%) see earnings around $154, often with potential for optimization.
Average Monthly Airbnb Earnings Trend in Marikina
Marikina Airbnb Occupancy Rate Trends (2026)
Maximize your bookings by understanding the Marikina STR occupancy trends. Seasonal demand shifts significantly influence how often properties are booked. Typically, Aprilsees the highest demand (peak season occupancy), while October experiences the lowest (low season). Effective strategies, like adjusting minimum stays or offering promotions, can boost occupancy during slower periods. Here's how different property tiers perform in Marikina:
- Best-in-class properties (Top 10%) achieve 81%+ occupancy, indicating high desirability and potentially optimized availability.
- Strong performing properties (Top 25%) maintain 62% or higher occupancy, suggesting good market fit and guest satisfaction.
- Typical properties (Median) have an occupancy rate around 32%.
- Entry-level properties (Bottom 25%) average 12% occupancy, potentially facing higher vacancy.
Average Monthly Occupancy Rate Trend in Marikina
Average Daily Rate (ADR) Airbnb Trends in Marikina (2026)
Effective short term rental pricing strategy in Marikina involves understanding monthly ADR fluctuations. The Average Daily Rate (ADR) for Airbnb in Marikina typically peaks in September and dips lowest during January. Leveraging Airbnb dynamic pricing tools or strategies based on this seasonality can significantly boost revenue. Here's a look at the typical nightly rates achieved:
- Best-in-class properties (Top 10%) command rates of $71+ per night, often due to premium features or locations.
- Strong performing properties (Top 25%) achieve nightly rates of $47 or more.
- Typical properties (Median) charge around $34 per night.
- Entry-level properties (Bottom 25%) earn around $26 per night.
Average Daily Rate (ADR) Trend by Month in Marikina
Get Live Marikina Market Intelligence 👇

Explore Real-time Analytics
Airbnb Seasonality Analysis & Trends in Marikina (2026)
Peak Season (December, August, March)
- Revenue averages $673 per month
- Occupancy rates average 38.7%
- Daily rates average $48
Shoulder Season
- Revenue averages $553 per month
- Occupancy maintains around 40.1%
- Daily rates hold near $49
Low Season (January, February, October)
- Revenue drops to average $440 per month
- Occupancy decreases to average 34.1%
- Daily rates adjust to average $47
Seasonality Insights for Marikina
- The Airbnb seasonality in Marikina shows moderate seasonality with distinct peak and low periods. While the sections above show seasonal averages, it's also insightful to look at the extremes:
- During the high season, the absolute peak month showcases Marikina's highest earning potential, with monthly revenues capable of climbing to $758, occupancy reaching a high of 44.2%, and ADRs peaking at $50.
- Conversely, the slowest single month of the year, typically falling within the low season, marks the market's lowest point. In this month, revenue might dip to $432, occupancy could drop to 30.5%, and ADRs may adjust down to $46.
- Understanding both the seasonal averages and these monthly peaks and troughs in revenue, occupancy, and ADR is crucial for maximizing your Airbnb profit potential in Marikina.
Seasonal Strategies for Maximizing Profit
- Peak Season: Maximize revenue through premium pricing and potentially longer minimum stays. Ensure high availability.
- Low Season: Offer competitive pricing, special promotions (e.g., extended stay discounts), and flexible cancellation policies. Target off-season travelers like remote workers or budget-conscious guests.
- Shoulder Seasons: Implement dynamic pricing that balances peak and low rates. Target weekend travelers or specific events. Offer slightly more flexible terms than peak season.
- Regularly analyze your own performance against these Marikina seasonality benchmarks and adjust your pricing and availability strategy accordingly.
Best Areas for Airbnb Investment in Marikina (2026)
Exploring the top neighborhoods for short-term rentals in Marikina? This section highlights key areas, outlining why they are attractive for hosts and guests, along with notable local attractions. Consider these locations based on your target guest profile and investment strategy.
| Neighborhood / Area | Why Host Here? (Target Guests & Appeal) | Key Attractions & Landmarks |
|---|---|---|
| Concepcion Uno | A bustling area with a mix of residential and commercial spaces, ideal for both short-term and long-term stays. Close to shops, parks, and public transport. | Concepcion Integrated School, Concepcion Park, Robinsons Place Marikina, Marikina Sports Center, Marikina River Park |
| Santolan | A vibrant barangay known for its accessibility to major roads. Popular among travelers due to its proximity to Ortigas CBD and various dining options. | Santolan Town Plaza, Himalaya Wellness Center, Pasig River, SM Cherry Antipolo, Hayward Heights |
| Marikina Public Market | A lively local market area that attracts both locals and tourists, offering authentic Filipino food and handicrafts. Great for guests seeking local experiences. | Marikina Public Market, Makati City Gym, Bamboo Organ, Sampaguita Gardens, Local Food Stalls |
| Barangay San Roque | Residential yet close to many educational institutions like the Marikina Science High School, making it attractive for families and students. | San Roque Elementary School, Marikina Cathedral, Valley Golf and Country Club, Marikina River, Local Parks |
| Bayan-Bayanan | Known for its quiet neighborhoods and proximity to recreational parks, it’s perfect for guests looking for a laid-back atmosphere amidst nature. | People's Park, Bayan-Bayanan River, Marikina Eco Trail, St. Paul College of Marikina, Local Gardens |
| Parang | This area features a strong community spirit and various amenities, including schools and shopping areas, making it appealing for families. | Parang Elementary School, Local Markets, Outdoor Basketball Courts, Marikina River, Community Parks |
| Cupang | A peaceful place with residential areas and easy access to commercial establishments, ideal for long-term guests or business travelers. | Cupang Village Park, Access to Major Highways, Restaurants and Cafes, Markets, Marikina River |
| Kakaibang Pampang | An emerging area that showcases local Filipino culture and hospitality, great for those wanting to experience a deeper dive into the region. | Local Festivals, Marikina River Park, Community Events, Nearby Traditional Markets, Local Cuisine Spots |
Understanding Airbnb License Requirements & STR Laws in Marikina (2026)
While Marikina, Metro Manila, Philippines currently shows low STR regulations, specific Airbnb license requirements might still exist or change. Always verify the latest short term rental regulations and Airbnb license requirements directly with local government authorities for Marikina to ensure full compliance before hosting.
(Source: AirROI data, 2026, finding no licensed listings among those analyzed)
Top Performing Airbnb Properties in Marikina (2026)
Benchmark your potential! Explore examples of top-performing Airbnb properties in Marikinabased on Trailing Twelve Month (TTM) revenue. Analyze their characteristics, revenue, occupancy rate, and ADR to understand what drives success in this market.

Backspace Hideout (21hrs)
Entire Place • 2 bedrooms
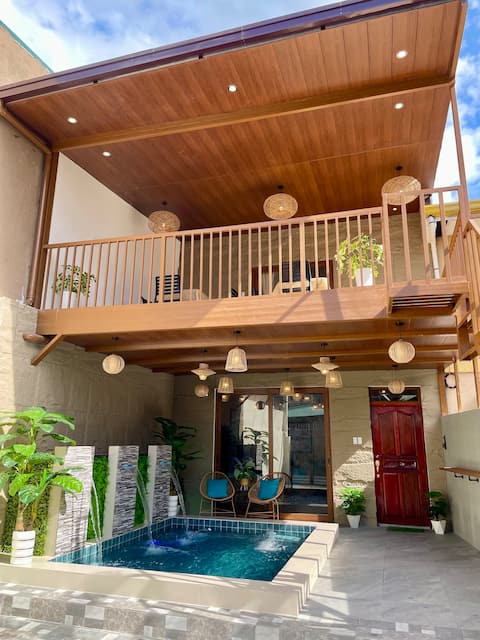
The Tropical Villa (w/ Pool)
Entire Place • 3 bedrooms
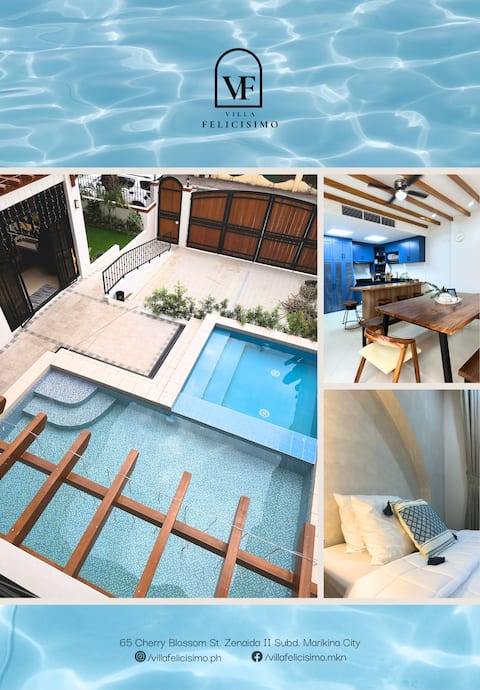
Villa Felicisimo
Entire Place • 2 bedrooms

Cozy Rooms 1 & 2 - with private outdoor tub
Entire Place • 2 bedrooms
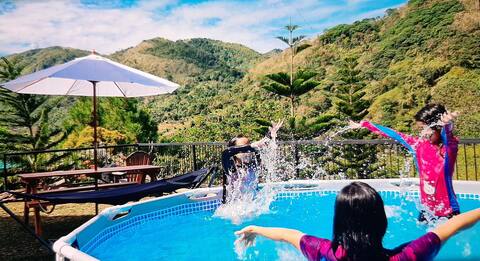
Best View! La Terraza Campsite in Tanay, Rizal
Entire Place • 1 bedroom

2BR Nice City View near SM Marikina & Ayala Feliz
Entire Place • 2 bedrooms
Note: Performance varies based on location, size, amenities, seasonality, and management quality. Data reflects the past 12 months.
Top Performing Airbnb Hosts in Marikina (2026)
Learn from the best! This table showcases top-performing Airbnb hosts in Marikina based on the number of properties managed and estimated total revenue over the past year. Analyze their scale and performance metrics.
| Host Name | Properties | Grossing Revenue | Stay Reviews | Avg Rating |
|---|---|---|---|---|
| Carmina | 5 | $58,138 | 394 | 4.94/5.0 |
| Kim | 1 | $25,881 | 5 | 5.00/5.0 |
| Zen | 1 | $20,849 | 20 | 4.80/5.0 |
| Karen | 2 | $15,321 | 227 | 4.80/5.0 |
| Pogs | 1 | $13,494 | 126 | 4.94/5.0 |
| Angel | 1 | $12,519 | 41 | 4.88/5.0 |
| Anna Rhea | 1 | $11,148 | 12 | 4.92/5.0 |
| Brent | 1 | $10,189 | 29 | 4.62/5.0 |
| Harold | 1 | $9,291 | 44 | 4.89/5.0 |
| Rich | 3 | $9,246 | 95 | 4.71/5.0 |
Analyzing the strategies of top hosts, such as their property selection, pricing, and guest communication, can offer valuable lessons for optimizing your own Airbnb operations in Marikina.
Dive Deeper: Advanced Marikina STR Market Data (2026)
Ready to unlock more insights? AirROI provides access to advanced metrics and comprehensive Airbnb data for Marikina. Explore detailed analytics beyond this report to refine your investment strategy, optimize pricing, and maximize your vacation rental profits.
Explore Advanced MetricsMarikina Short-Term Rental Market Composition (2026): Property & Room Types
Room Type Distribution
Property Type Distribution
Market Composition Insights for Marikina
- The Marikina Airbnb market composition is heavily skewed towards Entire Home/Apt listings, which make up 83.1% of the 77 active rentals. This indicates strong guest preference for privacy and space.
- Looking at the property type distribution in Marikina, Apartment/Condo properties are the most common (62.3%), reflecting the local real estate landscape.
- Houses represent a significant 22.1% portion, catering likely to families or larger groups.
- The presence of 10.4% Hotel/Boutique listings indicates integration with traditional hospitality.
Marikina Airbnb Room Capacity Analysis (2026): Bedroom Distribution
Distribution of Listings by Number of Bedrooms
Room Capacity Insights for Marikina
- The dominant room capacity in Marikina is 1 bedroom listings, making up 40.3% of the market. This suggests a strong demand for properties suitable for couples or solo travelers.
- Together, 1 bedroom and 2 bedrooms properties represent 76.7% of the active Airbnb listings in Marikina, indicating a high concentration in these sizes.
- Listings with 3+ bedrooms (7.8%) represent a smaller niche, potentially indicating an underserved market for larger group accommodations in Marikina.
Marikina Vacation Rental Guest Capacity Trends (2026)
Distribution of Listings by Guest Capacity
Guest Capacity Insights for Marikina
- The most common guest capacity trend in Marikina vacation rentals is listings accommodating 2 guests (31.2%). This suggests the primary traveler segment is likely couples or solo travelers.
- Properties designed for 2 guests and 4 guests dominate the Marikina STR market, accounting for 55.9% of listings.
- 22.1% of properties accommodate 6+ guests, serving the market segment for larger families or group travel in Marikina.
- On average, properties in Marikina are equipped to host 3.8 guests.
Marikina Airbnb Booking Patterns (2026): Available vs. Booked Days
Available Days Distribution
Booked Days Distribution
Booking Pattern Insights for Marikina
- The most common availability pattern in Marikina falls within the 271-366 days range, representing 61% of listings. This suggests many properties have significant open periods on their calendars.
- Approximately 83.1% of listings show high availability (181+ days open annually), indicating potential for increased bookings or specific owner usage patterns.
- For booked days, the 31-90 days range is most frequent in Marikina (32.5%), reflecting common guest stay durations or potential owner blocking patterns.
- A notable 19.5% of properties secure long booking periods (181+ days booked per year), highlighting successful long-term rental strategies or significant owner usage.
Marikina Airbnb Minimum Stay Requirements Analysis
Distribution of Listings by Minimum Night Requirement
1 Night
31 listings
40.3% of total
2 Nights
12 listings
15.6% of total
3 Nights
5 listings
6.5% of total
4-6 Nights
13 listings
16.9% of total
7-29 Nights
6 listings
7.8% of total
30+ Nights
10 listings
13% of total
Key Insights
- The most prevalent minimum stay requirement in Marikina is 1 Night, adopted by 40.3% of listings. This highlights the market's preference for shorter, flexible bookings.
- A significant segment (13%) caters to monthly stays (30+ nights) in Marikina, pointing to opportunities in the extended-stay market.
Recommendations
- Align with the market by considering a 1 Night minimum stay, as 40.3% of Marikina hosts use this setting.
- Explore offering discounts for stays of 30+ nights to attract the 13% of the market seeking extended stays.
- Adjust minimum nights based on seasonality – potentially shorter during low season and longer during peak demand periods in Marikina.
Marikina Airbnb Cancellation Policy Trends Analysis (2026)
Limited
1 listings
1.3% of total
Flexible
25 listings
32.5% of total
Moderate
21 listings
27.3% of total
Firm
23 listings
29.9% of total
Strict
7 listings
9.1% of total
Cancellation Policy Insights for Marikina
- The prevailing Airbnb cancellation policy trend in Marikina is Flexible, used by 32.5% of listings.
- There's a relatively balanced mix between guest-friendly (59.8%) and stricter (39.0%) policies, offering choices for different guest needs.
- Strict cancellation policies are quite rare (9.1%), potentially making listings with this policy less competitive unless justified by high demand or property type.
Recommendations for Hosts
- Consider adopting a Flexible policy to align with the 32.5% market standard in Marikina.
- Using a Strict policy might deter some guests, as only 9.1% of listings use it. Evaluate if potential revenue protection outweighs possible lower booking rates.
- Regularly review your cancellation policy against competitors and market demand shifts in Marikina.
Marikina STR Booking Lead Time Analysis (2026)
Average Booking Lead Time by Month
Booking Lead Time Insights for Marikina
- The overall average booking lead time for vacation rentals in Marikina is 26 days.
- Guests book furthest in advance for stays during January (average 35 days), likely coinciding with peak travel demand or local events.
- The shortest booking windows occur for stays in September (average 20 days), indicating more last-minute travel plans during this time.
- Seasonally, Winter (30 days avg.) sees the longest lead times, while Spring (22 days avg.) has the shortest, reflecting typical travel planning cycles.
Recommendations for Hosts
- Use the overall average lead time (26 days) as a baseline for your pricing and availability strategy in Marikina.
- Target marketing efforts for the Winter season well in advance (at least 30 days) to capture early planners.
- Monitor your own booking lead times against these Marikina averages to identify opportunities for dynamic pricing adjustments.
Popular & Essential Airbnb Amenities in Marikina (2026)
Amenity Prevalence
Amenity Insights for Marikina
- Essential amenities in Marikina that guests expect include: Air conditioning. Lacking these (this) could significantly impact bookings.
- Popular amenities like TV, Wifi, Fire extinguisher are common but not universal. Offering these can provide a competitive edge.
- Warning: Wifi is not universally provided but is considered essential globally. Ensure reliable Wifi is offered.
Recommendations for Hosts
- Ensure your listing includes all essential amenities for Marikina: Air conditioning.
- Prioritize adding missing essentials: Air conditioning.
- Consider adding popular differentiators like TV or Wifi to increase appeal.
- Highlight unique or less common amenities you offer (e.g., hot tub, dedicated workspace, EV charger) in your listing description and photos.
- Regularly check competitor amenities in Marikina to stay competitive.
Marikina Airbnb Guest Demographics & Profile Analysis (2026)
Guest Profile Summary for Marikina
- The typical guest profile for Airbnb in Marikina consists of primarily domestic travelers (67%), often arriving from nearby Quezon City, typically belonging to the Post-2000s (Gen Z/Alpha) group (50%), primarily speaking English or Filipino.
- Domestic travelers account for 66.8% of guests.
- Key international markets include Philippines (66.8%) and United States (11.1%).
- Top languages spoken are English (49.8%) followed by Filipino (20.8%).
- A significant demographic segment is the Post-2000s (Gen Z/Alpha) group, representing 50% of guests.
Recommendations for Hosts
- Target domestic marketing efforts towards travelers from Quezon City and Marikina.
- Tailor amenities and listing descriptions to appeal to the dominant Post-2000s (Gen Z/Alpha) demographic (e.g., highlight fast WiFi, smart home features, local guides).
- Highlight unique local experiences or amenities relevant to the primary guest profile.
- Consider seasonal promotions aligned with peak travel times for key origin markets.
Nearby Short-Term Rental Market Comparison
How does the Marikina Airbnb market stack up against its neighbors? Compare key performance metrics like average monthly revenue, ADR, and occupancy rates in surrounding areas to understand the broader regional STR landscape.
| Market | Active Properties | Monthly Revenue | Daily Rate | Avg. Occupancy |
|---|---|---|---|---|
| Bustos | 10 | $1,728 | $216.86 | 28% |
| Cabangan | 44 | $1,529 | $200.94 | 26% |
| Lian | 121 | $1,491 | $216.20 | 24% |
| Jalajala | 19 | $1,489 | $234.86 | 21% |
| Laoag | 17 | $1,412 | $158.39 | 33% |
| Beneg | 13 | $1,304 | $267.34 | 22% |
| Arew | 11 | $1,288 | $193.81 | 22% |
| Cabuyao | 25 | $1,202 | $114.93 | 36% |
| Binangonan | 49 | $1,191 | $135.12 | 29% |
| Porac | 51 | $1,157 | $203.91 | 21% |