Pateros Airbnb Market Analysis 2026: Short Term Rental Data & Vacation Rental Statistics in Metro Manila, Philippines
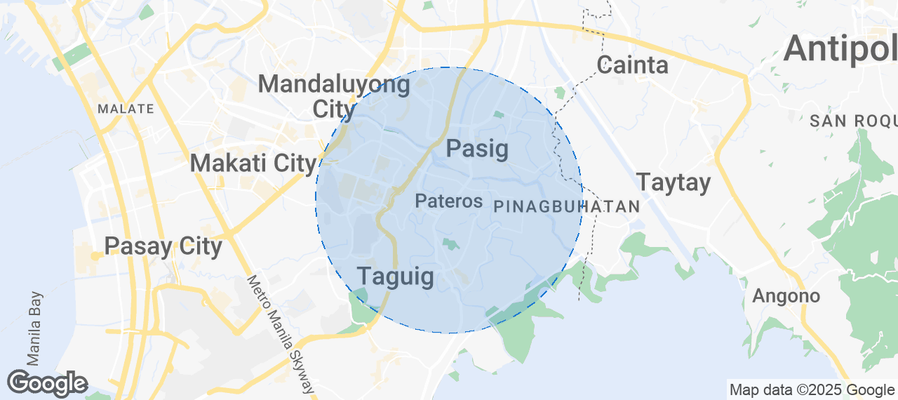
Is Airbnb profitable in Pateros in 2026? Explore comprehensive Airbnb analytics for Pateros, Metro Manila, Philippines to uncover income potential. This 2026 STR market report for Pateros, based on AirROI data from February 2025 to January 2026, reveals key trends in the niche market of 19 active listings.
Whether you're considering an Airbnb investment in Pateros, optimizing your existing vacation rental, or exploring rental arbitrage opportunities, understanding the Pateros Airbnb data is crucial. Leveraging the low regulation environment is key to maximizing your short term rental income potential. Let's dive into the specifics.
Key Pateros Airbnb Performance Metrics Overview
Monthly Airbnb Revenue Variations & Income Potential in Pateros (2026)
Understanding the monthly revenue variations for Airbnb listings in Pateros is key to maximizing your short term rental income potential. Seasonality significantly impacts earnings. Our analysis, based on data from the past 12 months, shows that the peak revenue month for STRs in Pateros is typically March, while January often presents the lowest earnings, highlighting opportunities for strategic pricing adjustments during shoulder and low seasons. Explore the typical Airbnb income in Pateros across different performance tiers:
- Best-in-class properties (Top 10%) achieve $291+ monthly, often utilizing dynamic pricing and superior guest experiences.
- Strong performing properties (Top 25%) earn $206 or more, indicating effective management and desirable locations/amenities.
- Typical properties (Median) generate around $125 per month, representing the average market performance.
- Entry-level properties (Bottom 25%) see earnings around $64, often with potential for optimization.
Average Monthly Airbnb Earnings Trend in Pateros
Pateros Airbnb Occupancy Rate Trends (2026)
Maximize your bookings by understanding the Pateros STR occupancy trends. Seasonal demand shifts significantly influence how often properties are booked. Typically, Marchsees the highest demand (peak season occupancy), while January experiences the lowest (low season). Effective strategies, like adjusting minimum stays or offering promotions, can boost occupancy during slower periods. Here's how different property tiers perform in Pateros:
- Best-in-class properties (Top 10%) achieve 60%+ occupancy, indicating high desirability and potentially optimized availability.
- Strong performing properties (Top 25%) maintain 44% or higher occupancy, suggesting good market fit and guest satisfaction.
- Typical properties (Median) have an occupancy rate around 26%.
- Entry-level properties (Bottom 25%) average 13% occupancy, potentially facing higher vacancy.
Average Monthly Occupancy Rate Trend in Pateros
Average Daily Rate (ADR) Airbnb Trends in Pateros (2026)
Effective short term rental pricing strategy in Pateros involves understanding monthly ADR fluctuations. The Average Daily Rate (ADR) for Airbnb in Pateros typically peaks in September and dips lowest during March. Leveraging Airbnb dynamic pricing tools or strategies based on this seasonality can significantly boost revenue. Here's a look at the typical nightly rates achieved:
- Best-in-class properties (Top 10%) command rates of $20+ per night, often due to premium features or locations.
- Strong performing properties (Top 25%) achieve nightly rates of $18 or more.
- Typical properties (Median) charge around $15 per night.
- Entry-level properties (Bottom 25%) earn around $14 per night.
Average Daily Rate (ADR) Trend by Month in Pateros
Get Live Pateros Market Intelligence 👇
Explore Real-time Analytics
Airbnb Seasonality Analysis & Trends in Pateros (2026)
Peak Season (March, August, February)
- Revenue averages $252 per month
- Occupancy rates average 43.5%
- Daily rates average $20
Shoulder Season
- Revenue averages $145 per month
- Occupancy maintains around 29.7%
- Daily rates hold near $22
Low Season (January, July, September)
- Revenue drops to average $101 per month
- Occupancy decreases to average 21.8%
- Daily rates adjust to average $23
Seasonality Insights for Pateros
- The Airbnb seasonality in Pateros shows highly seasonal trends requiring careful strategy. While the sections above show seasonal averages, it's also insightful to look at the extremes:
- During the high season, the absolute peak month showcases Pateros's highest earning potential, with monthly revenues capable of climbing to $281, occupancy reaching a high of 58.3%, and ADRs peaking at $27.
- Conversely, the slowest single month of the year, typically falling within the low season, marks the market's lowest point. In this month, revenue might dip to $68, occupancy could drop to 13.8%, and ADRs may adjust down to $17.
- Understanding both the seasonal averages and these monthly peaks and troughs in revenue, occupancy, and ADR is crucial for maximizing your Airbnb profit potential in Pateros.
Seasonal Strategies for Maximizing Profit
- Peak Season: Maximize revenue through premium pricing and potentially longer minimum stays. Ensure high availability.
- Low Season: Offer competitive pricing, special promotions (e.g., extended stay discounts), and flexible cancellation policies. Target off-season travelers like remote workers or budget-conscious guests.
- Shoulder Seasons: Implement dynamic pricing that balances peak and low rates. Target weekend travelers or specific events. Offer slightly more flexible terms than peak season.
- Regularly analyze your own performance against these Pateros seasonality benchmarks and adjust your pricing and availability strategy accordingly.
Best Areas for Airbnb Investment in Pateros (2026)
Exploring the top neighborhoods for short-term rentals in Pateros? This section highlights key areas, outlining why they are attractive for hosts and guests, along with notable local attractions. Consider these locations based on your target guest profile and investment strategy.
| Neighborhood / Area | Why Host Here? (Target Guests & Appeal) | Key Attractions & Landmarks |
|---|---|---|
| Poblacion | A vibrant and hip neighborhood in Makati known for its nightlife, trendy restaurants, and nightlife options. A popular spot for both tourists and locals looking for an exciting atmosphere. | Kismet, The Wild Poppy, Poblacion Night Market, Z Hostel Roofdeck, Agimat Foraging Bar |
| Bonifacio Global City (BGC) | Modern business district with luxury condos, shopping malls, and numerous restaurants. Attractive to business travelers and tourists seeking modern amenities and nightlife. | SM Aura Premier, Bonifacio High Street, Venice Grand Canal Mall, The Mind Museum, BGC Arts Center |
| Makati Central Business District | Pivotal financial hub of Metro Manila with high-rise buildings and business establishments. A go-to for business professionals and travelers on work trips. | Greenbelt Shopping Mall, Ayala Triangle Gardens, The Landmark, Power Plant Mall, Ayala Museum |
| Quezon City | Largest city in Metro Manila with diverse neighborhoods and attractions. Known for its rich cultural heritage and various parks, appealing to families and tourists. | Quezon Memorial Circle, Ninoy Aquino Parks and Wildlife Center, Arts in the City, University of the Philippines Diliman, Eastwood City |
| Malate | A historic district with a rich cultural background and nightlife. Popular among tourists seeking a blend of history and entertainment. | Malate Church, Roxas Boulevard, Remedios Circle, Makati Bay Walk, Kong's Diner |
| Ortigas Center | Located at the intersection of major cities, a busy commercial and business district known for shopping malls and office spaces. Ideal for business travelers and shopping enthusiasts. | SM Megamall, The Podium, Tiendesitas, Metrowalk, Capitol Commons |
| San Juan | A residential city known for its well-preserved heritage and local cuisine. Attracts those looking for a more laid-back and homey atmosphere. | Greenhills Shopping Center, The Immaculate Conception Cathedral, San Juan National High School, V. Mall, Little Baguio |
| Las Pinas | Known for its residential communities and the famous Bamboo Organ, offering a more suburban experience with access to key areas in Metro Manila. | Las Piñas Bamboo Organ, St. Joseph Parish Church, SM City Las Piñas, Cavite Expressway, Bamboo Organ Festival |
Understanding Airbnb License Requirements & STR Laws in Pateros (2026)
While Pateros, Metro Manila, Philippines currently shows low STR regulations, specific Airbnb license requirements might still exist or change. Always verify the latest short term rental regulations and Airbnb license requirements directly with local government authorities for Pateros to ensure full compliance before hosting.
(Source: AirROI data, 2026, finding no licensed listings among those analyzed)
Top Performing Airbnb Properties in Pateros (2026)
Benchmark your potential! Explore examples of top-performing Airbnb properties in Paterosbased on Trailing Twelve Month (TTM) revenue. Analyze their characteristics, revenue, occupancy rate, and ADR to understand what drives success in this market.
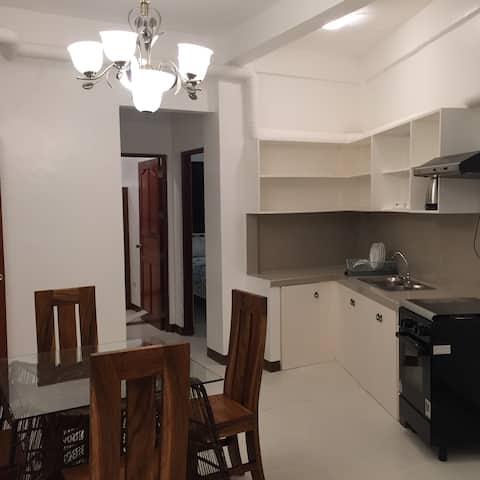
2 Bedroom Unit in Pateros - Melanio
Entire Place • 2 bedrooms
Open Plan Unit in Pateros MM -Pedro and Alejandra
Entire Place • N/A

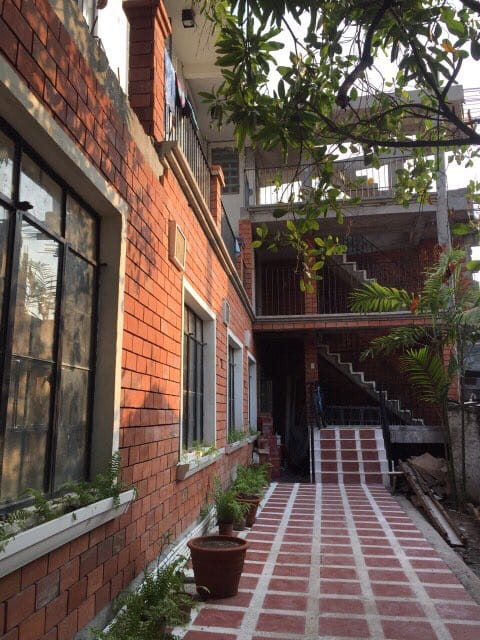
Casa B&B - Loft unit (D)
Entire Place • N/A

Studio Unit in Pateros - Maxima
Entire Place • N/A
Casa B&B - Loft unit (C)
Entire Place • N/A
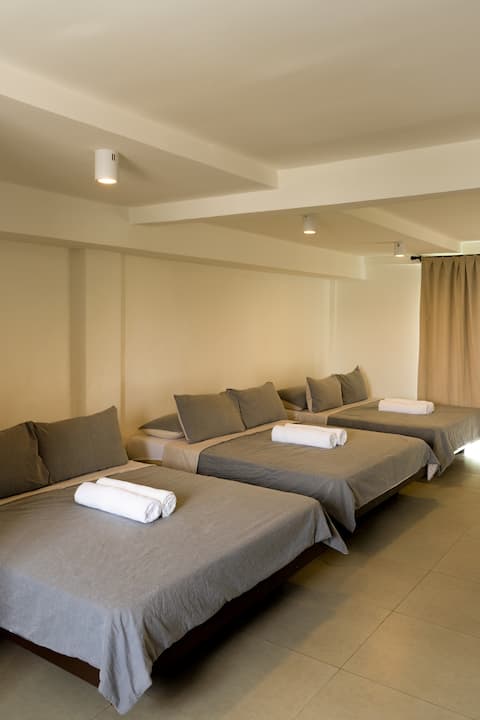
Large Studio Unit in Pateros, Metro Manila-Abigail
Entire Place • N/A
Note: Performance varies based on location, size, amenities, seasonality, and management quality. Data reflects the past 12 months.
Top Performing Airbnb Hosts in Pateros (2026)
Learn from the best! This table showcases top-performing Airbnb hosts in Pateros based on the number of properties managed and estimated total revenue over the past year. Analyze their scale and performance metrics.
| Host Name | Properties | Grossing Revenue | Stay Reviews | Avg Rating |
|---|---|---|---|---|
| Roy | 13 | $12,625 | 612 | 4.86/5.0 |
| David | 6 | $9,341 | 455 | 4.78/5.0 |
Analyzing the strategies of top hosts, such as their property selection, pricing, and guest communication, can offer valuable lessons for optimizing your own Airbnb operations in Pateros.
Dive Deeper: Advanced Pateros STR Market Data (2026)
Ready to unlock more insights? AirROI provides access to advanced metrics and comprehensive Airbnb data for Pateros. Explore detailed analytics beyond this report to refine your investment strategy, optimize pricing, and maximize your vacation rental profits.
Explore Advanced MetricsPateros Short-Term Rental Market Composition (2026): Property & Room Types
Room Type Distribution
Property Type Distribution
Market Composition Insights for Pateros
- The Pateros Airbnb market composition is heavily skewed towards Entire Home/Apt listings, which make up 100% of the 19 active rentals. This indicates strong guest preference for privacy and space.
- Looking at the property type distribution in Pateros, Apartment/Condo properties are the most common (78.9%), reflecting the local real estate landscape.
- Houses represent a significant 15.8% portion, catering likely to families or larger groups.
- The presence of 5.3% Hotel/Boutique listings indicates integration with traditional hospitality.
Pateros Airbnb Room Capacity Analysis (2026): Bedroom Distribution
Distribution of Listings by Number of Bedrooms
Room Capacity Insights for Pateros
- The dominant room capacity in Pateros is 2 bedrooms listings, making up 26.3% of the market. This suggests a strong demand for properties suitable for couples or solo travelers.
- Together, 2 bedrooms and 1 bedroom properties represent 31.6% of the active Airbnb listings in Pateros, indicating a high concentration in these sizes.
Pateros Vacation Rental Guest Capacity Trends (2026)
Distribution of Listings by Guest Capacity
Guest Capacity Insights for Pateros
- The most common guest capacity trend in Pateros vacation rentals is listings accommodating 2 guests (31.6%). This suggests the primary traveler segment is likely couples or solo travelers.
- Properties designed for 2 guests and 4 guests dominate the Pateros STR market, accounting for 63.2% of listings.
- 31.6% of properties accommodate 6+ guests, serving the market segment for larger families or group travel in Pateros.
- On average, properties in Pateros are equipped to host 4.3 guests.
Pateros Airbnb Booking Patterns (2026): Available vs. Booked Days
Available Days Distribution
Booked Days Distribution
Booking Pattern Insights for Pateros
- The most common availability pattern in Pateros falls within the 271-366 days range, representing 84.2% of listings. This suggests many properties have significant open periods on their calendars.
- Approximately 100.0% of listings show high availability (181+ days open annually), indicating potential for increased bookings or specific owner usage patterns.
- For booked days, the 31-90 days range is most frequent in Pateros (68.4%), reflecting common guest stay durations or potential owner blocking patterns.
Pateros Airbnb Minimum Stay Requirements Analysis
Distribution of Listings by Minimum Night Requirement
1 Night
9 listings
47.4% of total
2 Nights
1 listings
5.3% of total
30+ Nights
9 listings
47.4% of total
Key Insights
- The most prevalent minimum stay requirement in Pateros is 1 Night, adopted by 47.4% of listings. This highlights the market's preference for shorter, flexible bookings.
- A significant segment (47.4%) caters to monthly stays (30+ nights) in Pateros, pointing to opportunities in the extended-stay market.
Recommendations
- Align with the market by considering a 1 Night minimum stay, as 47.4% of Pateros hosts use this setting.
- Explore offering discounts for stays of 30+ nights to attract the 47.4% of the market seeking extended stays.
- Adjust minimum nights based on seasonality – potentially shorter during low season and longer during peak demand periods in Pateros.
Pateros Airbnb Cancellation Policy Trends Analysis (2026)
Flexible
2 listings
10.5% of total
Firm
6 listings
31.6% of total
Strict
11 listings
57.9% of total
Cancellation Policy Insights for Pateros
- The prevailing Airbnb cancellation policy trend in Pateros is Strict, used by 57.9% of listings.
- A majority (89.5%) of hosts in Pateros utilize Firm or Strict policies, indicating a market where hosts prioritize booking security.
Recommendations for Hosts
- Consider adopting a Strict policy to align with the 57.9% market standard in Pateros.
- With 57.9% using Strict terms, this is a viable option in Pateros, particularly for high-value properties or during peak demand periods.
- Regularly review your cancellation policy against competitors and market demand shifts in Pateros.
Pateros STR Booking Lead Time Analysis (2026)
Average Booking Lead Time by Month
Booking Lead Time Insights for Pateros
- The overall average booking lead time for vacation rentals in Pateros is 12 days.
- Guests book furthest in advance for stays during October (average 37 days), likely coinciding with peak travel demand or local events.
- The shortest booking windows occur for stays in August (average 3 days), indicating more last-minute travel plans during this time.
- Seasonally, Fall (19 days avg.) sees the longest lead times, while Summer (5 days avg.) has the shortest, reflecting typical travel planning cycles.
Recommendations for Hosts
- Use the overall average lead time (12 days) as a baseline for your pricing and availability strategy in Pateros.
- For October stays, consider implementing length-of-stay discounts or slightly higher rates for bookings made less than 37 days out to capitalize on advance planning.
- During August, focus on last-minute booking availability and promotions, as guests book with very short notice (3 days avg.).
- Target marketing efforts for the Fall season well in advance (at least 19 days) to capture early planners.
- Monitor your own booking lead times against these Pateros averages to identify opportunities for dynamic pricing adjustments.
Popular & Essential Airbnb Amenities in Pateros (2026)
Amenity Prevalence
Amenity Insights for Pateros
- Essential amenities in Pateros that guests expect include: Bed linens, Air conditioning, Wifi. Lacking these (any) could significantly impact bookings.
- Popular amenities like Hot water, Private entrance, Paid parking on premises are common but not universal. Offering these can provide a competitive edge.
Recommendations for Hosts
- Ensure your listing includes all essential amenities for Pateros: Bed linens, Air conditioning, Wifi.
- Consider adding popular differentiators like Hot water or Private entrance to increase appeal.
- Highlight unique or less common amenities you offer (e.g., hot tub, dedicated workspace, EV charger) in your listing description and photos.
- Regularly check competitor amenities in Pateros to stay competitive.
Pateros Airbnb Guest Demographics & Profile Analysis (2026)
Guest Profile Summary for Pateros
- The typical guest profile for Airbnb in Pateros consists of primarily domestic travelers (67%), often arriving from nearby Taguig, typically belonging to the Post-2000s (Gen Z/Alpha) group (50%), primarily speaking English or Tagalog.
- Domestic travelers account for 66.7% of guests.
- Key international markets include Philippines (66.7%) and Guam (19.7%).
- Top languages spoken are English (48.6%) followed by Tagalog (25.7%).
- A significant demographic segment is the Post-2000s (Gen Z/Alpha) group, representing 50% of guests.
Recommendations for Hosts
- Target domestic marketing efforts towards travelers from Taguig and Manila.
- Tailor amenities and listing descriptions to appeal to the dominant Post-2000s (Gen Z/Alpha) demographic (e.g., highlight fast WiFi, smart home features, local guides).
- Highlight unique local experiences or amenities relevant to the primary guest profile.
- Consider seasonal promotions aligned with peak travel times for key origin markets.
Nearby Short-Term Rental Market Comparison
How does the Pateros Airbnb market stack up against its neighbors? Compare key performance metrics like average monthly revenue, ADR, and occupancy rates in surrounding areas to understand the broader regional STR landscape.
| Market | Active Properties | Monthly Revenue | Daily Rate | Avg. Occupancy |
|---|---|---|---|---|
| Bustos | 10 | $1,728 | $216.86 | 28% |
| Cabangan | 44 | $1,529 | $200.94 | 26% |
| Lian | 121 | $1,491 | $216.20 | 24% |
| Jalajala | 19 | $1,489 | $234.86 | 21% |
| Laoag | 17 | $1,412 | $158.39 | 33% |
| Beneg | 13 | $1,304 | $267.34 | 22% |
| Arew | 11 | $1,288 | $193.81 | 22% |
| Cabuyao | 25 | $1,202 | $114.93 | 36% |
| Binangonan | 49 | $1,191 | $135.12 | 29% |
| Porac | 51 | $1,157 | $203.91 | 21% |